Supply and Demand Zones vs. Support and Resistance: What’s the Real Difference?

Most traders learn about support and resistance first, as those are the basics of technical analysis. They draw lines connecting previous highs or lows, hoping for the price to bounce at some point. And it works sometimes. But the truth is that this line on the chart may fail as well.
Beginners in binary options and CFD trading often say that technical analysis does not work properly when they see that such thin lines are broken by the price many times in both directions as they expect clear entries. Here is where supply and demand zones come into play. These areas are often used by professional traders instead of simple support and resistance lines and help them improve their trading results. By reading further, you will learn more about supply and demand zones and how to apply them in trading.
Contents
- 1 The Core Difference Between Both Concepts
- 2 Start Using Supply and Demand Zones with Binolla
- 3 How to Draw Supply and Demand Zones Correctly
- 4 Confluence: What Makes Zones Worth Trading
- 5 How to Trade Demand and Supply Zones: The Entry Plan
- 6 Risk Management for Zone Trades
- 7 Common Mistakes to Avoid
- 8 Conclusion
- 9 FAQ
The Core Difference Between Both Concepts
You have already probably heard about support and resistance lines. If not, read our articles about them and how to draw them. Those lines are very useful, and combined with price action patterns, they can give a lot of profitable signals. However, what you will learn in this article will help you understand the basic market concept and review your strategies to make them even more effective.
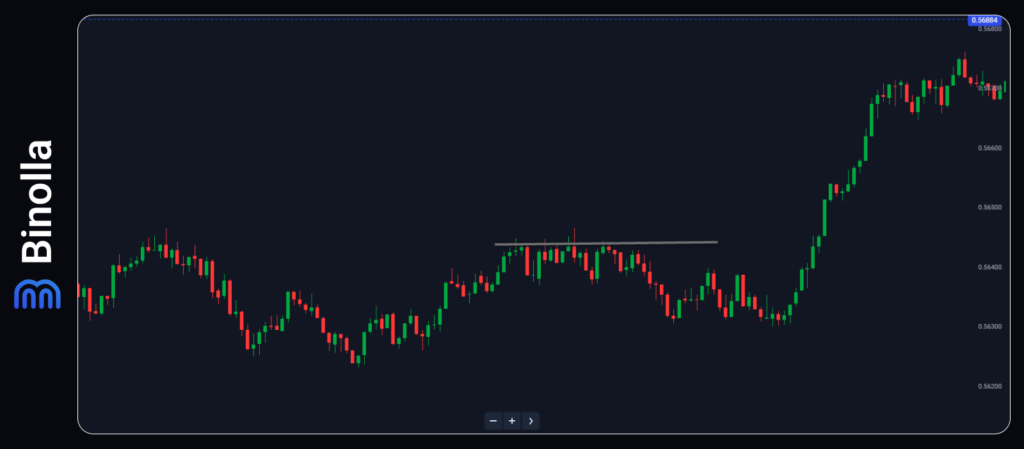
The key difference between these concepts is that support and resistance levels are reactive. This means that you check each bounce trying to catch the movement, like in the example above. When you find the next bounce, you try to trade in the opposite side after finding a reversal signal. This is not a bad strategy, but the concept is totally different.
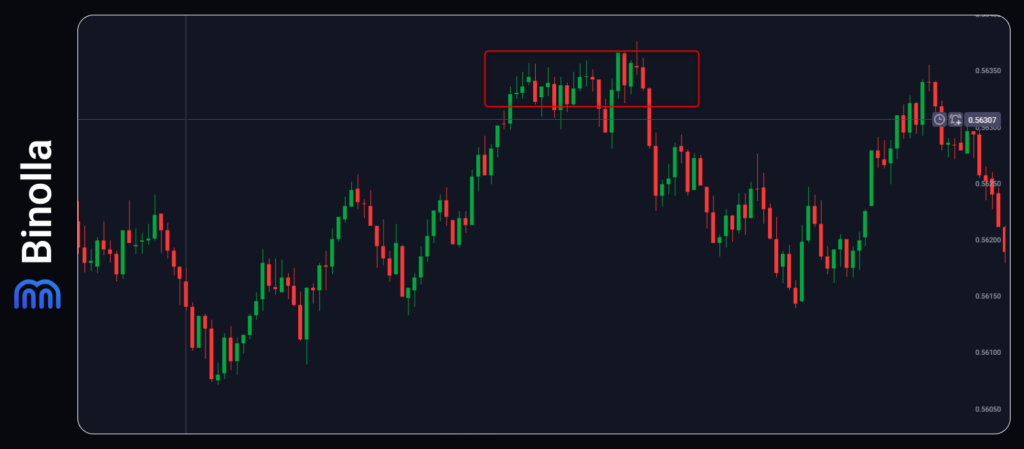
When it comes to supply and demand zones, they are proactive. You don’t need to follow each touch and bounce at all. What is important for you in this situation is the origin of a strong price movement. If you find a demand zone, you expect an explosive upside rally, while when you find a supply zone, you wait for a serious price drop.
Therefore, a practical difference lies in how you draw both. For support and resistance, you just connect lows and highs with a thin line. For supply and demand, you draw a rectangle that covers the price area, instead of connecting dots. Support and resistance focus on previous reversals, while supply and demand draw attention to large orders that may be resting there.

Start Using Supply and Demand Zones with Binolla
Join the brokerage and apply these zones in your strategies
Join nowWhat does both tell you? Support and resistance suggest that the price may stop at some point and reverse there. Supply and demand zones assume that big buyers or sellers have placed orders there, and they might still be waiting.
How to Draw Supply and Demand Zones Correctly
Drawing zones like drawing support and resistance lines is not about guessing. You should follow some rules to make it clear. Find out how to find and draw such areas on your chart.
Step 1: Find the Explosive Move.
First, you need to scan your charts to find an aggressive price movement. You want to see large candles moving in the same direction one by one. A small grind upward is not a demand zone. What you look for is a near-vertical rally. The same is for the supply zone. You look for large candles moving to the bottom of the chart one by one.
Step 2: Locate the base or the top.
Now you need to look to the left of this explosive move. You will see price consolidation, usually two or three candles high. This is where big orders are consolidated. This is where you draw a rectangle. However, if you see no clear base or top zone, you don’t draw anything and just skip.
Step 3: Draw the rectangle.
There are three methods of how to draw the zone, and you will see it in the table below. The aggressive method is when the zone is drawn from the highest to the lowest wick. The conservative is when you use only the range between the body and the wick. Remember that consistency matters, which means that you should choose one of the methods and stick to it.
| Drawing Method | How You Draw It | What It Means for the Trade |
| Aggressive (full wick-to-wick) | From the highest wick to the lowest wick of the base | Wider zone, more room for price to react, but a larger stop loss and lower risk-to-reward |
| Conservative (body-to-wick) | From the body high to the wick low of the base | Narrower zone, tighter stop, better risk-to-reward, but a higher chance of being missed |
| Order block (single candle) | Only the last opposing candle before the move | Tightest zone, smallest stop, but the highest chance of a fake reaction and stop-out |
Step 4: Label the zone.
After you create a zone, you need to label it to use it in the future. You can also write somewhere the range, and once the price moves there later, you will see that it entered a supply or demand zone. Keep in mind that such zones can also be continuational, which means that after a rally, the price reaches the supply zone, and then it may move above. However, at the beginning, it is enough to learn such reversal patterns.
Confluence: What Makes Zones Worth Trading
The zone is just a rectangle. What makes it valuable for traders is confluence, which means that along with the zone, you see some reliable signals or factors that line up. There are several ways to receive this confluence in trading:
- Higher timeframe alignment. Before placing a trade, go to a higher timeframe and watch the situation there. For instance, if you see a demand zone on a 1-minute chart, then if you can confirm it on a 5-minute chart, this will be a good confluence. A small zone within a larger zone is a great signal, while a small zone alone is a lottery.
- Freshness. Fresh supply and demand zones have a higher probability because the unfilled orders are still there. Once the price returns and bounces, some of those orders are filled. If a zone has been touched many times in the past, it is not a zone anymore but just a memory.
- Volume confirmation. If the explosive move came with explosive volume spikes, it is a good sign. It confirms real participation and not just a thin market.
How to Trade Demand and Supply Zones: The Entry Plan
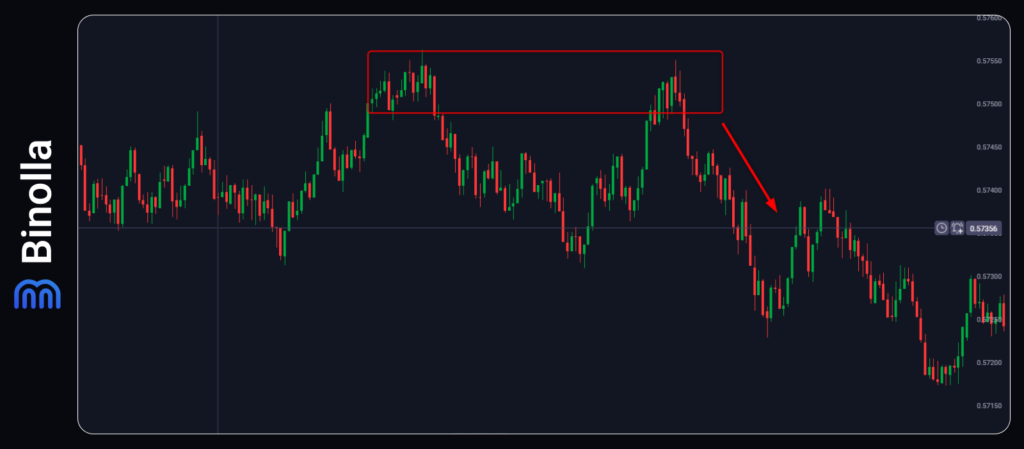
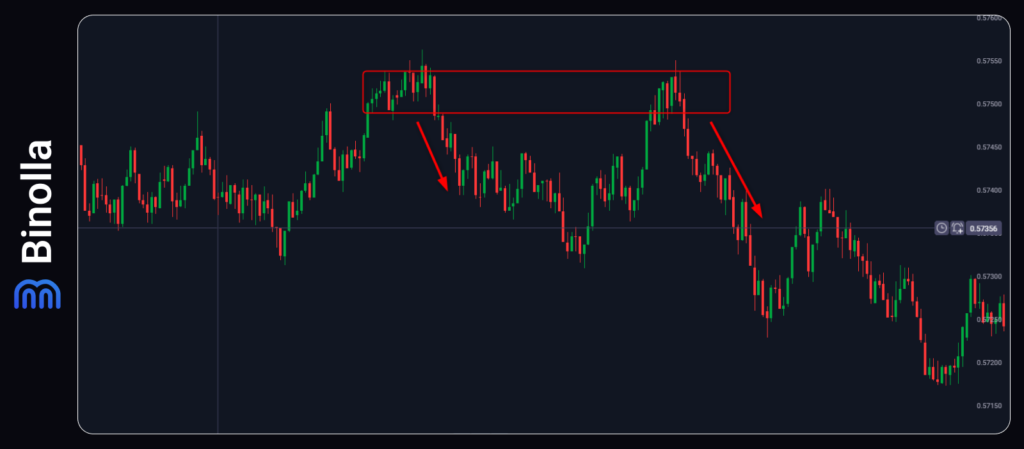
In order to trade demand and supply zones successfully, you can use three main strategies. They depend on your trading style and preferences. One of the biggest mistakes many beginners make is that they place lower or sell orders at the top of the supply zone and higher or buy orders at the bottom of the demand zone.
The key idea of the strategy is that the price should leave these zones, and this is the right moment to join the movement. Now let’s look at the most popular strategies.
The first method is to place a limit order below the supply zone and above the demand zone. To trade with this method, you simply need to draw a rectangle. Then you watch the market. If you are trading the supply zone, place a pending order slightly below the lower line of the rectangle. When trading the demand zone, a pending order should be placed slightly above the upper line of the rectangle.
The next method is to wait for a retest. The price sometimes moves back to the zone after a breakout, and this is a great opportunity for a trader to enter. You can use this strategy in combination with the first method and just add to your existing position when you trade CFDs. If you are trading binary options, your first breakout trade will be likely closed by this moment, and you can simply re-enter on the retest after the price resumes its movement into the breakout direction.
Finally, you can enter on the breakout manually, without placing pending orders. To do that, just wait for the price to break the upper line of the demand zone or the lower line of the supply area and place a trade. This method is suitable for active traders who spend much time on the platform. If you don’t have enough time to follow the price movement, you can use pending orders. By the way, with Binolla, pending orders are available for binary options. You just set the level and choose the type of contract, expiration and investment amount. Once the price reaches this level, the order triggers.
Risk Management for Zone Trades
Even the best supply and demand zones are useless without proper risk management. Here are some important rules that will help you keep your balance positive:
- Think about your position size. For binary options, you can risk no more than 10% per trade. When it comes to CFDs, size the position from the stop and not from the entry point. If your stop is 20 points from the entry price, then you should think about your position size from this angle.
- Use the ATR to check your stop. This rule is applicable for CFD traders only, as in binary options, you don’t need to limit your trade with stops. The rule is simple: if the stop is tighter than normal volatility, you should widen it or skip the trade. Remember that the market does not care about your rectangles.
- Plan the target before you enter. This rule is also designed for CFD traders, but binary option traders who plan to stay in the market for more than just the next candle can also check it. You should know in advance where your targets will be. How to define your targets? If you are trading on the supply zone breakout, you can look for the closest support, for instance.
- Do not move to breakeven too early. CFD traders sometimes move their stops to breakeven once the price goes in their direction. The problem is that in times of higher volatility, the price may move in the opposite direction and trigger a stop loss, which is now at breakeven. To avoid this, wait for the price to make a significant distance before changing your stop loss position.
Common Mistakes to Avoid
Traders often make mistakes that do not allow them to trade profitably. Here are some common ones that you should consider when trading supply and demand zones:
- Drawing too many zones. Do not turn your charts into the Christmas tree. Draw a couple of zones instead of fifty. If the zone is weak, just remove it. A lot of drawings may prevent you from seeing a bigger picture.
- Ignoring a trend. A demand zone in a strong downtrend is a countertrend trade. It works, but you should think about the possibility of a failure. Therefore, you should see a clear upside breakout before you place a trade.
- Trading inside the zone. One of the biggest mistakes traders make is when they place trades within the rectangle. Before entering the market, you should wait for the price to leave the rectangle.
- Trusting the strategy 100%. There is no guaranteed strategy in trading. Each method you use improves your chances, but trusting it blindly is a big mistake. Moreover, some external events like news or central bank decisions may break the structure. Therefore, you should trade these zones only after you check global context.
Conclusion
Support and resistance tells you where the price may reverse. Supply and demand zones allow you to see where large orders are consolidated and a bigger move may start. This zone is not just a rectangle; it is a footprint of market imbalance between buyers and sellers. With this strategy, you can significantly improve your trading results. But you should learn how to use it and when to apply to avoid serious trading mistakes. This is how you can turn a simple rectangle into a real trading edge.
FAQ
Are supply and demand zones better than support and resistance?
No, neither is better. Support and resistance give context and structure, while areas allow you to enter with higher precision and better risk-to-reward. You can use both depending on the current market situation.
How do I know which zone will work?
No one can know in advance which zone will work. This is why professional traders use confluence; they watch higher timeframe alignment, volumes, and price reaction. No filter is perfect, but they can improve your chances.
What is the difference between a demand zone and a bullish order block?
A demand zone covers the whole area before a rally. A bullish order block focuses on the last bearish candle within this zone. The idea is the same, but the stop is tighter.
How many times can a zone be tested before it becomes useless?
There is no exact measure for this. Fresh zones are stronger because they have orders within. Each touch fills more orders, which means that at some point there will be none in the area.
Do I need indicators to trade these zones?
No, you can use price action only. Candlesticks and rectangles are enough. You can also add some volume tools.