The Doji in Trading: A Comprehensive Introductory Guide

Trading patterns are very popular among binary options and Forex traders for showing them where the market may move next without requiring a lot of knowledge in technical or fundamental analysis. Once you spot the shape, you can get into action. Doji is among the most frequent candles so far, and you will find a lot of them on the chart. So, knowing how to trade this pattern is crucial for long-term trading success. By reading further, you will learn what a doji is, delve into types of dojis, and discover some strategies.
Contents
What is a Doji Candlestick
A doji is a candle that represents a balance between buyers and sellers during the period. The candlestick has no body, just a thick line, which means that the price started the period at the same level at which it was closed. The term “doji” refers to the “same thing” in Japanese, as it was introduced by the inventor of Japanese candlesticks, Munehisa Homma. The key takeaway is that the pattern means that the market ended a specific period in indecision.
During the period, prices may have swung significantly, as the vertical line shows the maximum and the minimum. However, by the end of the session, market participants moved the price to its open level, where the candle started to build.
The Psychology Behind the Doji Candle
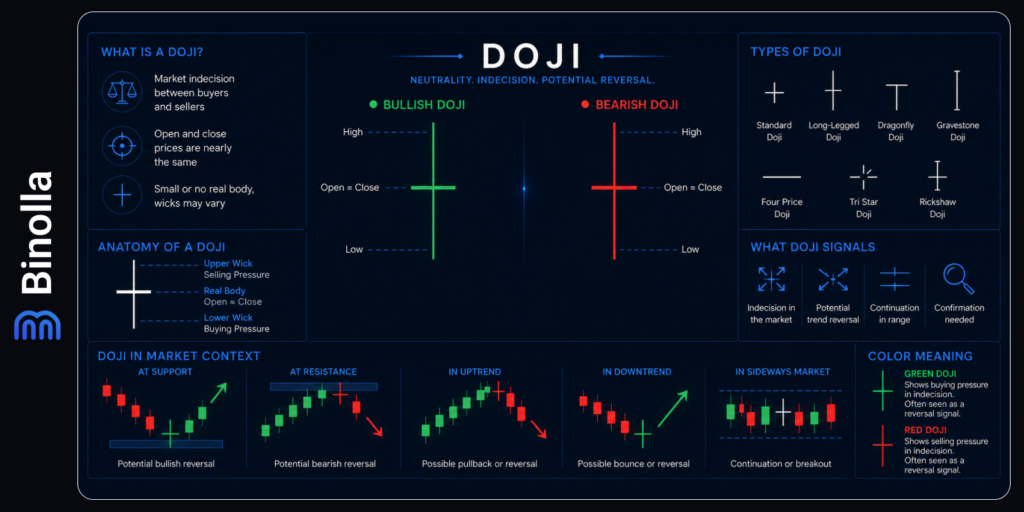
To understand the doji candle, it is worth delving deeper into the market psychology behind the pattern. Each candle tells how the battle between bulls and bears ended in a specific period. For instance, if we speak about the hammer pattern, we can say that bears were trying to break below the support level and almost made it, while bulls took control by the end of the period and covered almost all previous bearish movement or even managed to break above the session start, confirming the possibility of a reversal.
When it comes to the doji, it tells a completely different story. Bears were attempting to break below the support level, but bulls regained control. However, unlike the hammer pattern, where bulls win the session, in the doji, they also fail to move the price higher. Neither side could establish lasting control.
This balance on the market is often considered an indicator of a reversal. However, doji should never be treated as a strong reversal pattern. The indecision in the market can resolve in either a reversal or trend continuation.

Start Using Doji in Your Strategies at Binolla
Learn the doji pattern and apply it to your trading strategeis in trading with Binolla
Join nowTypes of Doji Candlesticks
The “doji” is a common name for a variety of candlestick patterns that have no body. There are several variations of dojis that you can meet on charts depending on the market situation. Below, you can find the most common types of these patterns explained.
Standard Doji
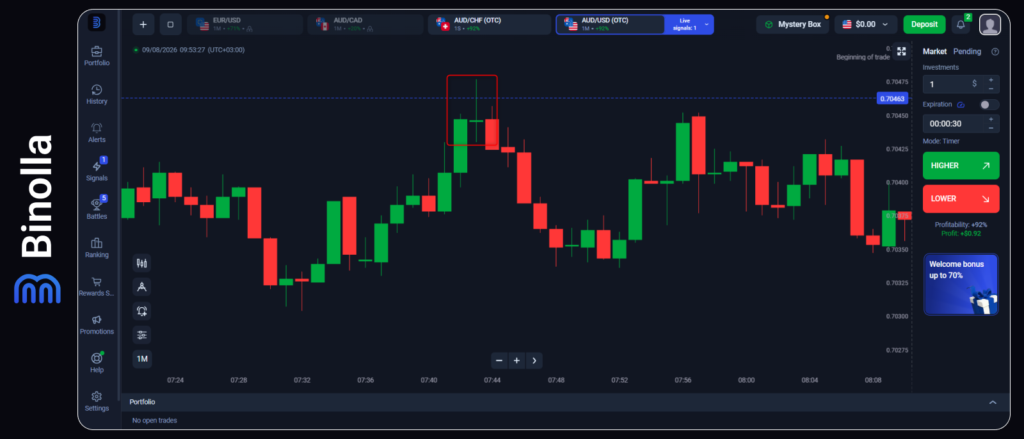
The standard doji appears as a cross with two shadows at the top and at the bottom and no body at all (a horizontal line). As you can see in the screenshot above, the doji can be both green and red. In most cases, the color doesn’t matter, as if it is a reversal; for instance, it can occur after both types. This classic doji represents a standoff between both sides. The market attempted to move in both directions, but these probes resulted in nothing. The significance comes entirely from the surrounding context.
In our example, the doji is formed at the top of the range, close to the resistance level. Bulls were trying to break above this line, but failed. Therefore, after the doji closes, you can try to find confirming signals. No indicators even needed. If the price breaks below the lowest point of this doji candle, you can buy a Lower contract. If not, just watch the situation or skip to avoid mistakes.
Standard Doji Strategy
The standard doji is a pure pattern of uncertainty, which means that trading it like a classic reversal pattern is a bad idea. So, first, you should look at a context. A standard doji at the top means that market is uncertaint whether to resume the upside or not. The strategy here is simple: wait for the price to break above the highest point to buy a Higher contract or below the lowest point to buy a Lower contract.
When it comes to a doji at the bottom, the idea is the same. You just wait for the price to break below or above the highest points to buy a Lower or a Higher contract.
Dragonfly Doji
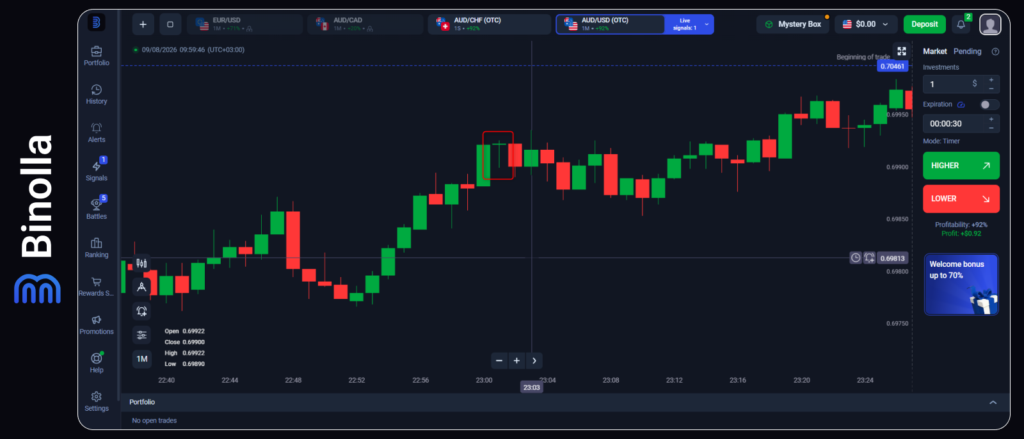
The Dragonfly doji looks like a capital T on the chart. In our example, it is close to this shape, so we can consider it a dragonfly doji. Remember that patterns will not look like their classic guide shapes all the time. What is important here is the context. This formation says that sellers attempted to set control, but buyers managed to return the price to its initial position. When this doji appears at the end of the downtrend, it may tell traders that a reversal is close. Found at the top, the dragonfly doji suggests that a downside movement is possible.
In our case, you can see that the next candle is red. However, volatility becomes narrow, which means that trading in such conditions may be very risky.
Dragonfly Doji Strategy
This type of doji looks like a hammer or a hanging man. This means that trading it the same way will be a good idea. If a dragonfly doji is at the top of the market, then you can buy a Lower contract once the price breaks below the lowest point of the pattern. If you find it at the bottom, then buying a Higher contract will be a good solution.
Gravestone Doji
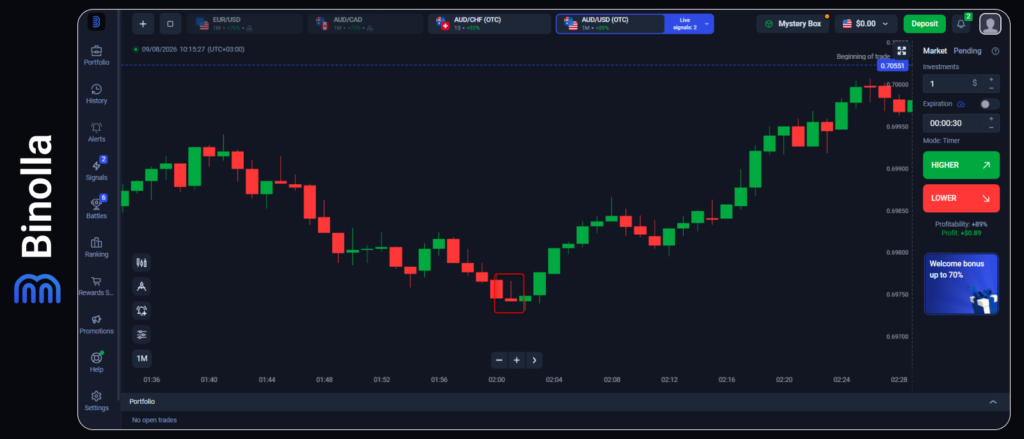
The gravestone doji is a mirror pattern of the dragonfly formation, which resembles an inverted T letter. This time, buyers were attempting to gain control, but by the end of the session, sellers took the price lower, and the candle closed where it began. Similar to the dragonfly doji, the gravestone formation has more reversal power, meaning that you can expect the price to choose another direction after you see it.
In our example above, you can see a gravestone doji at the bottom of the market. This means that you can expect the price to take an upside direction in the near future. The price moves higher a bit later. To benefit from this situation, it is recommended to wait until the quotes move above the higher point of the gravestone candle and then buy a Higher contract or simply buy.
Both dragonfly and gravestone dojis are hammer-like patterns. And they truly are. Once you find them, you can treat them as a hammer, hanging man, shooting star, or inverted hammer depending on the context. In this particular case, we have an inverted hammer, which means that an upside reversal may come soon.
Gravestone Doji Strategy
This pattern is similar to the inverted hammer and shooting star. Therefore, if you find a gravestone doji at the bottom of the market, you buy a Higher contract when the price breaks above the highest point of the formation. If it is located at the top, then you just buy a Lower contract.
Long-Legged Doji
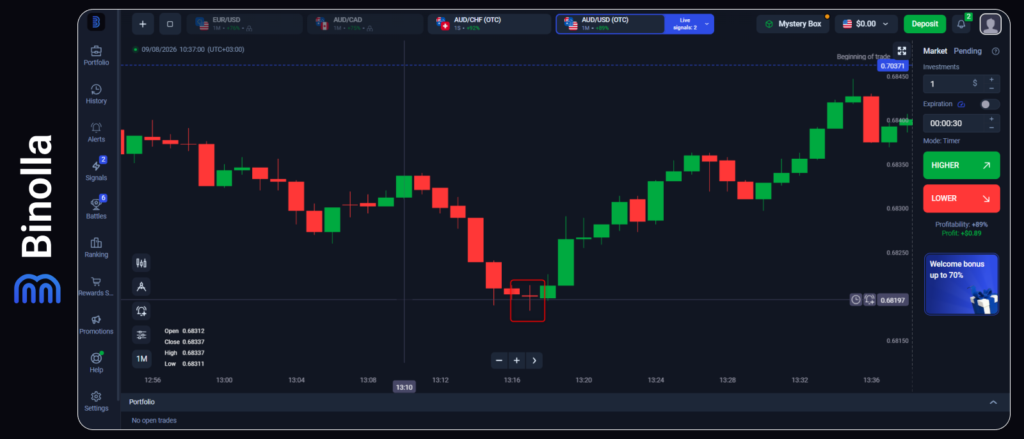
This is an exaggerated version of the standard doji. The pattern has two long tails and no body. This formation tells traders that neither side can gain control. This means that entering in any direction right after the candle appears is very dangerous. However, as always, traders can watch for confirmations and then enter a trade. In this case, if a long-legged doji appears at the bottom of the chart, just wait for the price to move above a higher tail to buy a Higher contract. However, if the price breaks below the lower tail, you should enter a Lower trade.
How to Read a Doji in Context
One of the most important things that traders should keep in mind when trading with dojis is the context. Without it, you may fail and find wrong entries. The context is even more important when trading dojis than any other candles. Therefore, below you will find some explanations on how to deal with dojis in different market contexts.
Doji in an Uptrend
A doji found after a strong and decisive upside movement can be a sign of a slowdown or even a reversal. The bulls were in complete control for some time, but they are facing stronger resistance. The market is pausing to catch its breath, and this pause can be the beginning of a reversal. Dojis like gravestone or dragonfly at the top of the market are often viewed as reversal patterns in this context.
Doji in a Downtrend
When it comes to the downtrend, a doji formed at its bottom suggests that the selling pressure is easing. Bulls try to change the situation, while bears are no longer controlling the price. Both dragonfly and gravestone dojis in this context may tell you that the market is going to reverse. However, do not forget to wait for a confirmation as dojis alone are not signals.
The Importance of Confirmation
One of the most important concepts for any trader is to understand when to enter a trade. Most beginners step in right after the doji is closed. Remember that the doji itself is a signal of indecision. Therefore, you need some additional confirmation before entering a trade. To confirm the signal, traders wait for the next candle:
- Bullish confirmation. If a doji appears at the bottom of the market, wait for the next candle to close or to break above the highest point of the doji candle. When this happens, buyers take control completely and break the latest bear’s bastion before pushing the price higher.
- Bearish confirmation. When the price is at the top of the market and a doji appears. Before entering a trade, you need to wait for the next candle to close below the doji’s lowest point or before the next candle breaks below.
Limitations and Risks of Trading Doji Patterns
Every technical pattern has both sides. The doji is no exception. Understanding limitations is as important as memorizing the patterns themselves:
- Doji patterns do not predict future prices. Classic dojis are patterns of indecision, which means that they do not tell you about future price movement. Unlike hammer or shooting star, classic and long-legged dojis should be confirmed by the next candle before you enter a trade.
- Dojis are subjective. Traders often confuse dojis with spinning tops or other patterns. While this is not a big mistake in most cases, knowing what a doji is will help you understand where the market is in indecision or where the future direction is more predictable.
- False signals. A doji that appears during a strong signal can be a brief pause before continuation. Many doji patterns lead to nothing at all, which means that in these cases, it is worth avoiding trading them.
- Noise and frequency. Not all dojis are frequent. If you take classic dojis, they appear almost every hour on the minute chart. However, dragonfly, gravestone, and even long-legged dojis are rare. Also, you should check for the noise, as dojis can be just a burst of volatility rather than a signal.
Conclusion
The doji candlestick is a powerful pattern that most professional traders use in their trading patterns. However, before applying it, you should understand all the pros and cons, which will allow you to make more reasonable decisions. Practice the pattern, apply strict money and risk management, and this formation will give you more trading opportunities.
FAQ
What exactly does a Doji candlestick indicate?
A doji candlestick shows that the market is in indecision. It forms when the opening and closing prices are identical or virtually identical, showing that neither buyers nor sellers can gain control.
What are the main types of Doji patterns?
The main and most common types of dojis include classic, long-legged, gravestone, and dragonfly.
Is doji a reversal pattern?
Not necessarily. A doji can be a reversal pattern under specific conditions. However, you should treat it as a pattern of indecision and wait for more confirmations and confluences before making the final decision.
How should I trade a doji pattern?
Once you spot a doji pattern, you should first wait for the candle to close. Next, check the context (whether it is at the top of the uptrend or at the bottom of the downtrend, for instance). If all is confirmed, then wait for the next candle to make the final decision.
What is the difference between a doji and a spinning top?
A spinning top pattern signals indecision as well, but they differ by body size. A doji has no body or a tiny body, while a spinning top may have a longer body and shorter legs.