Breakouts vs. Fakeouts in Binary Options Trading

Almost every binary option trader who trades breakouts has experienced fakeouts when the price pierces the key level but then returns below or above it, bringing losses. Trading breakouts is a great and reliable strategy, but to make the most of it, you should understand how to filter clear signals. By reading this article, you will learn more about breakouts and fakeouts and how to avoid the latter in your trading sessions.
Contents
- 1 Understanding Breakouts
- 2 Start Using Breakouts and Fakeouts in Trading with Binolla
- 3 Types of Breakouts in Binary Options
- 4 Fakeouts: Basics of Fake Breakouts in Binary Options Trading
- 5 Critical Difference between Breakouts and Fakeouts
- 6 The Decision-Making Example
- 7 Retests in Binary Options Trading
- 8 Trading Strategies for Breakouts and Fakeouts
- 9 Risk Management for Breakout and Fakeout Trading
- 10 Conclusion
- 11 FAQ
- 11.1 How can I determine if a breakout is genuine before it happens?
- 11.2 Are certain assets more prone to fakeouts than others?
- 11.3 What timeframes are best for trading breakouts in binary options?
- 11.4 How to handle news events when trading breakouts?
- 11.5 What indicators are most helpful for distinguishing breakouts from fakeouts?
- 11.6 Can I profitably trade both breakouts and fakeouts?
- 11.7 What’s the single most common mistake traders make with breakouts and fakeouts?
Understanding Breakouts
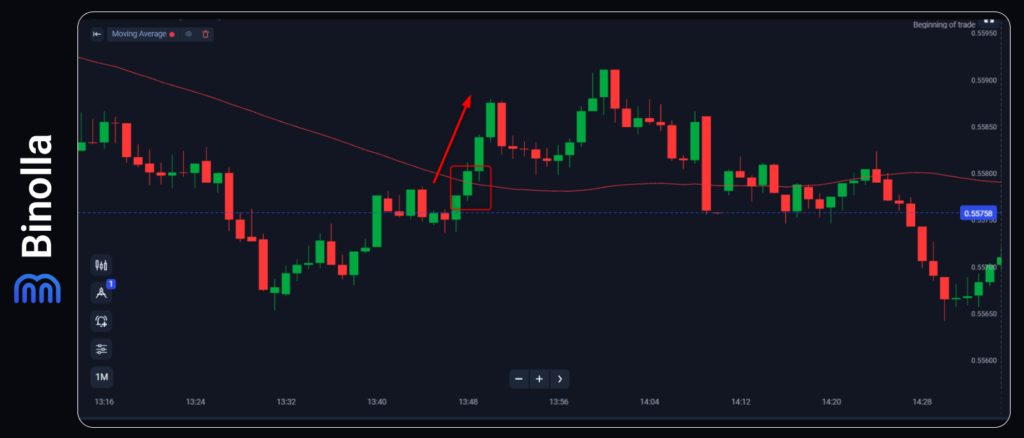
A breakout is a market situation when the price breaks above the resistance level or below the support line and moves further in the chosen direction. The idea of trading breakouts is simple. You just wait for the price to break above a level and then buy a contract in the right direction. For instance, if the price moves above the resistance level, you buy a Higher contract, while if it moves below the support, you buy a Lower contract.
Key Features of Breakouts
To understand whether a breakout occurs, professional traders often use some important criteria. They help them avoid false breakouts and increase the number of profitable trades:
- Volume confirmation. This is one of the most reliable ways to confirm a breakout. When the volume rises during the breakout, the chances that the movement will continue increase.
- RSI confirmation. Momentum indicators like RSI often show readings above 70 when the breakout occurs. This doesn’t mean a trade should seek a reversal or correction. Remember, the indicator may stay in this zone for a long time.
- Clean break through levels. The price typically moves strongly beyond levels and not just touching them. This move can be at least 1-2% beyond the level.

Start Using Breakouts and Fakeouts in Trading with Binolla
Join Binolla right now and apply breakout and fakeout strategies
Join nowTypes of Breakouts in Binary Options
Breakout is a common term for various market situations depending on the context. Here you can find all the most popular types of breakouts that may occur:
- Trend continuation breakout. It occurs during the consolidation phase of a trend. When the upside movement is developing, the price may pause for a while, forming a consolidation corridor. When the resistance line is broken, the upside continues.
- Range breakouts. The context is simple: the price moves without a clear direction between support and resistance lines. At some point, the price breaks above resistance or below support.
- Reversal breakouts. When the trend reverses, the price breaks the trendline and starts moving in the opposite direction.
Fakeouts: Basics of Fake Breakouts in Binary Options Trading
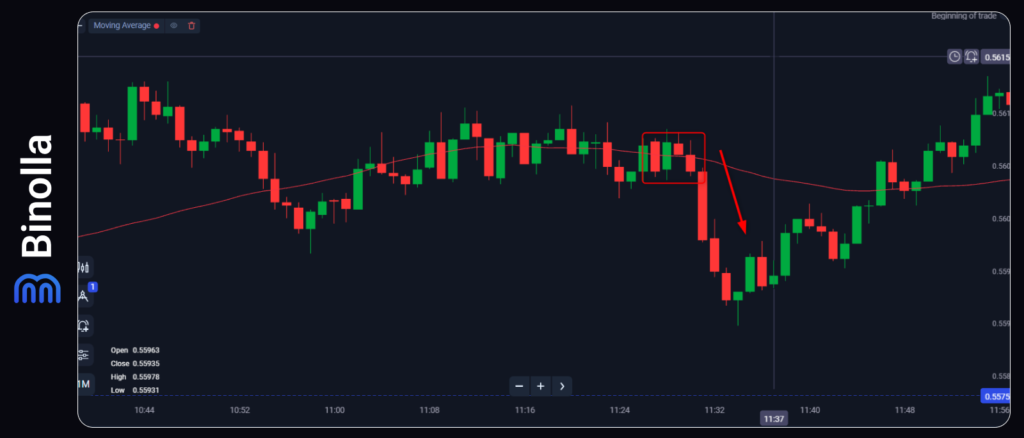
Fakeouts or whipsaw occur when the price moves beyond a level but then returns to its previous levels. Whether you are trading binary options or CFDs, fakeouts are devastating. In binary options, after you place a trade, nothing can be adjusted. Therefore, you will just watch the price move in the opposite direction.
How Fakeouts Are Formed
It is very important to watch how fakeouts occur to understand how to avoid them. So, here is a step-by-step walkthrough telling the story of how fakeys form:
- Initial break. Everything starts like a normal breakout. The price pushes through a key level, often accompanied by a burst of volume.
- Fals confidence. The price moves slightly beyond the level, which makes traders think that the breakout is forming.
- Retracement. The price moves towards the broken level, which initially looks like a normal retest.
- Complete reversal. The price moves back through the level again, continuing in the opposite direction.
- Stop loss cascade. When the price moves back, stop losses are triggered for major market participants and the opposite movement accelerates.
Why Fakeouts Occur
Institutional traders and major financial market participants often push prices beyond levels simply to trigger stop losses from retail traders. These stops provide liquidity for larger players to enter positions at better prices.
Another reason for a fakey to occur is economic announcements or unexpected news. This adds volatility and liquidity, and the price may change its direction even after a breakout that looks very clear.
Liquidity gaps can also lead to fakeouts, with a relatively small order that can push the price through a level, creating a fakeout.
Critical Difference between Breakouts and Fakeouts
To make it clearer, we have prepared a special table that reveals the key difference between breakouts and fakeouts.
| Characteristic | Breakout | Fakeout |
| Volume | Significantly increases and remains elevated | Spikes initially then returns to its normal levels |
| Price Action | Clean break with distance beyond the level | Wicks through the level or barely exceeds it |
| Duration | Sustains movement in breakout direction | Reverses within a short time (often minutes to hours) |
| Momentum Indicators | Support the directional move | Show divergence or weakening momentum |
| Market Context | Occurs with favorable overall market conditions | Often appears during sideways or low-volatility markets |
| Retest Behavior | Holds above previous resistance (new support) | Breaks back through the level quickly |
| Volume Profile | Volume increases on breakout bars | Volume decreases on follow-through |
| Broader Market | Aligned with sector/sister assets | Divergent from broader market behavior |
| Probability of Success | 65-80% continuation | 20-35% continuation |
| Optimal Trade Strategy | Momentum continuation with longer expiry | Reversal trades with shorter expiry |
The Decision-Making Example
Before trading a potential breakout, traders should consider some questions.
- Is the broader trend aligned? A breakout has higher probability when it aligns with a broader trend.
- What does the volume show? Traders should watch for volume not only at the moment of a breakout itself.
- Are there conflicting signals? Check what your indicators say. If RSI moves above 70 during the upside breakout but later the indicator moves down, then it is better to avoid trading such a breakout.
- What is the distance of the break? If the price moved about 1-2% beyond the level, then the chances of a breakout increase.
- What’s the timing? Those breakouts that appear in the first hours of sessions are more reliable.
Retests in Binary Options Trading
One of the ways to differentiate between breakouts and fakeouts is to wait for a retest. Traders often wait for them to join the next leg of the trend after a breakout. When you trade an upside breakout, the price often goes back to this level for a retest. If the price bounces and resumes the upside, then you can buy a Higher contract.
For a fakeout, if the price moves below the level and continues to decline, then you can buy a Lower contract. In binary options, you can use this principle by waiting for a breakout to occur and place a trade right at the moment when you see a clear bounce.
Trading Strategies for Breakouts and Fakeouts
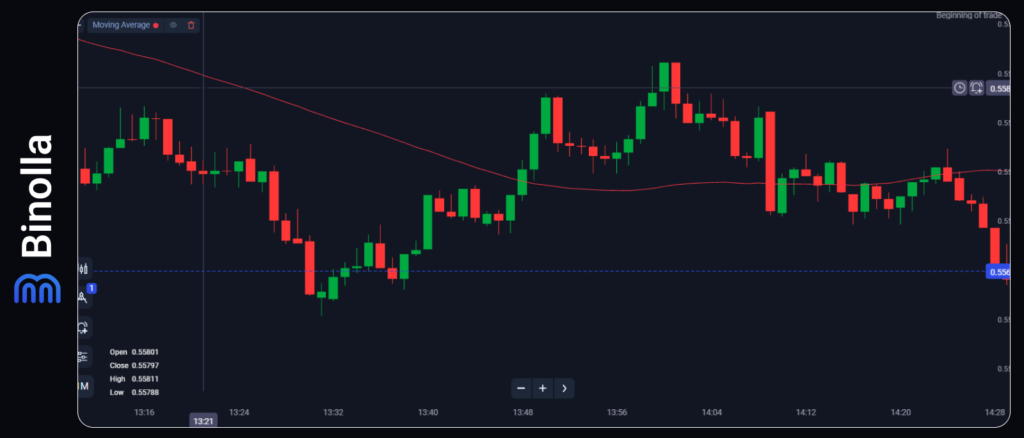
Now let’s look closer at how to trade the breakout. In this first example, you can see that the price breaks above the SMA50, which is a dynamic resistance line. In this specific case, you need to wait for the breakout candle to close. Then you can buy a Higher contract. As you can see, the price continues to move further.
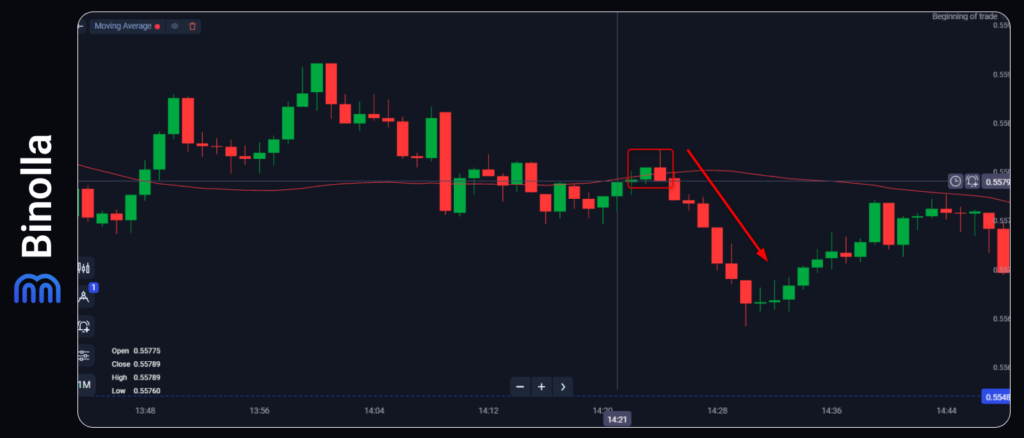
The next strategy is trading fakeouts. Yes, along with breakouts, you can trade fakeys. In this specific case, you just wait for the second candle to close. As you can see, there is a tail at the top, which means that sellers take control. The price moves lower later. Buy a Lower contract when the candle closes below the SMA50.
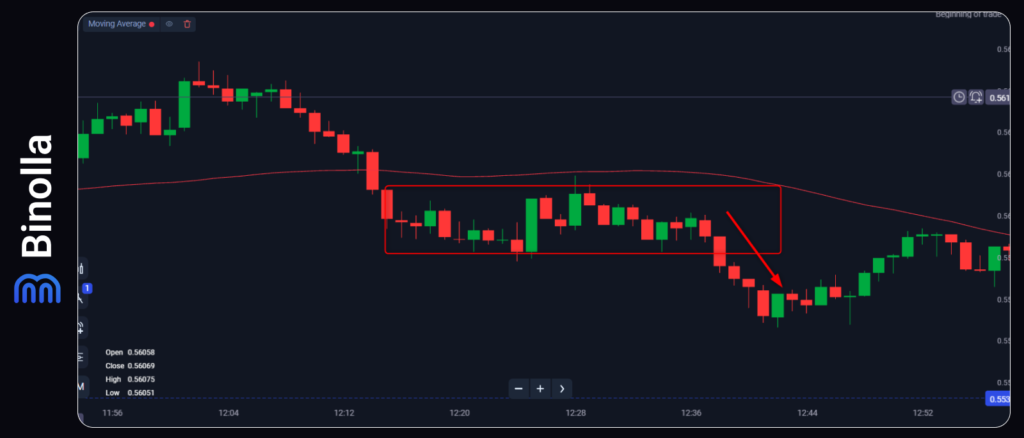
Another strategy is to trade with the price breaking below the support level or above the resistance level during ranges. In this particular example, you can see that the price moves below the support. This is a classic range breakout strategy where you buy a Lower contract right after the breakout candle closes.
Risk Management for Breakout and Fakeout Trading
Traders should never forget about risk management, whatever strategy they use. Here are some important rules that you should follow when trading with this approach:
- Position sizing. Never forget to define how much you are ready to risk per trade before you buy a binary option contract. Classic rules say that you should not risk more than 1-2%. In general, we do not suggest trading with more than 10% of your total balance. This will help you stay in trading for longer and make money consistently.
- Trade division. Instead of entering with a full position size, divide the amount and place a couple of trades. The first one right after a breakout and the next trades after a retest.
- Expiry selection. When trading breakouts, you should understand that the momentum is short. Therefore, it is better to use shorter expiries like 1 minute or 5 minutes.
Conclusion
Mastering the difference between breakouts and fakeouts is important as this allows you to better read the current market situation and place trades with higher winning chances. Moreover, this will give you even more trading opportunities as avoiding fakeouts does not mean you can’t use them as trading signals. By waiting for retests, checking volume, and looking for confirmation, you have better chances to make this distinction between the two and, thus, you can expect a higher profitability level.
FAQ
How can I determine if a breakout is genuine before it happens?
First, you should look for accumulation volume. Also, you can look at Bollinger Bands, with lines tightening, which suggests a genuine breakout. Avoid those breakouts that form at the first touch of a level.
Are certain assets more prone to fakeouts than others?
Yes, assets with lower liquidity are more prone to breakouts, as even small volumes can cause strong price movements. For instance, if you trade some exotic currency pairs like USD/MEX, you can expect more breakouts than when you trade EUR/USD.
What timeframes are best for trading breakouts in binary options?
There is no single best timeframe for trading breakouts. Everything depends on your strategy. For instance, if you are using short-term strategies, then your best timeframe will be 1 minute.
How to handle news events when trading breakouts?
Some news and market data releases can cause significant one-sided price movements. So first, you need to let the market digest, then trade the second move, which is wiser and more consistent.
What indicators are most helpful for distinguishing breakouts from fakeouts?
Traders often use RSI, Bollinger Bands, and ATR to find breakouts and fakeouts. ATR helps identify the average range, while with RSI you can find hidden and standard divergences.
Can I profitably trade both breakouts and fakeouts?
Yes, you don’t need to skip fakeouts and trade breakouts only. This will give you even more trading opportunities as both are frequent in the financial markets.
What’s the single most common mistake traders make with breakouts and fakeouts?
Traders often enter immediately on the break without waiting for a retest. The initial movement is the most dangerous moment to press the button. Patience for the retest and signal confirmation may improve the profitability rate.