The Moving Average Indicator: Basic Information, Strategies, Recommendations

The moving average is a common technical indicator that is used by millions of traders worldwide in many forms. Some of them apply pure moving averages in their tactics, while others use variations of this indicator in other technical tools that include Envelopes, Bollinger Bands, Ichimoku Cloud, and many more. You can use all of them if you start trading with Binolla.
MA, which is short for moving average, allows you to build a lot of strategies of different types. Depending on your current trading goals, you can simply define market trends or go further and find entry points. Moreover, you can apply it separately or combine it with other technical analysis tools. By reading this article, you will learn more about MA and its features.
Contents
- 1 What is a Moving Average?
- 2 Types of Moving Averages
- 3 How to Set a Period of a Moving Average
- 4 What Periods to Set When Using a Moving Average
- 5 Give Moving Averages a try!
- 6 How to Apply a Moving Average on the Binolla Platform
- 7 What Are Moving Averages Normally Used For?
- 8 MA Basic Strategies
- 9 The Pros and Cons of Using Moving Averages in Trading
- 10 Conclusion
- 11 FAQ
What is a Moving Average?
Simply put, a moving average is a line that averages prices for a particular period. For instance, if you take 14 periods, you will see the line that is calculated for the 14 previous candlesticks or the past 14 days if you are using any other type of chart.
Types of Moving Averages
Most traders use a simple moving average, as it provides you with a lot of useful information about the price and the current situation on charts. However, there are some other types of MA that you may want to try in your strategies. Find detailed explanations of the most popular variations below.
Simple Moving Average or SMA
This type of moving average trading indicator is based on simple calculations (as it comes from its name). The idea is to take a particular period and calculate the average. The formula for this indicator is the following:
MA = Prices for the Number of Periods/Total Number of Periods
The calculations are done with each new candlestick. Therefore, the line changes after each new candlestick closes.
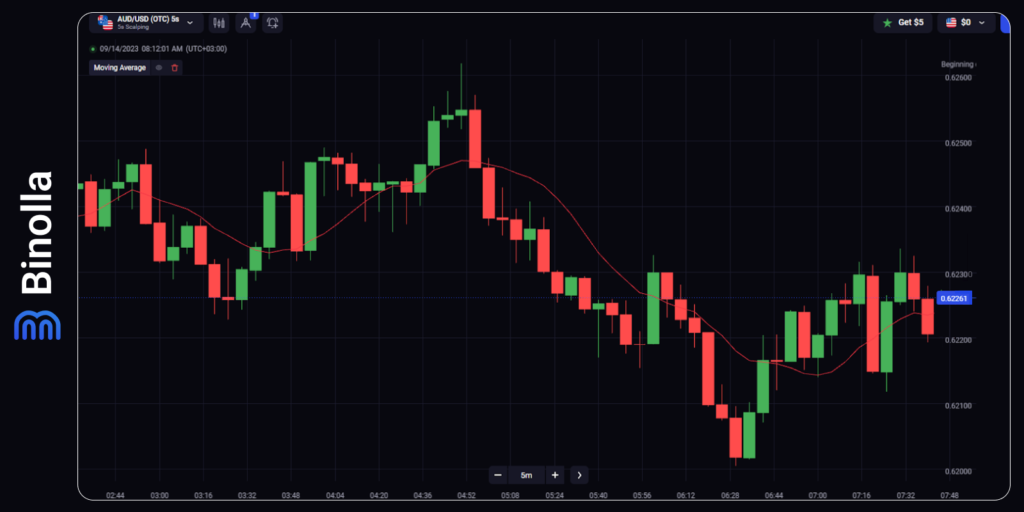
The example above shows what a simple moving average looks like. As you can see, the line goes below and above the price, allowing you to see trends.
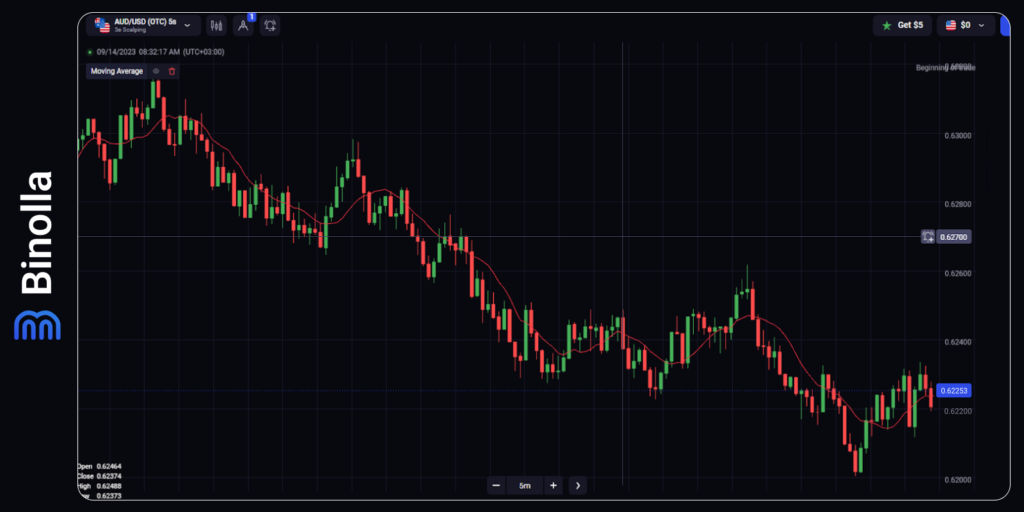
Weighted Moving Average or WMA
In this type of moving average, the weight is attributable to each particular point in the calculations. For instance, if the weighted moving average contains ten entries of data, then the closest element will be multiplied by ten, the ninth by nine, the eighth by eight, and so on. Later on, the sum will be calculated and divided by n(n+1)/2
Exponential Moving Average or EMA
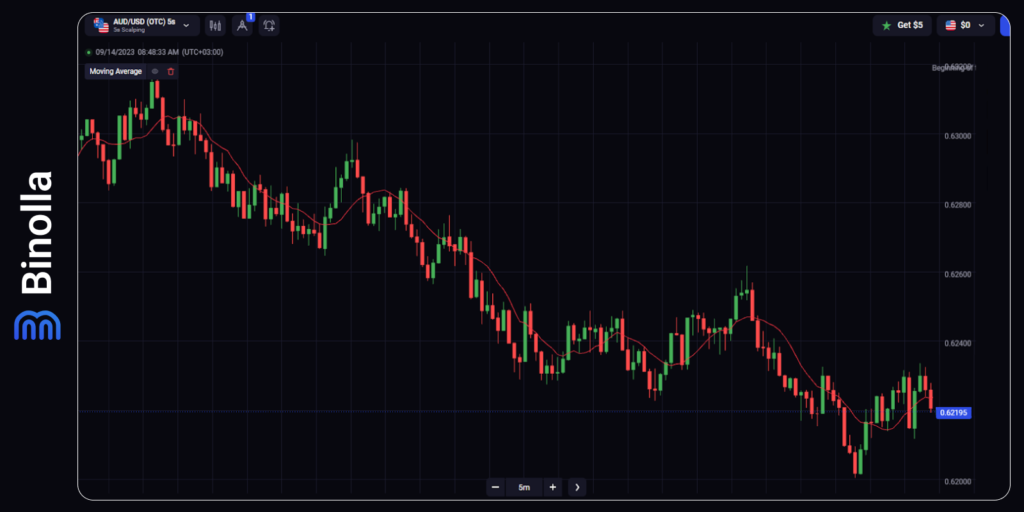
This type of moving average is of particular use when the price spikes. Exponential moving averages give more weight to recent prices. Therefore, they have some advantages over SMAs as they allow you to take a look at recent performance.
To calculate an exponential moving average, you need to use the following formula:
EMA = ((Closing price – EMA of the previous period)*multiplier) + EMA of the previous period.
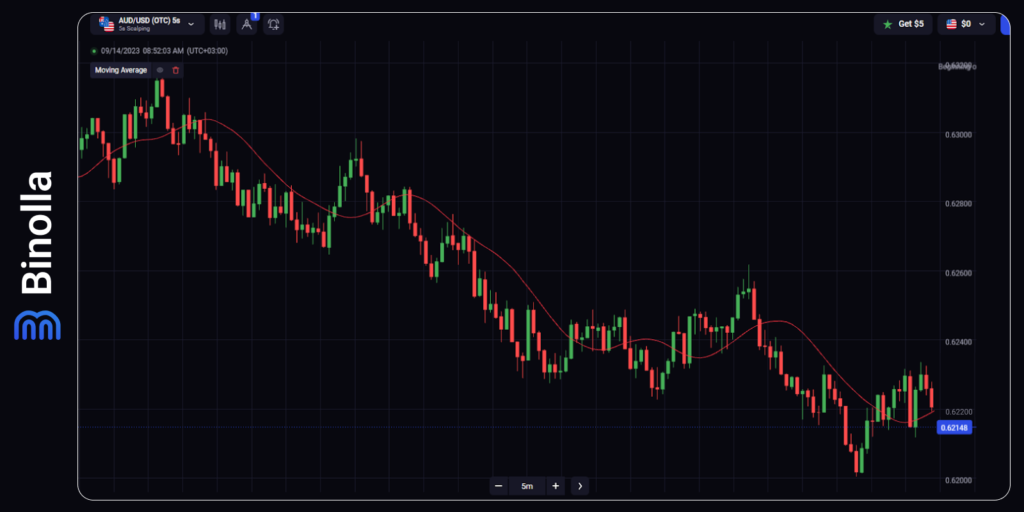
Triangular Moving Average or TMA
The data in this type of moving average is smoothed twice. To calculate TMA, you need to calculate SMA first, and then you simply calculate the average of SMAs for a particular period.
How to Set a Period of a Moving Average
One of the most important questions that many traders ask themselves before even applying a moving average is what period to set.
What Periods to Set When Using a Moving Average
Once you apply a moving average to your chart, you will face a dilemma about which period to set. Before you even change the numbers, you should understand how it works. A period is the number of candlesticks that will be included in calculations. Therefore, if you set a greater number, you will add more candlesticks to the calculations, while if you set a lower period, fewer candlesticks will be involved.
Setting a period has a direct impact on what you will see on charts. If you increase the number of candlesticks, you will see that a moving average becomes smoother. It ignores some price fluctuations and reversals, but it makes the general picture of the trend clearer.
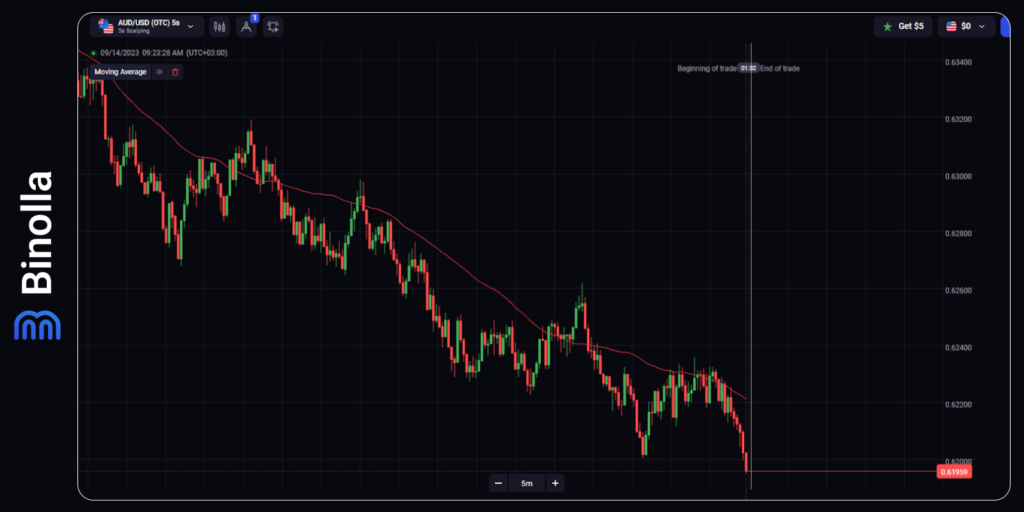
The picture above shows what a 50-period SMA looks like. As you can see, there are several upside corrections during the uptrend, but the line is almost straight with a minor reaction to those price changes.
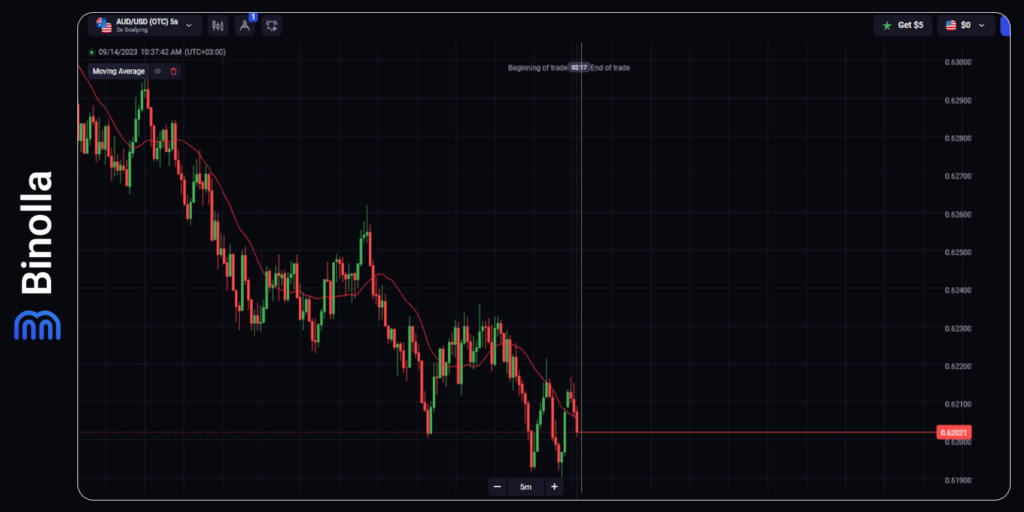
When you take a closer look at SMA 20, you will see that it is more “flexible” and repeats the contours of the price movement. However, when using this type of moving average, you still have an idea of the price movement direction.
How to Choose an MA Period?
Now that you have seen a couple of examples of a moving average with different periods, we are going to provide you with some recommendations on how to choose the right one for your particular strategy. Here are some hints that you can look through when setting a period:
Think about your trading style. When choosing the right moving average period, you should consider your trading style. If you are going to open long-term positions, it is better to set periods from 50 to 200. This will allow you to have a general picture of a trend if you are going to hold an asset for months. However, when trading digital options or using intraday strategies, you can set periods from 5 to 20;
Volatility is another important aspect to consider when choosing an MA period. If you are trading those assets with high volatility, you may be interested in setting a lower period, as you may want to see all those curbs and slopes on the chart and trade them. When it comes to less volatile assets, it is recommended to pick higher periods to have an opportunity to define long-term trends;
When choosing a period, you also take a look at historical data and watch how a moving average performs over time with different periods. This will help you adjust the number of candlesticks that are included in the calculations;
Combine MAs with different periods. Some strategies may require additional moving averages with different periods;
Consider risks. While shorter moving average generate more entry points and signals, they also provide a lot of false ones. On the other hand, with longer moving averages, you will have fewer signals, but they will be more reliable.
Now that you have learned some recommendations on how to pick a period, let’s have a look at some ideas for using MAs with different lengths:
10 and 20-period moving averages are normally used to demonstrate dynamic support and resistance levels for short-term strong price movements;
50-period moving averages are great for providing information about mid-term trends. Moreover, they do not react to small pullbacks, which allow mid-term traders to hold their positions for longer;
100-period moving averages are normally used for long-term trends. They ignore short-term pullbacks allowing traders to focus on major price movements;
200-period MAs also highlight long-term trends that encompass almost a trading year (which is about 250 days).
Digital options traders normally use MAs with 10 or 20-period lengths, while FX and stock traders can apply any period depending on their trading styles.
How to Apply a Moving Average on the Binolla Platform
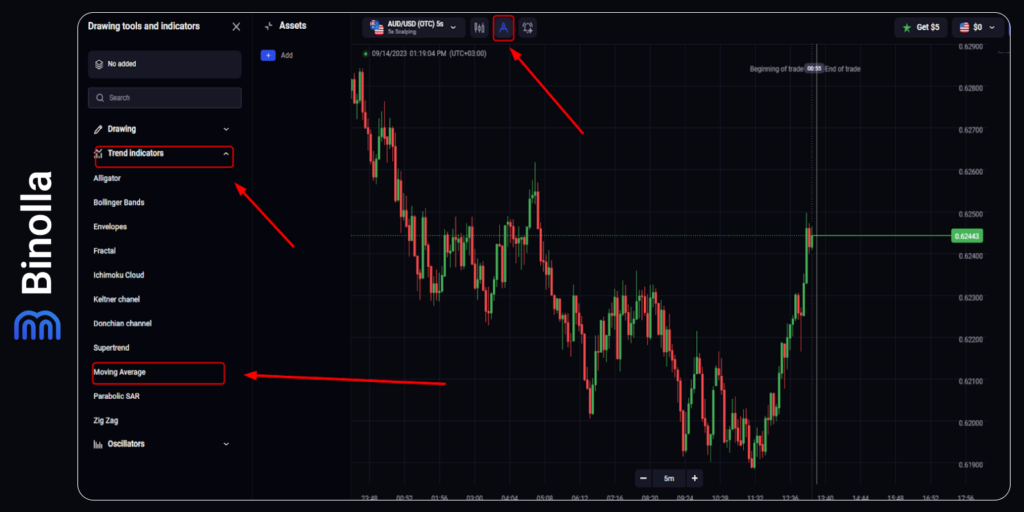
Binolla allows you to use one or several moving averages of different periods. You can easily apply it to charts by completing the following steps:
Go to the platform and click on the Tools icon at the top of the screen.
Move the cursor to the left part of the screen and choose Trend Indicators there.
In the drop-down menu, pick Moving Average.
Once you finalize the last step, the indicator will appear on the chart.
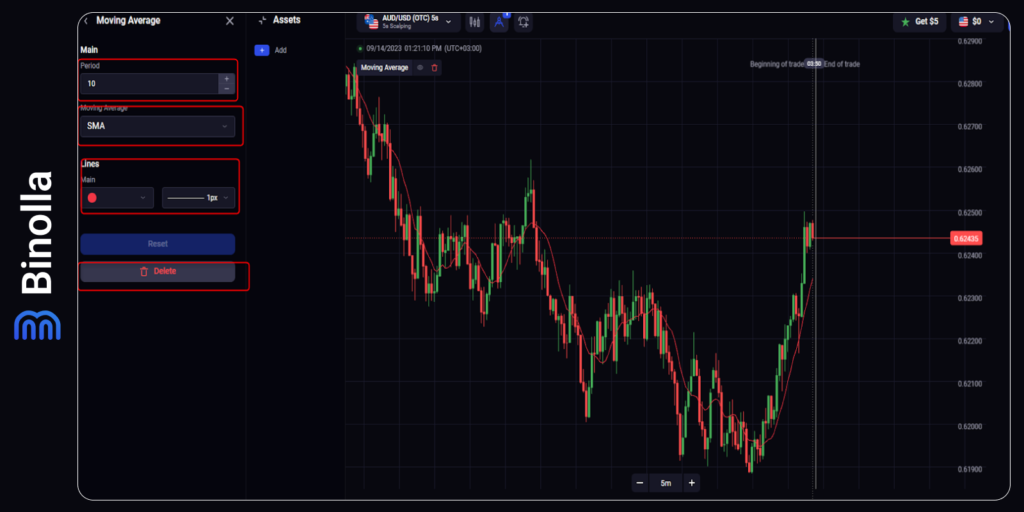
Now that you have applied the indicator, you can set some important features. In particular, you can change the period, and type of moving average, and set the color and thickness of the line. If you don’t need a moving average anymore, you can delete it from the chart.
What Are Moving Averages Normally Used For?
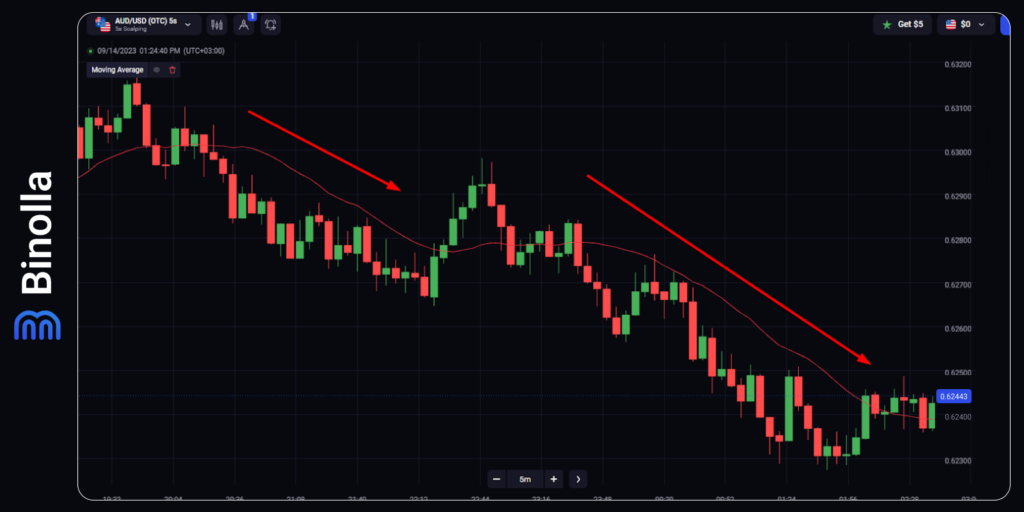
There are two main features of this indicator that traders should know before applying it. First, a moving average allows traders to define the current market price direction. When the price fluctuates below a moving average and the latter goes downward, you can say that there is a downtrend. However, if the price is above a moving average and the line goes upwards, the uptrend is developing.
Another feature of using this indicator is that it plays the role of dynamic support/resistance and trendline. With this feature, traders can identify entry points or think about when to exit from the market if the price changes direction.
MA Basic Strategies
Moving averages can be applied to various strategies, and their number is limited by your fantasy and imagination. However, there are some basic ones that you can learn and start applying after you read this article. The first one is known as a crossover.
MA Crossover Strategy
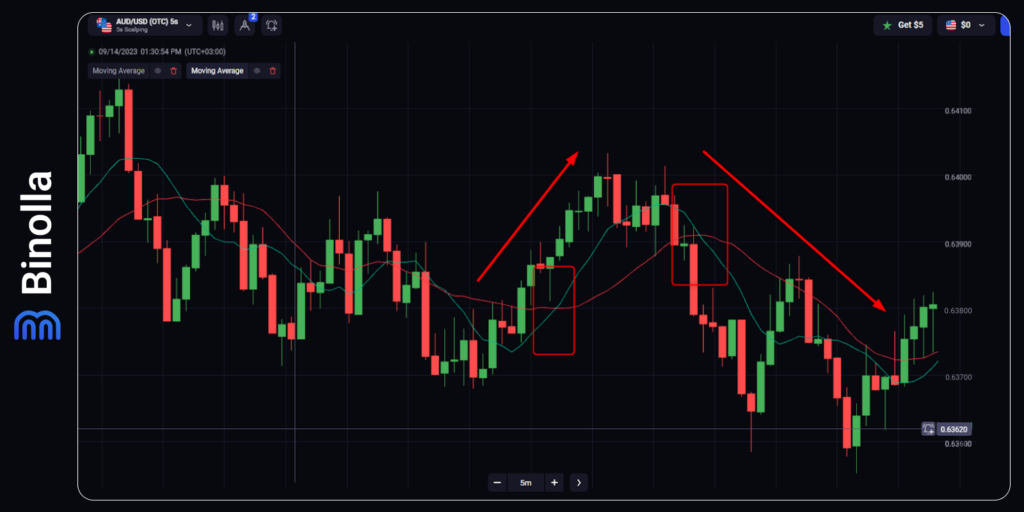
This type of strategy can be used by all types of traders, regardless of what trading asset they use. It is suitable for digital options, forex, stocks, cryptocurrencies, metals, etc. The idea is to apply two moving averages with different periods (we have set 10 and 20 periods in our example).
Once the crossover happens below the price and both lines head north (towards the upper part of the screen), then you can buy a Higher digital option or simply buy an asset. If the crossover takes place above the price and both lines bend downward, you can buy a Lower contract in digital options or sell an asset.
Ribbon Strategy
This is a more complex strategy where you need to apply several moving averages to charts. They should be of different periods and colors so that you can identify the potential entry points.
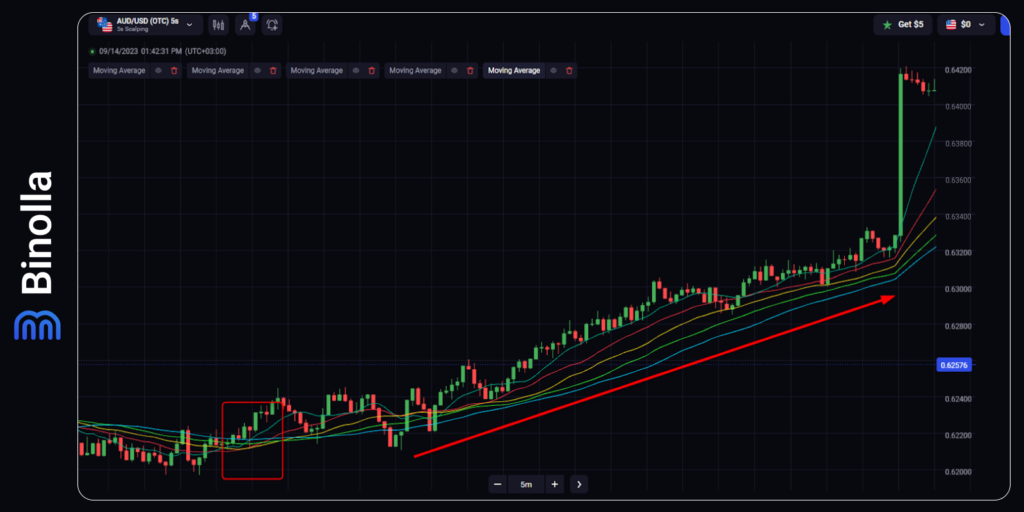
The image above shows how to trade with these tactics. There are five moving averages with periods ranging from 10 to 50. Once they intercross with each other and start heading north with equal space between them and in a particular order (from short to long ones), the upper trend is developing, and you can buy and hold an asset for some time (until those MAs intercross with each other again).
On the other hand, after such an intercross of all MAs when they are above the price and head south, you can sell an asset and hold it until the MAs meet each other again.
Keep in mind that this strategy is not suitable for digital options as it gives no clear entry points.
The Pros and Cons of Using Moving Averages in Trading
Moving averages have a lot of advantages, as this is a universal indicator with a lot of features. Moreover, you can create a lot of strategies by applying them to charts and even more by combining them with other indicators or charts. However, knowing the advantages and disadvantages of this indicator is crucial. Here are the pros of using moving averages in your trading routine:
- You can easily define market trends and find support/resistance, as well as trendlines, without additional effort or skills. You don’t need to draw anything on charts. Simply add a moving average and set a period;
- Moving averages allow you to build a variety of strategies that you can use without adding any additional technical analysis tools;
- The indicator is responsive to all new changes, which means that you don’t need to adjust it.
As for disadvantages, they are the following:
- Moving averages are almost useless in sideways markets. Moreover, they will provide you with a lot of fake signals when the price swings back and forth. When this happens, the best solution is to ignore moving averages and add other indicators;
- Moving averages are a lagging indicator. This means that it follows the price, and you can’t take advantage of trend changes. If you are looking for reversals, it is better to use momentum indicators.
Conclusion
Moving averages are a famous technical indicator that traders have used for decades. It allows you to highlight current market trends and even act as a support or resistance line without drawing them on charts.
The indicator is very popular among traders and many other technical analysis tools are based or use the moving average formula to provide traders with useful information. For instance, if you consider Bollinger Bands or Envelopes, you will see that both are based on the moving average concept.
FAQ

What Does a Moving Average Tell You?
The indicator can tell you about the current price movement direction. Moreover, by applying it to charts, you can clearly see the support and resistance lines that change over time when new data comes into play.
How Do I Calculate a Moving Average?
The indicator is calculated with various formulas, but you don’t need them in your trading practice as everything is done automatically. The only thing that is required from traders is to set periods.
What is the Difference Between a 10 and 100 Moving Averages?
The difference between them is in the number of candlesticks that are considered when the indicator is calculated. A 10-period MA includes only 10 candlesticks, while a 100-period MA comprises 100 candlesticks.
Is the Moving Average a Good Indicator?
Yes, it is. It smoothes price fluctuations, allowing you to see a clear picture of the price movement direction.

