The Fractal Indicator by Bill Williams: Basics, How to Trade

Technical market research has a lot of faces, and one of them is the Fractal indicator by Bill Williams. This tool is used to identify potential market reversals. While technical analysis is based on calculations, fractals are nothing more than a reflection of a candlestick pattern.
The name of the indicator was taken from math, where fractals mean recurring patterns. According to Bill Williams, the indicator is designed to find such “recurring patterns” in the total chaos of price fluctuations. Thus, you don’t need to do anything on your own, as the indicator draws fractals automatically. You can simply use signals and trade. This article will provide you with useful information about the indicator itself and how to use it in your trading routine. To start using this indicator and trade with Binolla, you need to create an account on the platform first.
Fractals Basics: What Are They Look Like
While the indicator draws arrows above fractals automatically, we recommend reading the lines below in order to understand what they look like. First, we are going to take a glance at a bearish fractal.
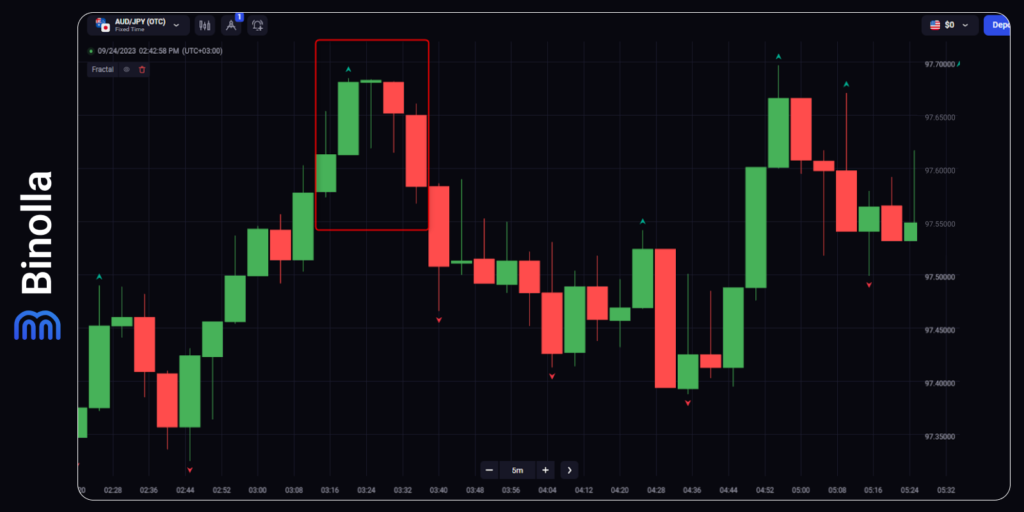
This pattern includes five candlesticks, three bullish and two bearish. When considering bearish fractals, you should keep in mind that the time required for the pattern to be completed varies depending on the timeframe. For instance, if you trade on the hourly timeframe, it will take about five hours for the pattern to appear. Traders using daily timeframes will have to wait for about five days.
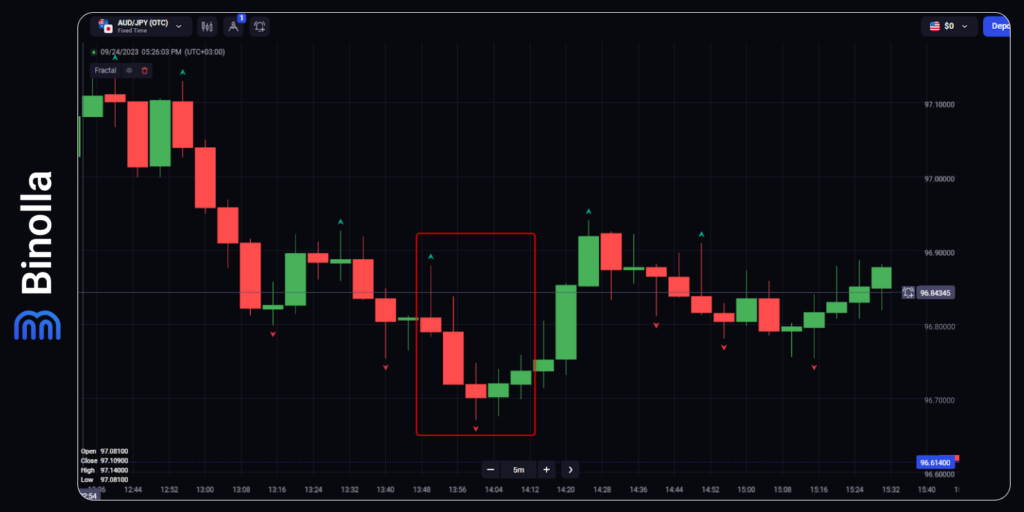
When it comes to bullish fractals, it comprises five candlesticks, but this time, you will see three bearish and two bullish units. It is formed at the bottom of the market (the local one) and predicts a possible market reversal. To be more clear, both patterns resemble V shapes, and they are reversal.
How to Apply Fractals on Charts with Binolla
The Binolla platform allows you to use fractals in your trading strategies.
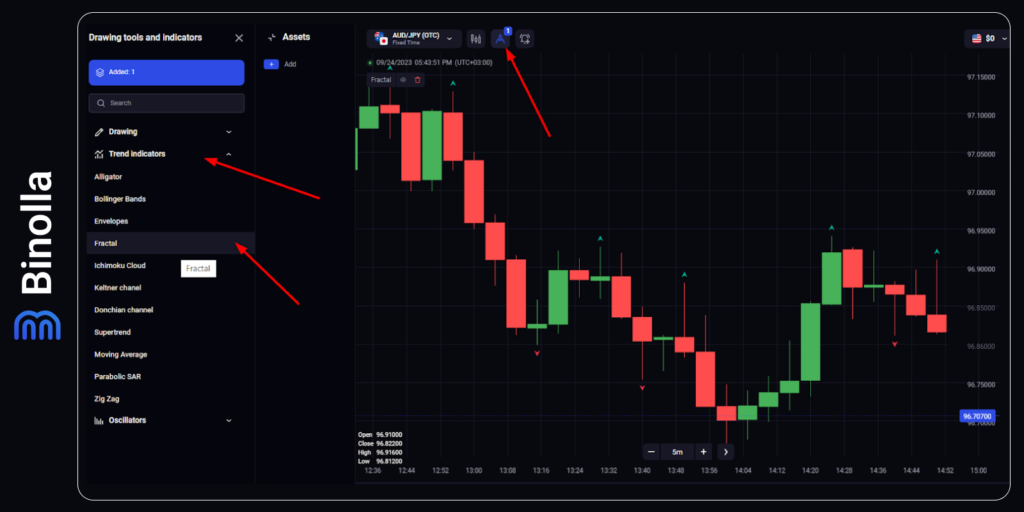
To start using the technical analysis tool, you need to complete the following steps:
- Go to the Binolla website and log in to your account to get access to the platform.
- Click on the Tools icon at the top of the page.
- Choose Trend Indicators.
- Pick Fractals.
The indicator will appear on the charts right away. As for settings, you don’t need to change anything. However, you have the option to choose the color of the arrows. They are set to green and red by default.
Trading Digital Options with the Fractals Indicator
Trading with the Fractals indicator may be straightforward or sometimes confusing. This depends on the strategy that you apply. If you are actively using digital options contracts, you will be able to find a very simple system that allows you to buy Higher contracts after bullish and Lower bearish fractals.
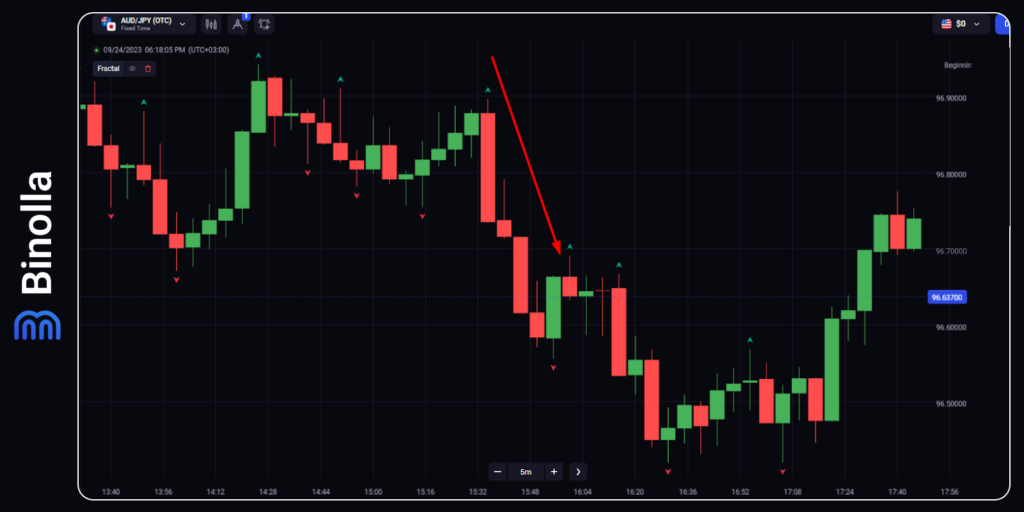
Here is one example of how to use fractals in your digital options trading journey. Once it appears, you can buy a Lower contract. However, you should keep in mind that the green arrow above the red candlestick appears only after it is closed. Therefore, you should keep in mind that in this particular example, you can purchase a Lower contract starting from the second bearish candlestick.
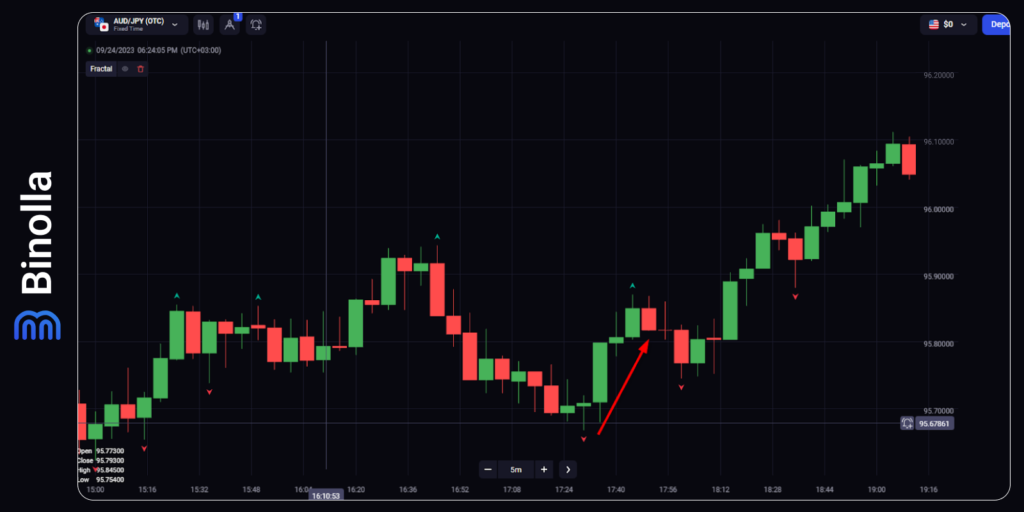
Another example of trading digital options with fractals is when a bullish one appears. In this case, you can buy a Higher contract on the second candlestick after the red arrow below the signal candlestick appears.
Pay attention to this formation. It is not a classic fractal, as the main rule of three bearish and two bullish candlesticks is broken. However, this is also a fractal, as we have a U-turn here.
Forex and Stocks Trading Strategies with Fractals
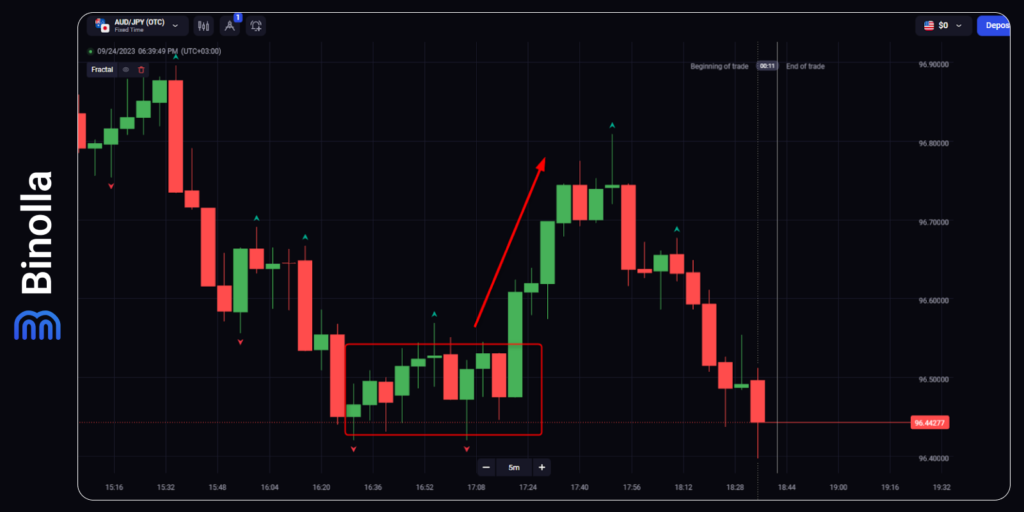
When you are trading stocks or Forex CFDs, you have a variety of strategies at your disposal, and some of them may seem strange at first glance, but later, when you read this part until the full stop, you will understand their meaning and even adore them.
First, we would like to show you a very simple one, where you use fractals only. Once a bearish one appears and if the price stays in a range, you can wait for a breakout and buy a stock or a currency pair. Sounds crazy? Not at all. Bearish fractals are not always about price reversals. This is a signal that the price can’t continue the uptrend for a while.
If you stay bullish and wait for a good opportunity, you will be able to find it a bit later. In our example, when the price makes a breakout of the fractal candlestick, you can buy a stock or a currency pair and collect a profit later.
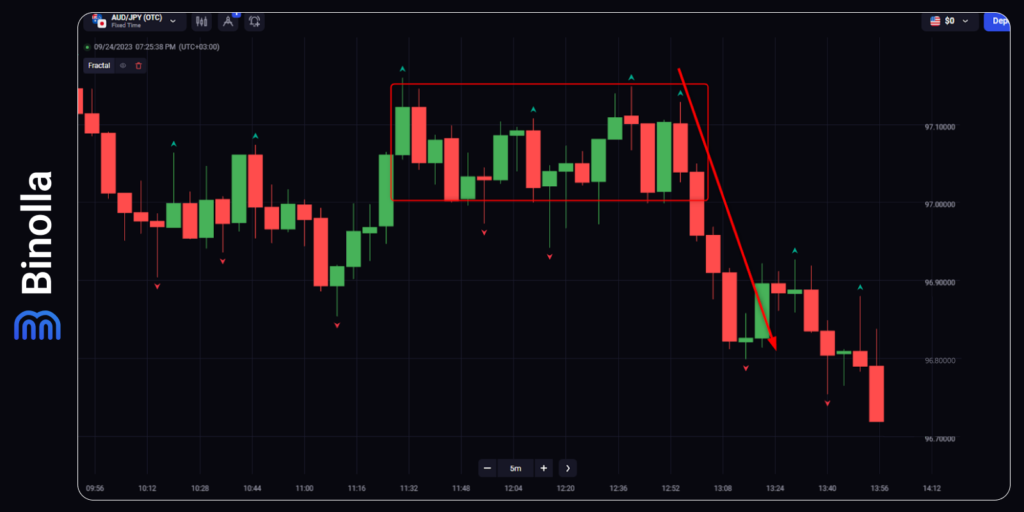
The opposite situation is when you have a bullish fractal, but the price remains in a range. You can wait for a breakout of a support line, which is the closing price of the bullish fractal candlestick, and sell a currency pair or a stock.
Again, you can see that the price movement is quite fast after the breakout and it covers several pips, which means that you can benefit from this situation.
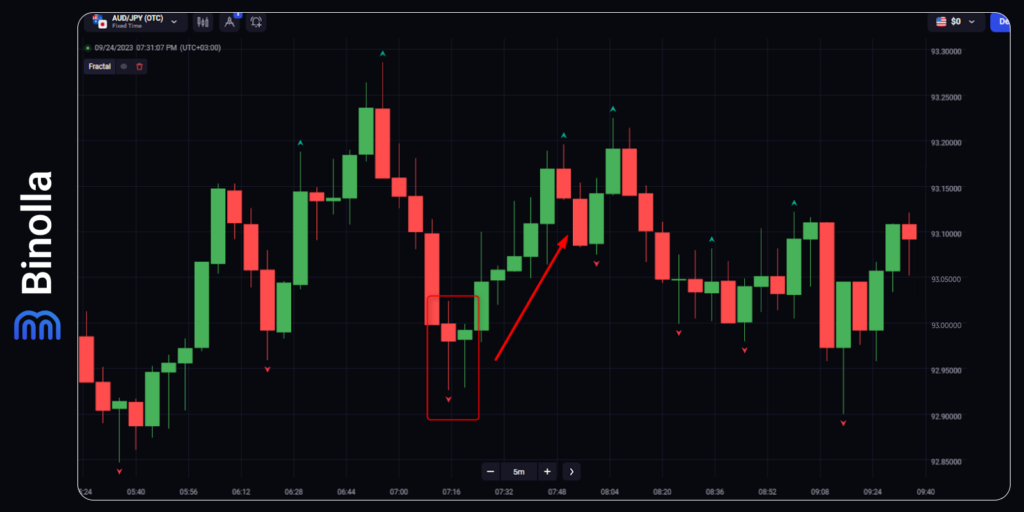
You can combine fractals with candlestick analysis and receive an almost jaw-breaking cocktail that allows you to trade with signals that go in confluence with each other. In our case, we have a bullish hammer, which is augmented with a bullish fractal, which means that you can buy a currency pair or a stock.
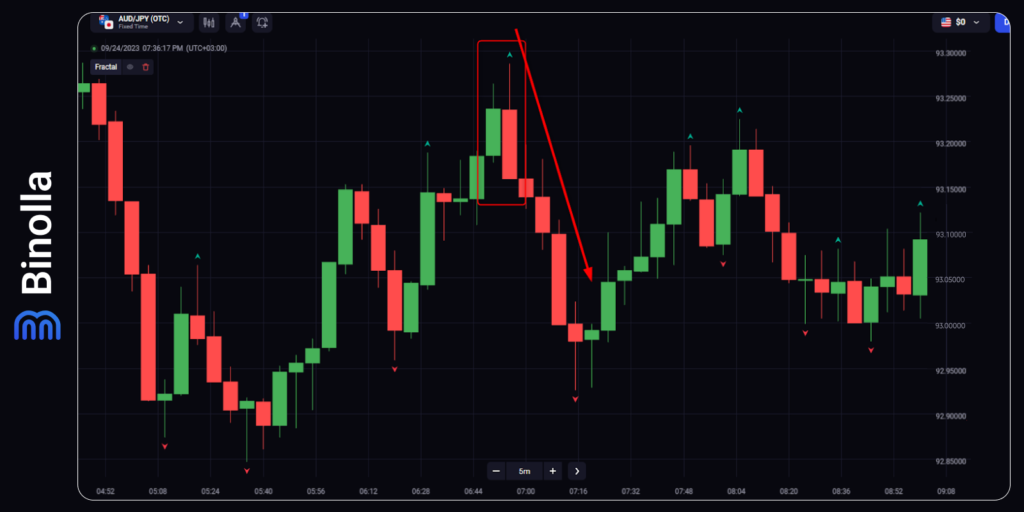
In our next example, we have another confluence of signals, which comes from fractals and bearish engulfing. Here is an opportunity for traders to sell a currency pair or a stock.
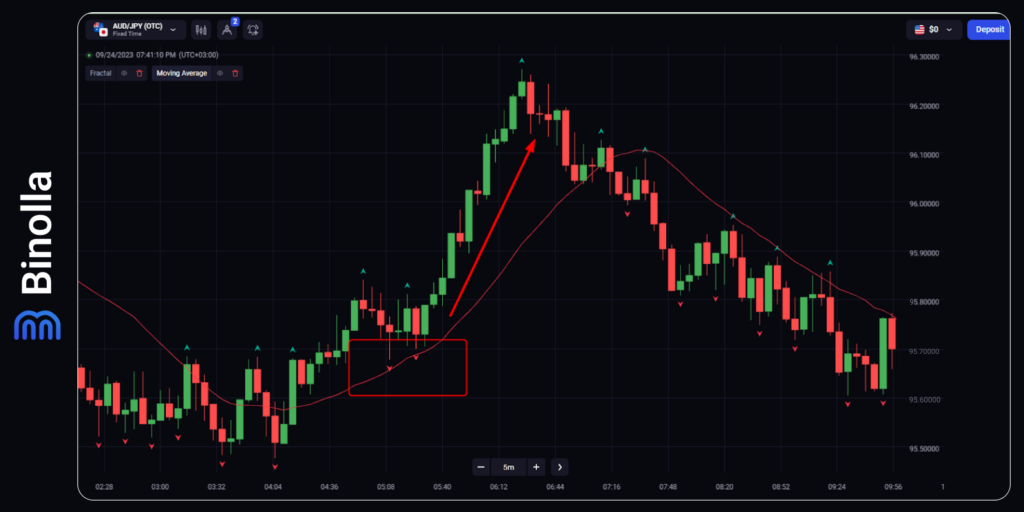
If you add a moving average to your charts, you can build a couple of basic strategies and even some sophisticated ones if you delve deeper. However, we are going to provide you with some crystal-clear systems that will allow you to start trading using fractals.
The idea behind this strategy is that the moving average acts as a dynamic support line. You can see a couple of bullish fractals that appear close to this line, which means that the bullish trend is confirmed. You can open traders with one of these fractals and hold your position until the opposite signal comes (a bearish fractal appears). Keep in mind that you can also hold your trades until the price makes a breakout of the moving average line.
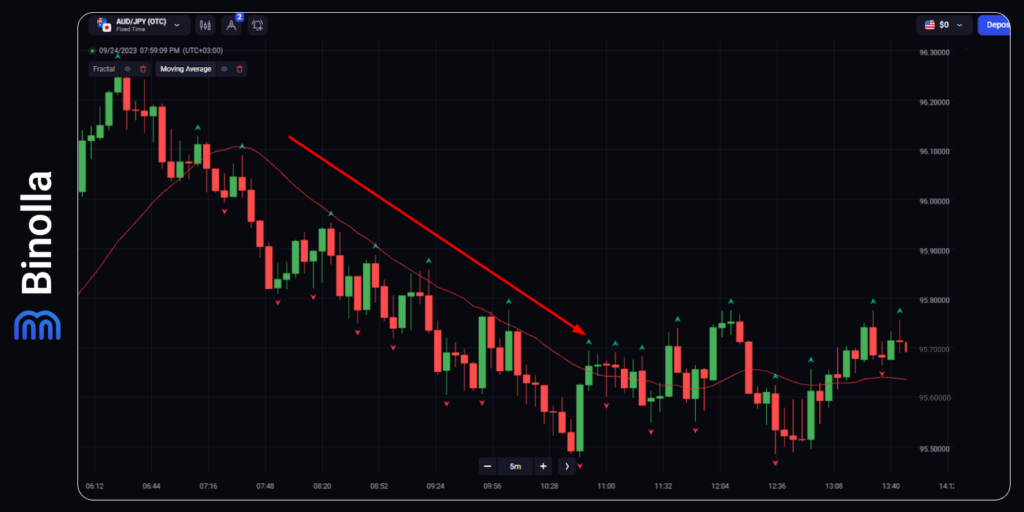
The same can be applied to downtrends when the price is below the moving average and bearish fractals appear from time to time. The idea here is to watch when bearish fractals confirm the downtrend while the price is below the moving average. You can see that bullish fractals appear as well. However, you can skip them until the price is below the moving average. Once it makes a breakout, you can close your trade.
Pros and Cons of Using Fractals in Trading
By applying the Fractals indicator to your charts, you will enjoy the following benefits:
- Easy to read. This indicator is very illustrative and easy to read, as there are only two types of signals: red and green arrows (you can change their colors according to your preferences);
- Work on every timeframe. Whatever trading style you practice or whatever instrument you trade, you can add Fractals strategies and use them;
- Shows both buy and sell signals. Like all other indicators, Fractals allows you to find both buy and sell signals;
- Can be used in combination with other indicators/systems. You can combine Fractals with trend-following, and momentum indicators, as well as use it together with candlestick analysis.
When it comes to drawbacks, they are the following:
- Lags. Fractals is a lagging indicator, which means that signals come with a delay that may negatively affect your strategy and trading results;
- Lack of accuracy on lower timeframes. While the indicator is designed for various timeframes, market noise, especially on small TFs, affects the results of Fractals calculations;
- Fractals work better in combinations. The best signals come from a combination of indicators or other analysis tools;
- Late entries. We have already mentioned the lagging nature of this technical indicator. This leads to traders making late decisions when the trend has already started.
Key Things to Consider When Trading with Fractals
Now that you know more about the indicator and its main features, here are some recommendations that you can follow in order to improve your results when you are using fractals:
- You should keep in mind that this is a lagging indicator. Therefore, it is better to use a combination of tools in order to succeed;
- Fractals generate many signals, both true and false. You should consider this when using a particular signal;
- When switching to higher timeframes, you can have fewer signals, but they will be more accurate;
- Whatever strategy you choose, go to higher timeframes to watch for long-term trends first.
Conclusion
Using fractals may be of great value if you find the right strategy. This indicator has a lot of benefits, but you should not forget about the drawbacks that may play tricks on you. Therefore, when using this technical analysis tool, all information should be double-checked.
You can find fractals on your own even without using this tool. However, the automatization of this process gives you some free time that you can spend working on your trading system or money management strategy.
FAQ

How Does the Fractal Indicator Work?
The algorithm behind this technical analysis tool finds fractals on the market and highlights them with green and red arrows. This facilitates your trading routine, allowing you to focus on other aspects.
What Indicator is the Best to Use with Fractals?
One of the best technical analysis tools to apply when you use fractals is the moving average. This allows you to have a clear picture of the current trend so that you can rely on this information when finding fractals on charts.
Is Fractals a Good Indicator?
Yes, it is. However, you should keep in mind that, like many other technical indicators, fractals have both their upsides and downsides. Keep them in mind when building a strong strategy.
Are Fractals Signals Reliable?
Some of them are reliable, while others may lead you down the wrong path. Therefore, you should learn how to sort them as well as apply your own money and risk management rules in order to succeed.
