Volatility Basics

There are plenty of things that traders should consider when they buy or sell various assets or use derivatives in their trading routine. Volatility is one of them, and it is even one of the most important criteria to look at when picking a currency pair or a stock to purchase or sell. By reading this article, you will learn more about volatility itself, liquidity, volatility trading, and implied volatility. To place your first trade, create an account at Binolla!
What is Volatility in Plain Words?
Volatility is the price fluctuation. To measure this parameter, you can simply compare the difference between the opening and closing price of a particular asset for a set interval. Volatility measurement is of particular importance when you decide which asset to buy and what strategy to use. Professional traders and investors always compare the volatility of different classes of assets before coming to a conclusion about which one to prefer and which to add to their portfolios.
Volatility can be different even within a certain class of assets. For instance, if you take Forex, you can see that one pair can make 20-30 pips per day, while the other one can make 50-100 pips. They call the latter a high-volatility asset, while the first currency pair is known as a low-volatility asset.
If you look closely at the currency market, you will see that some of them are less volatile and are known as safe havens, like the USD, the Japanese yen, and the Swiss franc. This doesn’t mean that they can’t be more volatile at a certain point. However, those currencies are “calmer” on average.
Some exotic currencies from emerging markets like the Mexican peso, Turkish lira, or Thai Baht, on the other hand, are more volatile as compared to those like USD, CHF, or JPY. Volatility can’t be measured as good or bad. Everything depends on your strategy, the risks that you can take, and your trading style.
What is Liquidity in Plain Words?
Liquidity stands for how quickly and easily you can sell or buy a particular asset. If you buy EUR/USD, for instance, you can expect that you will easily sell it in the future, and your order will be executed in a matter of milliseconds.
On the other hand, buying DeFi cryptocurrencies may cause you some problems over time as you may find no buyer at all. The same is true for pink sheets or penny stocks, which are mostly traded over the counter. These shares are very hard to sell unless those companies become so popular among investors that the stocks reach huge exchanges like the NYSE, NASDAQ, and others. In this case, the stock becomes liquid, and you can sell it quickly and easily as the interest on it is significantly higher.
There is one more thing that should be considered about liquidity. Non-liquid assets make it easier to move the price. In some cases, you can buy a huge share of the total market supply and move the price of the asset with little investment. However, keep in mind that until the asset becomes popular, your sell order may bring the price down to where it belonged before your interest in the financial instrument.
The Interconnection Between Volatility and Liquidity
Both liquidity and volatility are very important, as they are connected to each other. For instance, if you are trading EUR/USD, you can expect lower volatility as the currency pair is liquid. On the other hand, when trading the Turkish lira, for instance, you can expect higher volatility as this currency pair is less liquid as compared to EUR/USD.
The same is referred to as pink sheets or penny stocks. They are less liquid, which means that you can expect higher volatility, especially when someone shows interest in them. However, this doesn’t mean that those penny stocks are highly volatile all the time. Sometimes, you will find them completely calm, as when there is no interest in those stocks, the price will stay still.
Volatility in Digital Options
Fixed-time contract traders can also benefit from volatility. While their profits indirectly depend on volatility, they still pay much attention to it, as it is better to buy contracts in trending markets with wide price fluctuations than to try to trade in a narrow market.
Fixed-time contract traders are not afraid of any type of volatility. Whatever class of asset they choose, be it FX currencies, cryptocurrencies, stocks, or others, their payouts are fixed, as are their risks. Therefore, even if an asset makes hundreds of pips per hour, you can only make up to 95% or lose less than 100% of your investment, depending on the results of a trade.
Volatility Importance: Why Do Traders Look at It?
The importance of volatility is hard to overestimate. While you may not need to find entry points, you still should look at and try to forecast volatility to understand your current trading goals. There is a very simple example that shows you how you can use volatility in your trading routine.
Imagine that you are going to buy EUR/USD. The average volatility for this currency pair in the past twenty days was about 50 pips (imaginary). EUR/USD has already made 40 pips during the day, which means that you can expect only a 10 pips movement, which may be very few for you to make expected profits.
That’s how it works. If you see no volatility or very low volatility, you may think about skipping the whole trading day, while in times of true thunderstorms in the financial markets, you would also prefer to find shelter or “sit on the bench,” as they say, in order to avoid heavy losses.
Market Volatility: Main Drivers

The main factors that may affect volatility include:
- Geopolitical factors and fundamentals. These are the alphas and omegas of all market movements. Depending on the importance of the events that happen around or even on the other side of the planet, as well as the data releases, the volatility may change from very low to huge in a matter of seconds. Markets always have a very fast reaction to what happens in the world. This first reaction may be irrational from the fundamental analysis point of view, but it still exists and you need to learn how to deal with it;
- Companies data. Earnings are the most important sets of data that can have a massive impact on stock quotes. Especially in times of high divergence between the forecast and the release readings. Therefore, if the difference between those figures is huge, you can expect a rise in volatility;
- Trade wars. When it comes to currencies, trade wars may cause a significant increase in volatility as they affect billions, if not trillions, of transactions all over the world;
- Central banks’ decisions. When a central bank hikes or cuts interest rates, especially when those decisions were unexpected by markets, it may cause a significant volatility surge;
- Market sentiment. All movements that you can see on charts have traders and investors behind them. Market sentiment is very important for volatility, and depending on market moods or sentiments, market volatility will change.
Implied Volatility Basics
This type of volatility refers to a special metric that evaluates the likelihood of changes in price for a given asset. With IV, traders and investors often try to predict future price fluctuations as well as shifts in supply and demand. You should keep in mind that IV is not the same as the historical volatility that we have discussed in the previous part of this article.
Implied volatility is mostly used to predict the likelihood of a price movement. With this parameter, traders and investors can estimate future price fluctuations that rely on set predictive metrics. IV is presented as a percentage and standard deviation over a set time interval.
Keep in mind that implied volatility does not predict the direction of price movement. If you look at any chart, you can see that it is impossible to forecast price movement solely using volatility percentages. However, the one thing that is clear is that by using IV, you can say whether the price is going to make huge movements or whether unexpected price changes are unlikely to happen.
Advantages and Disadvantages of Using Implied Volatility
This type of volatility helps quantify market sentiment. With this tool, you can predict the size of the possible price movement. This approach has both advantages and disadvantages, which are described below:
Pros:
- IV helps quantify market sentiment;
- Implied volatility is useful for traders to choose a particular strategy.
Cons:
- This type of volatility is based on prices and not on fundamentals;
- IV is sensitive to unexpected events.
VIX
This is a special indicator that measures expectations for the next 30-day volatility in the S&P 500 index. The VIX index is calculated by the prices of traditional options. When the VIX is higher, you can expect stock market volatility to grow, while the fall in this indicator predicts lower volatility for the next month.
Fear and Greed Index
There is another barometer that measures fear and greed, which is calculated by CNN. This famous media considers seven different factors to evaluate investors’ sentiment. The index ranges from zero to 100, with 50 in the middle. Thus, reading below 50 shows low green and fear sentiment, while when it is above 50, fear and greed start dominating the market.
Realized Volatility
This term refers to the movement in prices over a certain historical period. Realized volatility can be defined with BB or ATR indicators. When ATR goes higher, the volatility is growing, while when it goes down, you can expect volatility to decline.
Volatility Indicators
Volatility is visible on charts and you can quickly and easily separate the periods of low volatility from those when the volatility is higher. However, to make it even easier, you can apply some trading indicators and use them in your daily trading routine.
Bollinger Bands

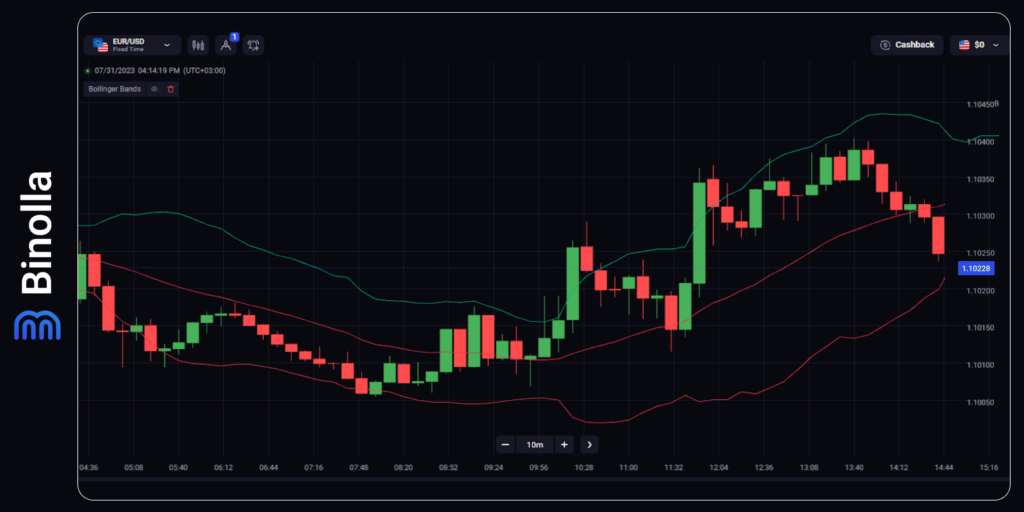
If you compare the left and right parts of the screenshot, you will see that they differ from each other by the distance between the Bollinger Bands extremes. The left part is less volatile as the bands are close to each other, while in the right part, the volatility rises, which can be clearly seen by the widening distance between the bands.
Thus, Bollinger Bands can be used as an indicator that allows you to find entry points. However, it can also be applied to more complex strategies in order to define volatility.
ATR

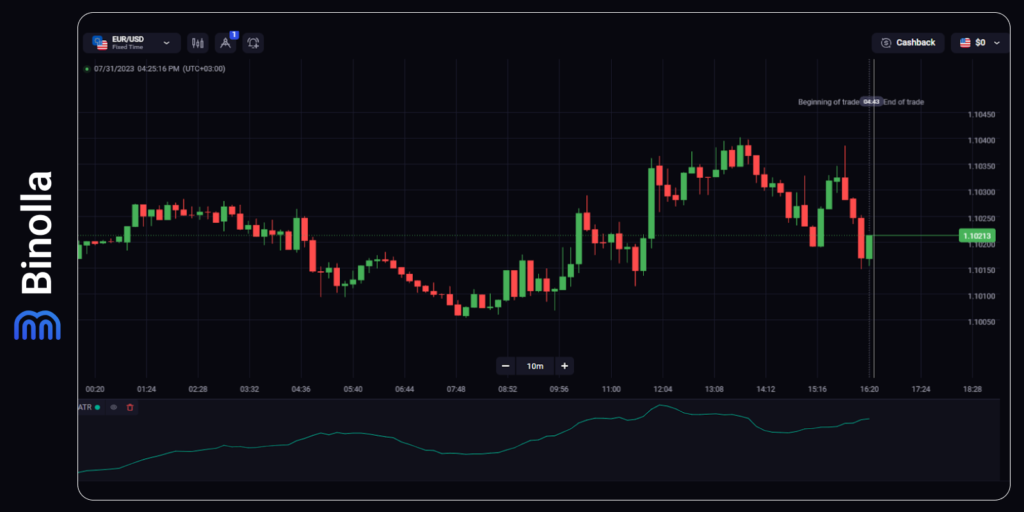
The ATR indicator (Average True Range) is a pure volatility indicator that can be used by traders to see whether price fluctuations are tight or not. Moreover, with this indicator, you can also define the strength of the current trend. However, don’t be confused by the direction of ATR. While it shows the rise and fall in volatility, you can’t predict the price movement direction with it.
The image above shows the ATR indicator applied to the EUR/USD chart. Every time the indicator climbs higher, you can see the volatility growth regardless of the current trend. This means that whether the price goes upwards or downwards, you will see it going higher.
On the other hand, when the price stays still with almost no volatility, ATR will remain at its lowest readings.
Unlike BB, which is an independent indicator and can be solely used in many strategies, ATR requires other indicators or analysis systems to be applied, as you can’t use the Average True Range for any other reasons except seeing the current market volatility.
Forex Volatility Breakout Strategy

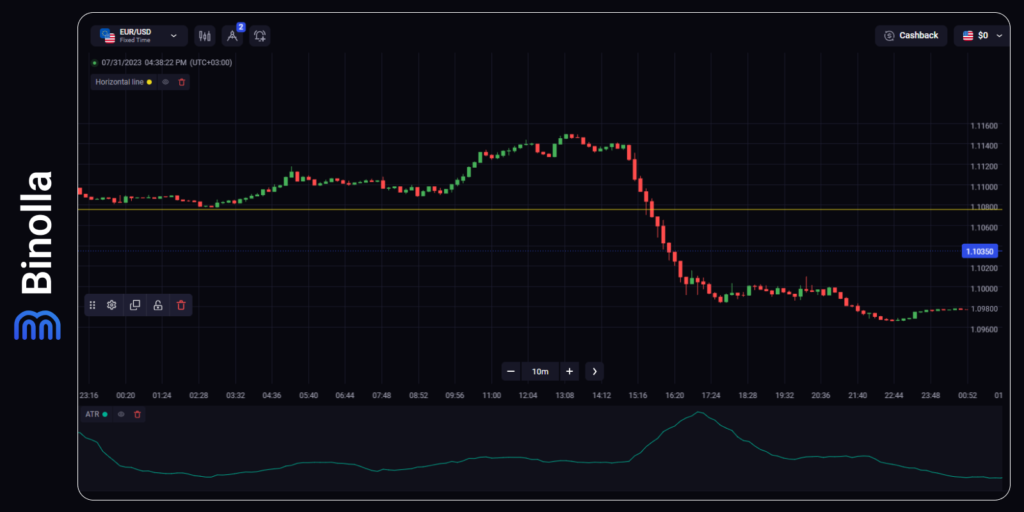
Now it’s time for a bit of practice to show how volatility can be used in strategies. First, you can apply the ATR indicator and build a support level. Then, you simply need to wait to see whether the volatility is going to rise or stay unchanged. Once it rises, you can expect the trend to start, and, as you can see in the image, the downtrend breaks the support level.
This is rather a simple strategy that you can add to your arsenal. But what if you don’t know where the price is likely to go after it breaks a horizontal channel? There is even an easier strategy that allows you to trade volatility even without defining trends or using any specific volatility indicator (this strategy is relevant for FX CFDs only).
The idea is to place limits on orders outside the price range. The buy order should be above the resistance level, while the sell order should be placed below the support line. Once the price breaks the upper line of the range, the buy order is triggered, and you can delete the sell one.
On the other hand, if the price breaks the lower line, you need to delete the limit buy order as the downtrend is likely to start.
Volatility: Tips and Tricks
Now that you know the basics, it is time to provide you with some useful tips. While higher volatility may seem like a blessing for a trader, it may be a curse at the same time. Here are some recommendations for you to follow to increase your chances:
- Keep updated on the latest events. Volatility does not come from nowhere. There is always something behind it. Therefore, you should keep an eye on fundamentals and geopolitical events in order to stay informed of what may happen next. This doesn’t mean that you will be informed all the time, as unexpected events may occur, like natural or man-made disasters, wars, etc. However, if you keep abreast and follow at least the fundamentals, your chances of succeeding are significantly higher;
- Build a strategy and stick to it. Random trading, along with massive volatility may ruin any balance. Thus, you should create a strategy with the analysis tools inside to find entry points in whatever markets you want. If you have a clear strategy, then you can handle any volatility, or almost any, with your head held high;
- Always use risk management tools. Especially when it comes to higher volatility cases. For any trade you make in FX or the stock market (digital options have inner money and risk management features, and you don’t need to enable them), you should use stop-losses, and take-profits and carefully plan your risks per trade. This will be especially helpful during times when the volatility is severe.
- Add various financial instruments and assets to your portfolio. Diversification is mostly based on volatility. If you look at the portfolios of the most prominent investors, you will find that they are divided into shares, where some of the assets are of low volatility, some are medium, and a part of those portfolios is devoted to high-volatility assets. When it comes to trading, you can make your own trading portfolio by adding various types of financial instruments and using them from time to time;
- Apply Indicators. While volatility can be calculated and clearly seen on charts, you can apply indicators like BB or ATR to make it even more visible, especially those periods of volatility switch when the range is done and a trend is on the way.
Final Words
As you can see, volatility is very important in trading and investing, whatever types of assets or financial instruments you buy. Before even considering trading a particular security, you should keep an eye on volatility to determine which strategy to use. If the price is ranging, i.e., fluctuates in a tight corridor with low volatility, you can use range breakout strategies for buying and selling the asset while at the same time expecting it to go beyond one of the lines and develop a directional movement.
During the higher volatility periods, you can use special indicators to confirm that the price is likely to be trending for a while so that you can buy a security or a currency pair or sell it and make money.
While volatility does not tell you about the current trend, this is a very important metric that allows you to adjust your money and risk management tactics, as well as create your own portfolio.
FAQ

Is High Volatility Good for Trading?
It depends on your abilities, your perception of risks, and the strategy that you use. For some traders, high volatility is good as they can make a lot of money on strong price fluctuations, while for others, it may do more harm than good. If you look at some cryptocurrencies, for instance, you will see that they are extremely volatile and not many traders can handle them. On the other hand, if an asset has low volatility, you can’t make a lot of money on its fluctuations unless you trade very actively with a lot of positions throughout your trading session.
What Are Volatility Examples?
Imagine that a stock makes more than 1% by rising and falling throughout the day. It can be called a volatile market. When it comes to cryptocurrencies, they can make even 20% in both directions and are considered among the most volatile assets.
Why Do Traders Love Volatility?
This is due to the fact that they make money on price fluctuations. While investors’s bread and butter are dividends, traders try to catch the lower price and sell when it goes higher. Therefore, the more volatile that asset is, the better (except in those cases of extreme volatility, when the risks are beyond imagination).


