Mastering Wedge Patterns: Trade Wedges Like a Professional Trader

Wedges are among the rare technical analysis patterns that can’t be met on charts every day. However traders should still know them as they enrich their library of price formations and help market participants benefit from price fluctuations in many situations. Wedges in trading are clear and straightforward, and what is even more important, these are strong patterns that help traders predict market reversals. By reading this article, you will learn more about wedges and how to use them to capitalize on price fluctuations.
Looking for trading opportunities with a reliable broker? Join Binolla and enjoy cutting-edge technology and a seamless trading experience with a regulated brokerage company!
Contents
- 1 What Are Wedges in Trading?
- 2 How to Confirm Wedges in Trading?
- 3 Types of Wedges
- 4 Start Trading with This Pattern!
- 5 How to Identify Wedges on Charts
- 6 Wedge Trading Strategies: How to Find Entry Points?
- 7 Common Mistakes When Trading the Wedge Pattern
- 8 Pros and Cons of Trading with Wedges
- 9 Conclusion
- 10 FAQ
What Are Wedges in Trading?
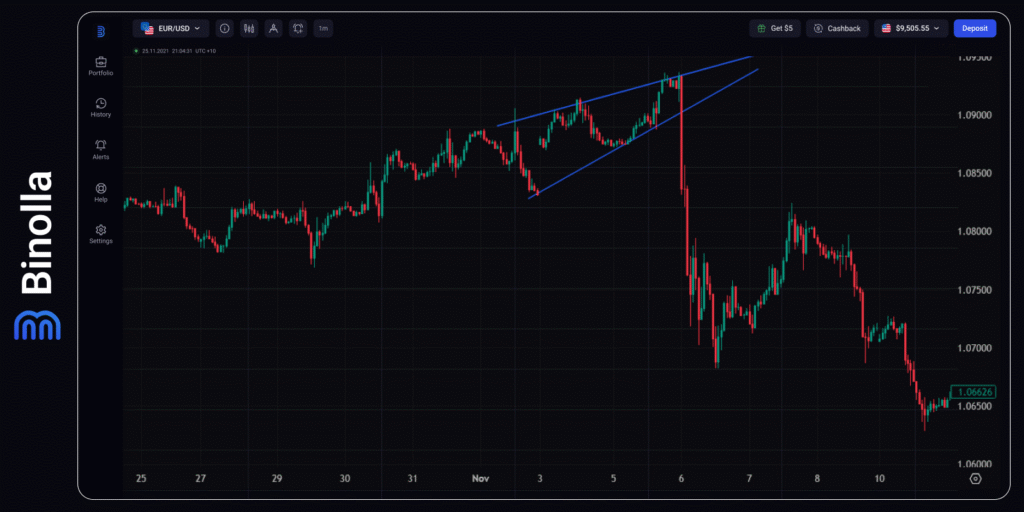
A wedge refers to a price formation where two lines highlighting lows and highs converge. Visually, a wedge resembles triangles, which are also chart patterns that you can frequently find during your trading sessions. However, unlike the latter, wedges always inform you about the possibility of a price reversal.
The idea behind a wedge pattern reflects the losing momentum, when the market sentiment is shifting as market participants are unable to push the price higher/lower. In the bearish wedge, for instance, the price still sets higher lows, confirming that the bullish trend is still in force, but highs do not confirm the development of the uptrend as they become more horizontal until the moment when the price breaks below the ascending trendline and starts making its way to the bottom of the chart.
Key Features of Wedges
To make it easier to find wedges on charts, you should grasp some key characteristics of such patterns. They include:
- Converging trendlines. The boundaries of the pattern move toward each other.
- Volume decline. Wedges are characterized by declining volumes, which signal indecision.
- Wedges are formed at the top/bottom of the market. They can’t be found somewhere in between.
- Smaller candlesticks. In most cases, candlesticks become smaller while the price approaches the culmination of the wedge.
You should not confuse wedges with triangles or price channels. The latter, for instance, allows you to buy along the current trend and confirm that the price direction is still in force when you trade along the trendline. When it comes to wedges, they are used to predict the market reversal or a correction.
| Feature / Pattern | Wedges | Triangles | Channels |
| Shape | Converging trendlines both sloping in the same direction (up or down) | Converging trendlines, one sloping up, the other down, or both horizontal | Two parallel trendlines, horizontal or sloping up/down |
| Trendline Slope | Both lines slope either upward or downward | Upper line slopes down, lower slopes up (symmetrical) or one is flat (ascending/descending triangle) | Both lines are parallel, with the same slope |
| Typical Signal | Reversal or continuation, depending on slope and trend | Breakout in the direction of the trend after consolidation | Breakout above or below the channel boundaries |
| Price Action Inside | Gradual narrowing of price range | Consolidation with lower volatility | Price moves back and forth between parallel boundaries |
| Duration | Medium-term (weeks to months) | Short to medium-term (days to weeks) | Can be short, medium, or long-term |
| Common Types | Rising wedge, falling wedge | Symmetrical, ascending, descending | Ascending, descending, horizontal |
| Breakout Direction | Often opposite to the slope of the wedge | Depends on the triangle type and prior trend | Above the resistance or below the support line |
How to Confirm Wedges in Trading?
After you have learnt the basics of wedges in trading, it is time to move on to confirmation. Each trading pattern requires confirmation before you can use it to open a position. When it comes to wedges, you can use the following tools:
- Japanese candlesticks. With this method, you can confirm the future reversal. For instance, when trading a bearish wedge, you can check for evening star, shooting star, hanging man, bearish engulfing at the resistance level before the price breaks below the ascending trendline to confirm the pattern.
- Technical indicators. Using such indicators as RSI, moving averages, and MACD will help market participants confirm reversals at early stages.
Types of Wedges
Like all other technical analysis patterns, wedges have two types. You can find them at the top of the market when they predict downside reversal and at the bottom of the chart, when they tell traders about the possibility of upside reversal.
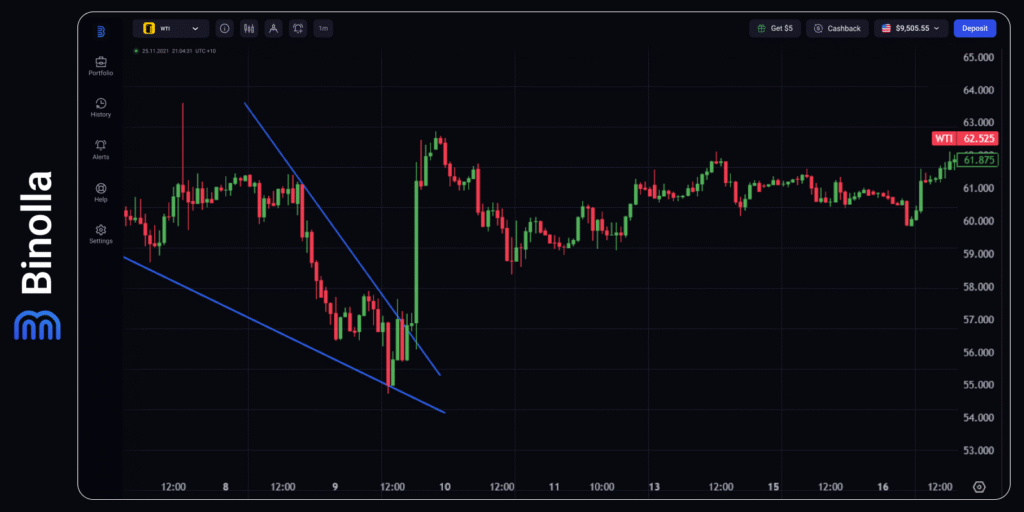
Bullish wedge in trading
Also known as a falling wedge, this type of price pattern forms when both lines slope downward. The upper edge decreases faster than the lower one. When such a pattern forms, sellers are still in control. However, their pressure decreases gradually. At some point, bulls take control and manage to push the price higher with strong momentum. Traders can seek confirmations, like reversal patterns, momentum indicators leaving the oversold area, or even long tails of candlesticks, saying that sellers are unable to push the price lower.
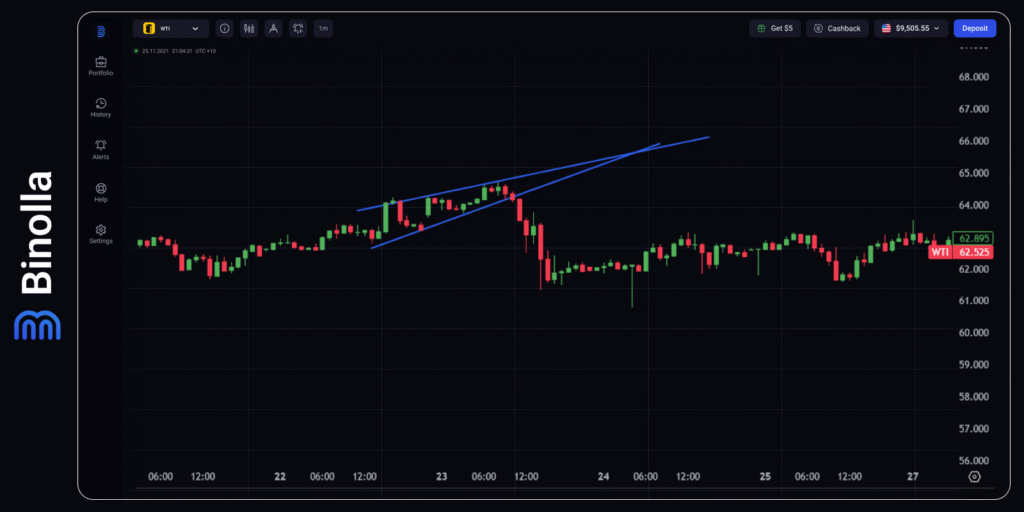
When it comes to the bearish wedge, aka rising wedge, the situation is totally opposite. The price sets higher lows, while highs rise more slowly, which means that while buyers still control the market, their power is limited.
The market psychology behind this phenomenon is simple. Buyers are still in force, but they lose ground and their impact is weakening. Sellers begin to push, and their impact gradually increases. At some point, the balance shifts towards sellers, and they begin to dominate. When the price breaks below the ascending trendline, the signal comes.
How to Identify Wedges on Charts
Correct identification of a wedge is 50% successful when trading with this pattern. Therefore, before delving into how to use a wedge in trading, it is worth looking at how to spot such a formation. Here are some cues that will help you find patterns on various types of charts:
- Lines and their slopes. Each line in the wedge formation should have at least two points where the price hits it (support and resistance). The slope of both lines should be in the same direction. For rising wedges, the slope should be upwards, while for falling wedges, it should be downward. The space between the two lines becomes narrower over time, hinting at the probability of a breakout.
- Timeframes. Wedges can be identified on various timeframes. If you trade digital options, you can even find them on minute scales. However, it should be mentioned that more reliable structures appear on timeframes starting from 1-4 hours. This is due to the fact that such timeframes contain less market noise and all patterns on them are more reliable.
While identifying wedges in trading is quite simple, traders still make mistakes when finding them on charts. Some of the common ones include:
- Drawing trendlines to fit the pattern. If the lines are not converging, this is not a wedge, but a parallel channel instead, which means that the trend may go on instead of a reversal.
- Confusing wedges with triangles. Another common mistake is when traders find triangles and use them like wedges. Both lines should slope in the same direction for wedges. Therefore, you should check this rule in order not to confuse patterns
Wedge Trading Strategies: How to Find Entry Points?
Now that you know how to identify wedges on charts, it is time to learn how to trade them. There are two main strategies that market participants use when they see a confirmed wedge: buying an asset (or a Higher contract) when the price breaks above the upper line of the falling wedge and going short (buying a Lower contract) when the price breaks below the lower line of the rising wedge. Let’s look closer at them.
Bearish Wedge Strategy
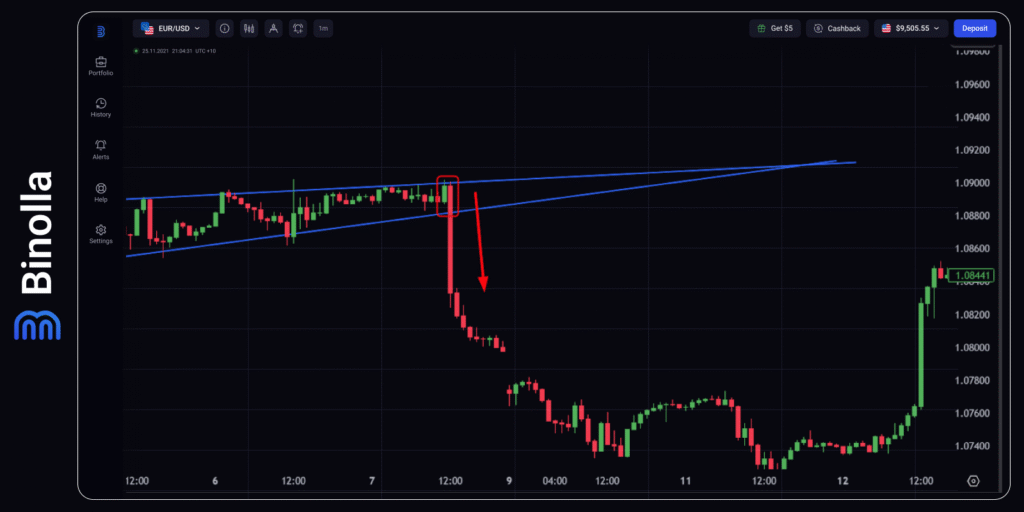
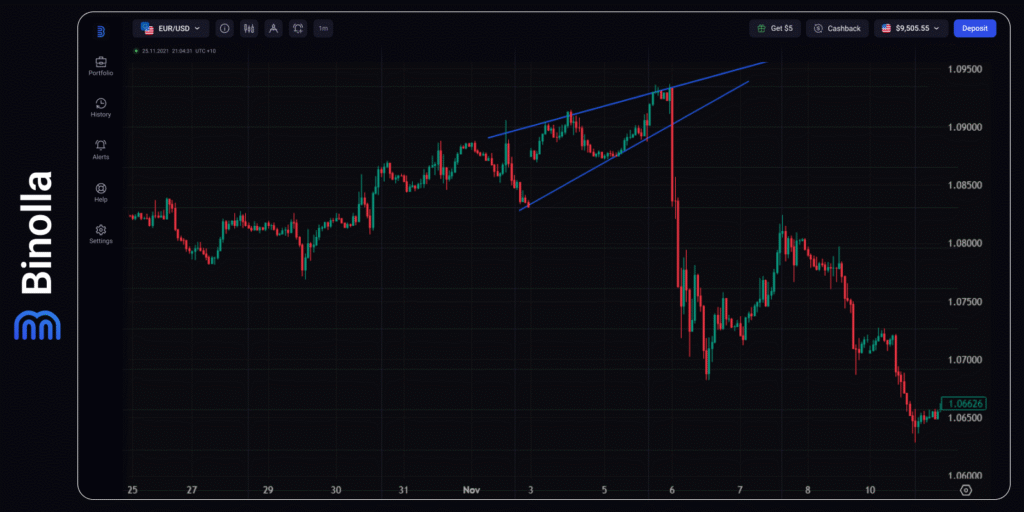
The first strategy is trading the rising wedge. After spotting the pattern, the trader should wait for the entry points to come. There may be several waves of price fluctuations (typically 2 or 3) before the price breaks the lower boundary and begins to move downside.
In this particular example, we have a confirmation with a long red candle, which engulfs the small green candle at the top of the pattern. Then, the price breaks below the ascending trend line. The short position or a Lower contract should be opened when the long red candle closes.
If you take a more aggressive approach, you can engage even earlier, even without waiting for the long red candle to close. While trading CFDs, you can have higher profits, but risks are also high as the pattern may fail and the price may move in the opposite direction.
Bullish Wedge Strategy
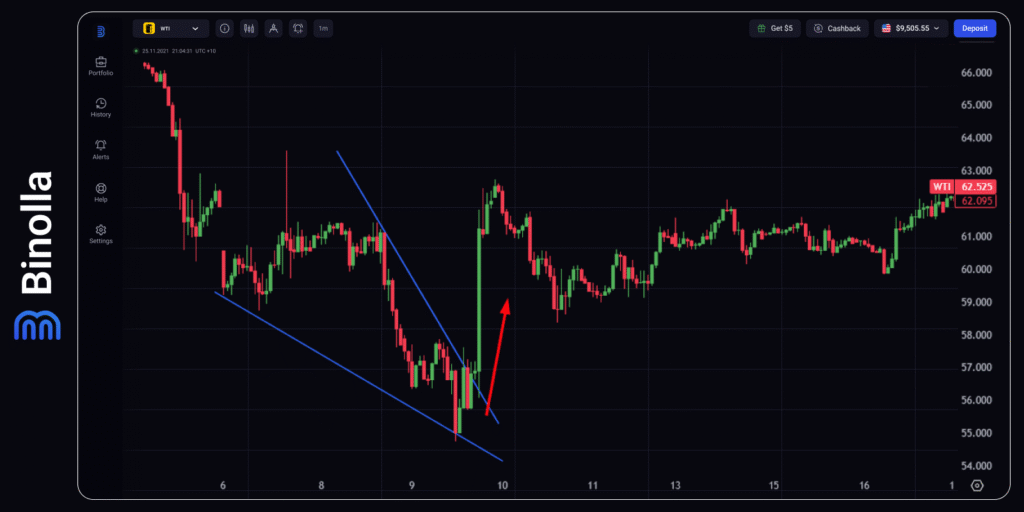
The next strategy allows you to buy an asset or purchase a Higher option. The wedge slopes down, which means that at a certain point the price may move higher with momentum. In this particular case, there is no candlestick confirmation. Therefore, a trader should wait until the price closes above the higher line of the wedge. In this particular situation, you can open a trade right before the long green candle or once it is closed.
Keep in mind that you can also buy a contract or an asset once the price crosses the higher line. However, this is an aggressive approach with higher risks.
Common Mistakes When Trading the Wedge Pattern
While the wedge pattern is quite simple and trading it may seem straightforward, some beginners still make mistakes. Happily, we are here to help you avoid most of them. Here are some common failures and how to deal with them when using the wedge pattern:
- Entering a trade before the pattern is confirmed. Once you spot the pattern, you should wait for the confirmation to occur before engaging. However, if you find a reversal pattern like a shooting star, hammer, or any other, or there is a signal coming from a technical indicator, you can engage beforehand.
- Ignoring the broader market context. Trading wedges should be done in conjunction with major trends. For instance, if you see a bearish wedge but the major trend is upward on higher timeframes, then you should understand that the reversal price movement may be short in time.
- Trading each wedge that you find. Not all patterns of this type that you will find on charts are worth your attention. Look for pure wedges to engage and avoid those that you doubt.
- Not using risk management strategies. Even if you have a clear trading signal, placing a stop loss order will be an advantage. The price may go in the opposite direction, and the pattern may fail in general, which may cause bigger losses.
Pros and Cons of Trading with Wedges
Trading wedges has both positive and negative sides. The advantages of this pattern include:
- Clear trading signal. Wedges are very illustrative, and once you understand how to find them on charts, you will have a clear picture of what to do.
- Applicable to various types of financial instruments. Whether you trade digital options or CFDs, you can apply wedges to your trading strategies. Moreover, this formation can be used when you trade forex, cryptocurrencies, commodities, or stocks.
- High reward potential. Wedges often end with momentum, which allows you to make substantial gains afterwards. When it comes to risks, they are minimal, as the opposite line of the edge is often located close to the signal line.
- Integration with various strategies. Wedges can be used together with candlestick analysis or various technical indicators.
When it comes to the drawbacks of trading with wedges, they include:
- False patterns. Like any other technical analysis pattern, when trading wedges, there are risks of failure. The price may risk when you expect it to break below the lower edge during the rising wedge, for instance.
- Subjectivity. This is another common drawback of using chart patterns in trading. Sometimes traders find wedges where there are no patterns at all.
Conclusion
Wedges are powerful technical analysis patterns that help market participants find entry points in both directions. However, before you start using them, you should first grasp the idea and understand how wedges work. The rules are simple, but should be followed strictly. Anyway, trading with wedges may bring you significant profits, whether you use digital option contracts or CFDs in your trading routines.
FAQ
What is the difference between wedges and triangles?
The key difference between the two is that both lines of a wedge point the same direction, while in triangles, one of the lines is horizontal, or both lines point in the opposite direction.
Can I trade wedges on all timeframes?
Yes, sure. Wedges can be traded on different timeframes without limitations. However, the higher the timeframe you choose, the more reliable the pattern will be, as lower timeframes are known for so-called market noise.
Can I have a confirmation of the wedge formation in advance?
Yes, you can. Professional traders often use additional technical analysis tools like momentum or trend-following indicators, as well as the Japanese candlestick analysis system. They can use these tools as signals and then use a wedge as a confirmation.
Do wedges always work like they should?
No, none of the patterns or strategies always work as it is supposed to. In some cases, the price may make false breakouts or even move in the opposite direction. This is where risk management rules come into play.
Where to place stop losses when trading wedges?
Stop losses can be placed at a specific distance if you use your own risk-to-reward approach. Also, a trader can place a stop loss right above the upper line in the rising edge or below the lower line in the falling edge.
