Tweezer Tops and Bottoms: A Complete Guide to Popular Reversal Patterns

Japanese candlestick patterns are very popular for their reliability. They are widely used by professional traders with quite an impressive 70-80% success rate on average. Tweezer tops are rather popular and frequent patterns that you can see on charts every day, depending on the timeframe that you use. By reading this article, you will learn more about this formation and how to use it in trading. We will also provide you with information about the psychology behind this pattern.
Ready to start trading now? Join Binolla and place your trades with a reliable and regulated international brokerage!
Contents
- 1 Tweezer Tops and Bottom Basics
- 2 Market Psychology Behind Tweezer Patterns
- 3 Are These Patterns Reliable?
- 4 Trading Strategies Using Tweezer Tops and Bottoms
- 5 Try Tweezer Patterns in Trading
- 6 Common Mistakes to Avoid When Trading Tweezer Tops and Bottoms
- 7 Pros and Cons of Trading with Tweezer Patterns
- 8 Conclusion
- 9 FAQ
Tweezer Tops and Bottom Basics
Tweezer tops and bottoms are powerful reversal candlestick patterns that are used by many traders in technical analysis. They appear at the top or at the bottom of the trend with two consecutive candles having the same highs or lows. Like many other candlestick patterns, these ones signal that the asset is losing momentum.
Tweezer Top
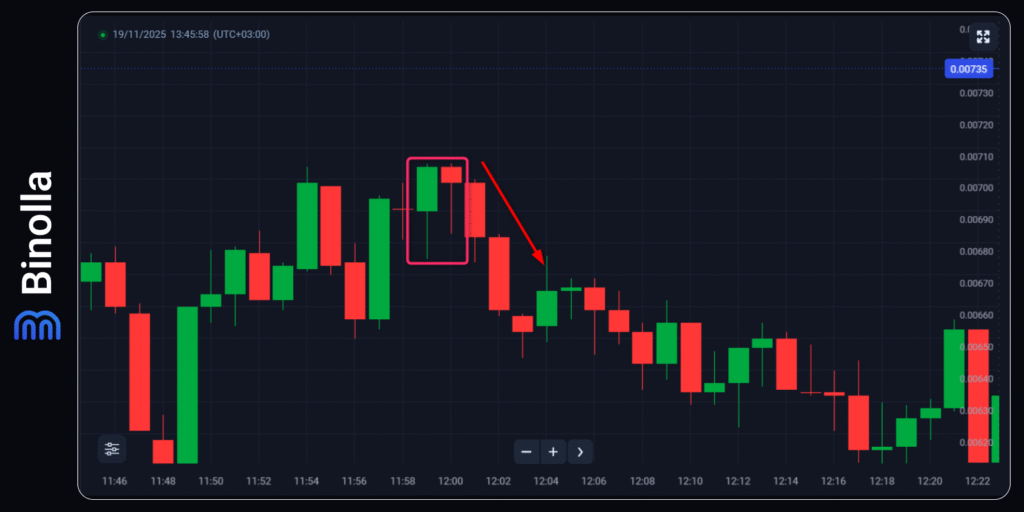
A tweezer top pattern appears at the end of the uptrend or when the current leg of the upside is losing momentum. This formation suggests a bearish reversal or at least a downside pullback. The first candle is typically bullish, which suggests that the uptrend is still in force. The second candle is a bearish one. The pattern is valid if the highest points of both candles are at the same level. The pattern in general suggests that buyers are no longer in control, and sellers may push the price lower.
Tweezer Bottom
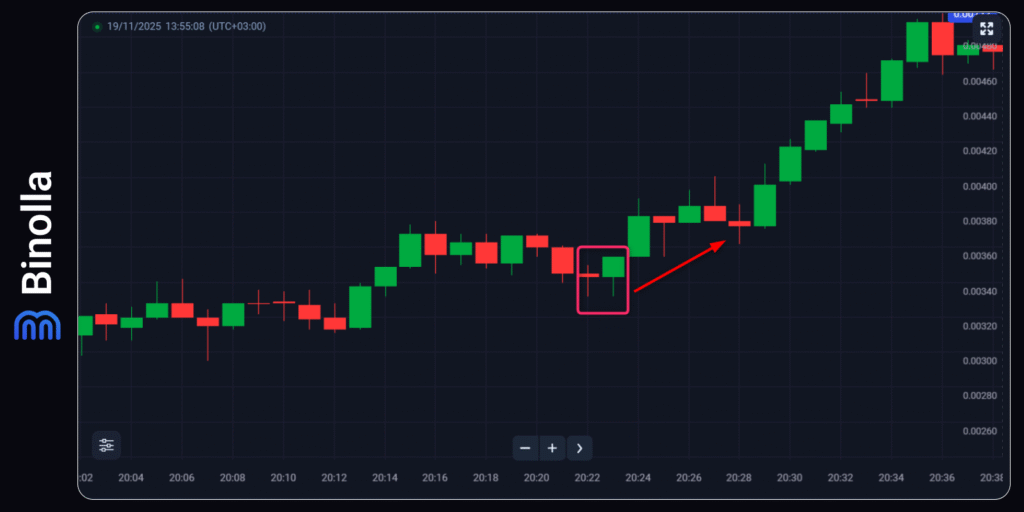
Speaking about the tweezer bottom pattern, it appears after a downside movement at the bottom of the downtrend. Once appeared, this pattern suggests that the downtrend is over and an upside movement may occur. Unlike the tweezer top, this formation consists of the first bearish and the second bullish candle. Both have the same lowest point. After the bullish candlestick closes, a trader may expect the price to move upwards.
Key Features
To trade with these patterns successfully, you should delve into some key features that are listed below:
- The pattern consists of two consecutive candlesticks with identical highs or lows.
- The formation appears at the end of a trend and not in the middle of the price movement.
- The effectiveness of the pattern is higher when it appears at support or resistance levels.
Market Psychology Behind Tweezer Patterns
All candlestick patterns are subject to market psychology. Whether you see a long tail or a small body, all of these are consequences of market decisions. When it comes to tweezer top and bottom, these formations can also be studied from a psychological standpoint. First, let’s look at the psychological aspects behind tweezer tops:
- Buying pressure decreases. Buyers still try to push the price higher and continue the uptrend. However, with the second bearish candle, selling volumes increase. Moreover, the previous high remains unbroken, which means that bulls are exhausted.
- Sellers feel weakness. With the inability of bulls to push the price higher, sellers start acting more actively, which increases downward pressure.
- Sentiment shift. This transition from a bullish market to a bearish one leads to a reversal.
When it comes to psychological reasons behind tweezer bottom patterns, they are the following:
- Selling pressure decreases. Sellers still try to push the price lower in a downtrend, which is seen with the first bearish candle of the pattern. However, the second candlestick can’t close below the first one, which means that sellers are exhausted.
- Buyers step in. While sellers are no longer in control, bulls enter aggressively and create a strong upward momentum.
- Market sentiment shifts. With all the above conditions in place, the market begins to shift from bearish to bullish.
Are These Patterns Reliable?
Speaking about reliability, tweezer tops and bottoms have been used by professional traders for many years already, and they have proven that these formations can be trusted. To prove it, we have brought together some important points:
- Points where liquidity rises. Matching tops and bottoms shows levels where large institutions place their orders. Once the price reaches these levels, a reversal or a correction is likely to increase significantly as those orders trigger.
- Market memory. Traders and investors pay attention to levels, and they also place orders at them, which makes these patterns even stronger.
- Psychological pressure. If a level remains strong for a long time, it is more likely that the price will reverse once reaching it than breaking it.
Trading Strategies Using Tweezer Tops and Bottoms
Now that you know more about these patterns, it is time to delve into the key strategies that you can apply when you meet such formations on charts.
Using Tweezer Tops and Bottoms as Entry Points
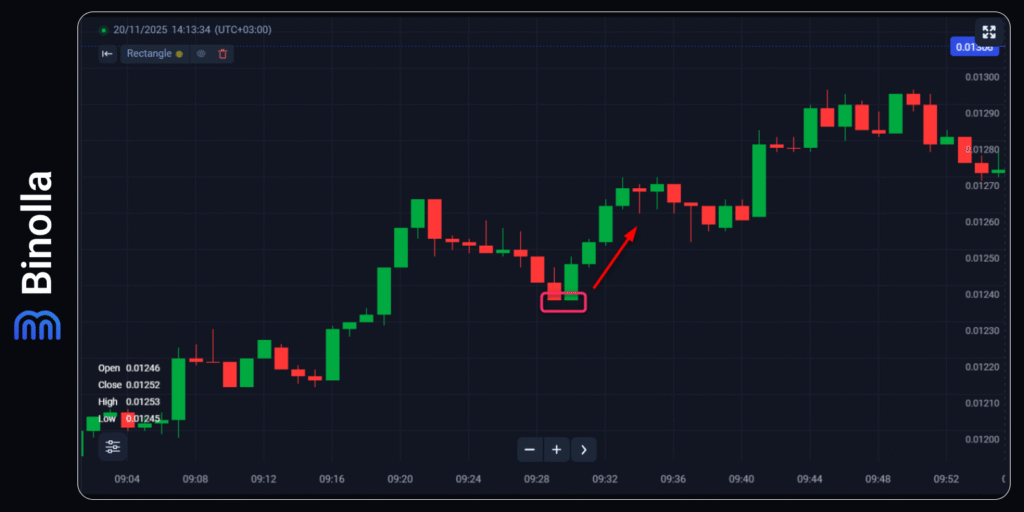
First, let’s look at a strategy using a tweezer bottom pattern. Here we have two candles with no lower wicks at all. However, the lower points of both meet each other. To trade it using digital options, you should simply wait for the second green candle to close and then place a Higher order. That’s all. After opening a trade, you simply need to wait for expiration.
For CFD traders, buying here can be accomplished once the second candle closes. The system works the same way, but after placing a trade, you should also think about placing stop losses. Unlike digital options, where risks are limited by the amount of your investment in one trade, in CFDs, you should think about how to mitigate your risks on your own.
When trading with this pattern, you can place a stop loss right below the local low (the pattern). Alternatively, you can calculate your risk-to-reward ratio per trade and calculate your stop loss using maths.
When it comes to targets, you can hold the position until a reversal signal appears at the top of the current uptrend that occurs after the tweezer bottom pattern.
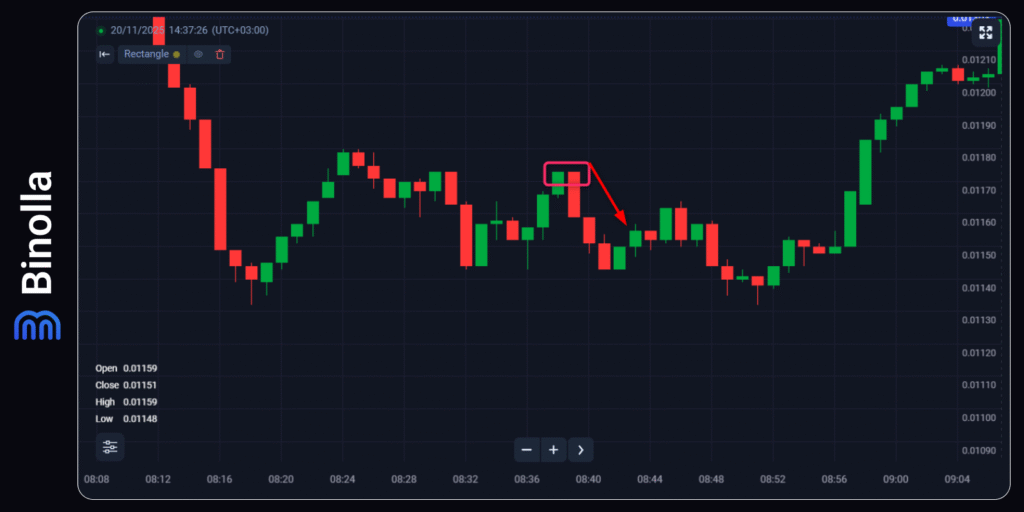
When trading digital options, once you see the pattern, you should simply wait for the bearish candle to close. To see the results, you should wait for the expiration. Place a Lower order after the red candle closes and see how the strategy performs.
Those who trade CFDs should also wait for the second candle to close. Sell the asset you trade right after the closure or wait for the price to break below the lowest point of the second candle of this pattern (if there is a wick below).
Stop losses should be placed above the pattern, or you can calculate them according to your risk-to-reward system. As for profits, you can wait until the next reversal signal appears.
Combining Tweezer Tops and Bottoms with Indicators
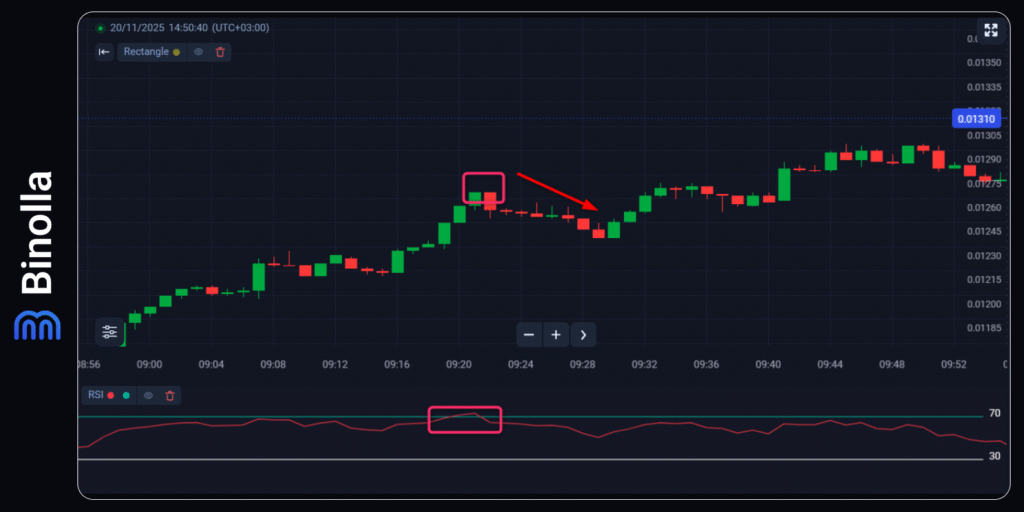
RSI is among the most popular indicators for providing traders with insight into when the asset is overbought or oversold. The overbought condition tells traders that the asset may reverse downwards, while when a currency pair, stock, or cryptocurrency is oversold, this means that the price may go upwards in the near term.
By adding this indicator to your strategy, you can augment it significantly and filter out false entries. In the example above, you can see that the indicator moves above 70 at some point and then falls below this level. The tweezer top appears on the chart and confirms that the price may go down soon. Whether you trade digital options or CFDs, you can buy a Lower contract or sell in this situation to benefit from the upcoming downside.
Common Mistakes to Avoid When Trading Tweezer Tops and Bottoms
While the pattern is simple to recognize and trade, novice traders may make some mistakes that may lead to negative results. Here are some of the most common ones with an explanation on how to avoid them:
- Ignoring the current market context. Tweezers are more reliable when they appear at the end of the previous trend and not in range markets. If you enter a trade without previous trend, then risks of false reversals are higher.
- Watching for support and resistance levels. Tweezers work better when they are located at support and resistance levels. If you ignore such areas, you risk entering a trade in zones where reversals are unlikely.
- Relying on the candle pattern alone. While the pattern is reliable in itself, market participants should also look at volumes, volatility, and momentum. Traders should also pay attention to some trend indicators or trendlines.
- Placing a trade too early. Traders should enter the market right after the second candle of the pattern closes. Entering prematurely may lead to mistakes. There is no guarantee that the pattern will work until the closure occurs.
- Ignoring proper risk management. While digital options traders can simply enter a trade and wait for expiration, CFD traders should place a stop loss to control their risks while the trade is live. They should also plan where they will leave the trade to avoid situations when a profitable trade will turn into a losing one.
Pros and Cons of Trading with Tweezer Patterns
Traders who use these formations in trading will benefit from a lot of advantages. Some of the key ones include:
- Clear entries. These formations are very simple and provide market participants with clear visual entry points demonstrating where a reversal may occur. This makes them useful for traders who rely on price action.
- Tweezer tops and bottoms allow traders and investors to open high-probability short-term trades. These patterns appear at the key turning points, which allow market participants to enter in advance.
- Both patterns work in various timeframes. Their universality is one of the key benefits for traders, as they can use both short-term and long-term strategies. For instance, digital option traders can use them even when they trade 5s scalping contracts.
- Confirmation-friendly patterns. Traders can use various indicators, including RSI, MACD, as well as drawing tools like support and resistance lines, and even Fibonacci, to trade more consistently.
While there are many benefits of using tweezer tops and bottoms, some drawbacks also exist. Here are some of the most evident ones:
- False signals. While these patterns are reliable enough, if you trade them out of market context, you can end up losing your money. When finding a tweezer top or a tweezer bottom, make sure that they are located at a resistance or support.
- High risks of being trapped. If the pattern is not confirmed by volume or support/resistance levels, then a trader may be trapped and lose money.
- No guarantee of a reversal. When you see a reversal pattern, you expect a reversal to occur. However, you never know whether this pattern suggests a pure reversal or a correction. For digital option traders, this means nothing as these are short-term contracts. However, if you trade CFDs and expect pure reversals, then you can be trapped.
- Subjectivity. Traders are mostly subjective when they see price action patterns. One trade may see a tweezer top, while another may see nothing. This can reduce consistency in trade setups.
Conclusion
Tweezer tops and bottoms are simple chart patterns that consist of two candlesticks. They appear at the top and bottom of the market and suggest a reversal or a correction. By understanding what lies behind these patterns, market participants can improve their trading results. However, if you trade tweezer tops and bottoms, you should never forget about market context.
FAQ
What is a Tweezer Top?
A tweezer top is a candlestick pattern that appears at the top of the market at the end of the uptrend. This pattern tells traders that the uptrend is exhausted and the market may make a downside reversal soon.
What is a Tweezer Bottom?
A tweezer bottom is a reversal candlestick pattern that appears at the bottom of the market at the end of a downtrend. When you spot it on charts, you can expect that the price will reverse or a correction will occur. The two candles have identical lows, which suggests that bears can’t push it lower.
How Reliable are These Patterns?
While these patterns are reliable in general, you should never forget that they require confirmation by the market context. Moreover, traders can use various indicators, including RSI and MACD, to improve their trading results.
Can I Use These Patterns on Any Timeframes?
Yes, they can be applied to various timeframes. However, you should keep in mind that trading with tweezer tops and bottoms on smaller timeframes is riskier due to market noise.
How to Trade These Patterns?
Before placing a trade, you should make sure that the second candlestick is closed. Next, you should also check whether the pattern is located at support or resistance. CFD traders should also place stop losses to mitigate their risks.
Are These Patterns Better Alone or With Indicators?
All patterns can be confirmed by various technical indicators, including tweezer tops and bottoms.
