Reading Japanese Candlestick Charts
Japanese candlesticks are one of the most popular charting techniques nowadays. They provide traders with a lot of information about the current price and even allow them to make assumptions about the future price. Apart from being a way to illustrate the price, Japanese candlesticks offer a broad range of patterns that can be used in technical analysis to predict future movement directions.
By reading this guide, you will find out more about how to read these charts as well as about the most popular patterns that you can use to forecast price fluctuations. This type of charting technique can be applied to various assets, including stocks, currencies, cryptocurrencies, commodities, etc. The article will provide you with general information about all the most popular patterns. If you need a detailed explanation of each particular one, you can find it in separate candlestick patterns’ guides. Those who are ready to start trading can create their accounts at Binolla.
Contents
- 1 What Is a Japanese Candlestick?
- 2 Bullish Candlestick Explained
- 3 Bearish Candlestick Explained
- 4 Japanese Candlestick Chart Example
- 5 Spinning Tops
- 6 Marubozu
- 7 Start using Japanese candlesticks with Binolla!
- 8 Doji
- 9 Hammer and Inverted Hammer
- 10 Shooting Star and Hanging Man
- 11 Bullish and Bearish Engulfing
- 12 Harami
- 13 Tweezers
- 14 Morning and Evening Stars
- 15 Three White Soldiers and Three Black Crows
- 16 Trading with Japanese Candlestick Patterns: Tips and Recommendations
- 17 FAQ
What Is a Japanese Candlestick?
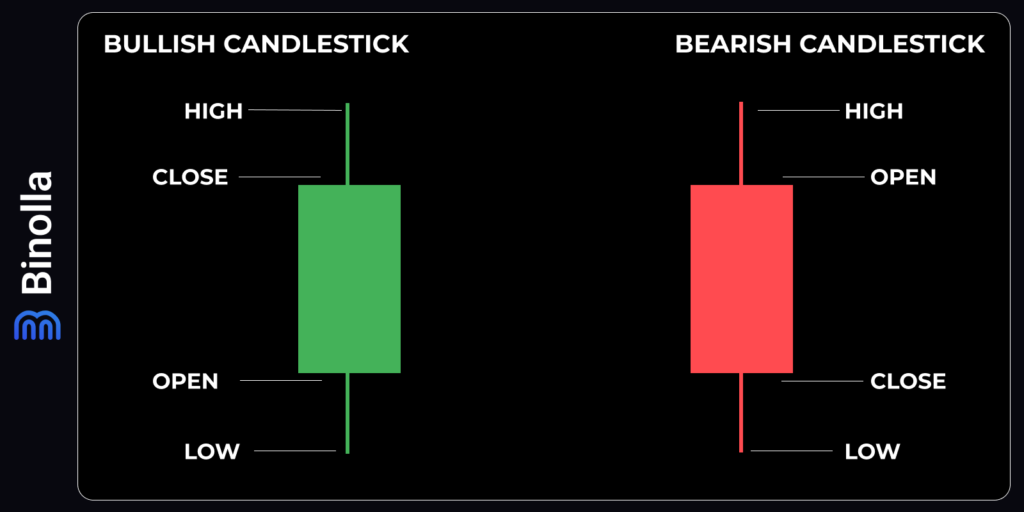
A standard Japanese candlestick represents a vertical body (rectangle) and two wicks above and below the body. There are two main types of candlesticks – bullish and bearish. A bullish one is normally painted green, while a bearish one is colored red.
Bullish candlesticks reflect the situation when the open price for a particular period is below the close price. This means that, in general, the price has increased for a certain time interval. When it comes to bearish candlesticks, the close price is below the open price, which means that the price decreased for a certain time interval.
Bullish Candlestick Explained
Each Japanese candlestick has four parameters. When it comes to a bullish one, the lower edge of the body is the open price, the upper edge of the body is the close price, the lower wick indicates the minimum price for a particular period, and the upper wick illustrates the maximum price for this interval. For instance, if you use a 5-minute chart, each candlestick represents a five-minute interval and, therefore, you will see open, close, maximum, and minimum prices for this particular period.
Bearish Candlestick Explained
Unlike a bullish candlestick, a bearish one opens higher than it closes. Therefore, the upper edge of the body illustrates the open price, while the lower indicates the close price. The upper tail of the bearish candlestick shows the highest price for a particular period, while the lower indicates the lowest price for this period.
Japanese Candlestick Chart Example
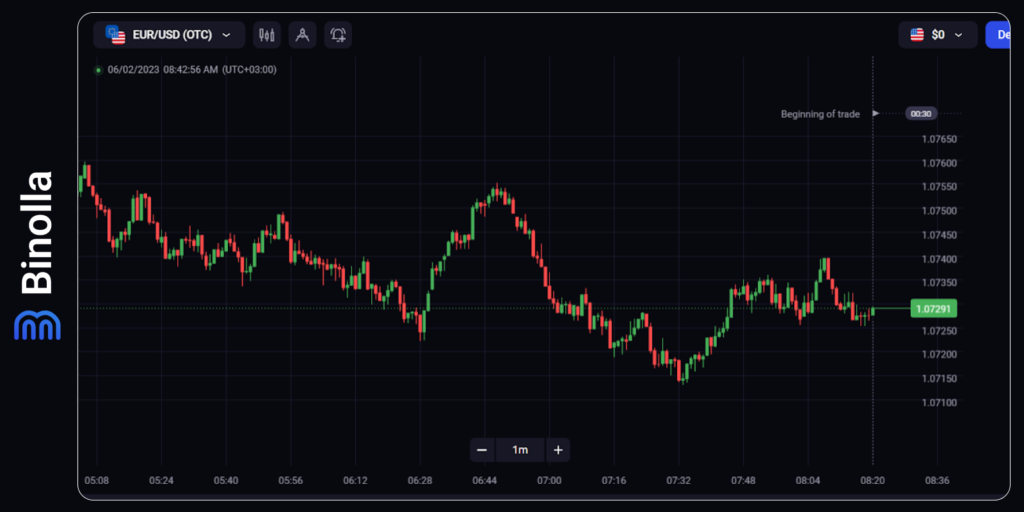
This is what the Japanese candlestick chart looks like. As you can see, when the price goes up, there are mostly green (bullish) candlesticks, while when the price goes down, red (bearish) candlesticks prevail. When there is no clear direction, both red and green candlesticks appear.
Another thing that you can notice in our example is that not all candlesticks look alike. This is one of the biggest advantages of this type of chart, as you can use those patterns to predict price fluctuations. We are going to provide you with information about the most interesting candlestick patterns.
Spinning Tops
This is one of the most frequent single candlestick patterns that you can find on the charts almost every day. Spinning tops stand for small bodies and long tails in both directions.
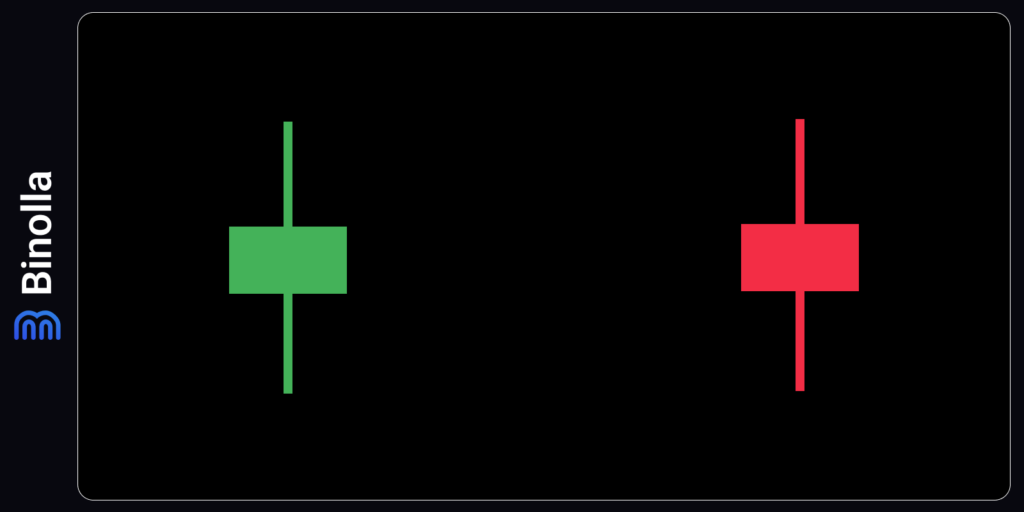
Spinning tops mean a fight between buyers and sellers. When it comes to a trend, spinning tops always mark the weakness of the current market tendency. However, it doesn’t mean that the trend is over once this pattern appears. In some cases, spinning tops may simply be a break before the directional price movement resumes.
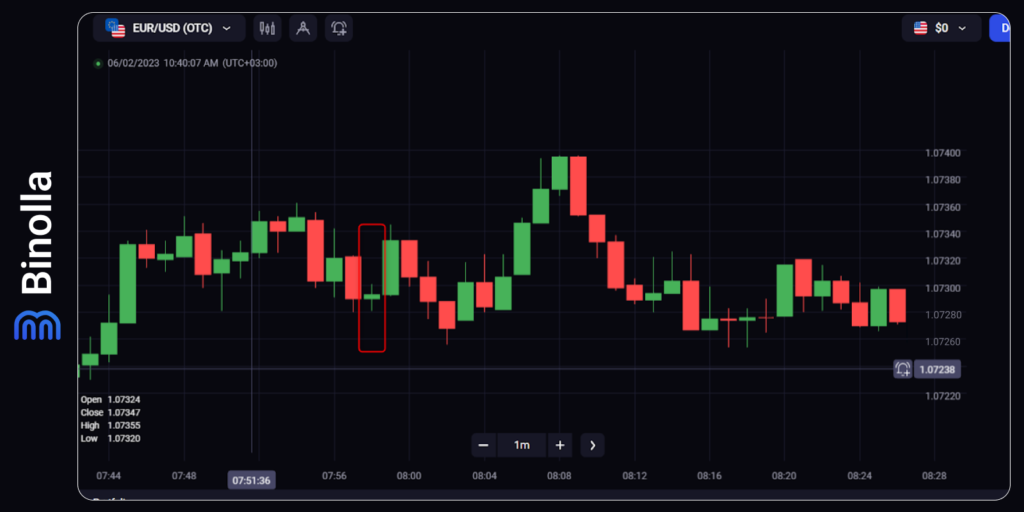
Here is what a spinning top looks like on a real-life chart. As you can see, there was a local downtrend, which was interrupted once the spinning top appeared. Later, the price changed direction and moved upwards. Therefore, in this particular case, traders could buy a Higher contract or simply purchase the currency pair when trading Forex CFD.
Marubozu
If the maximum and minimum prices for a particular period were equal to the open and close prices, those patterns are known as Marubozu.
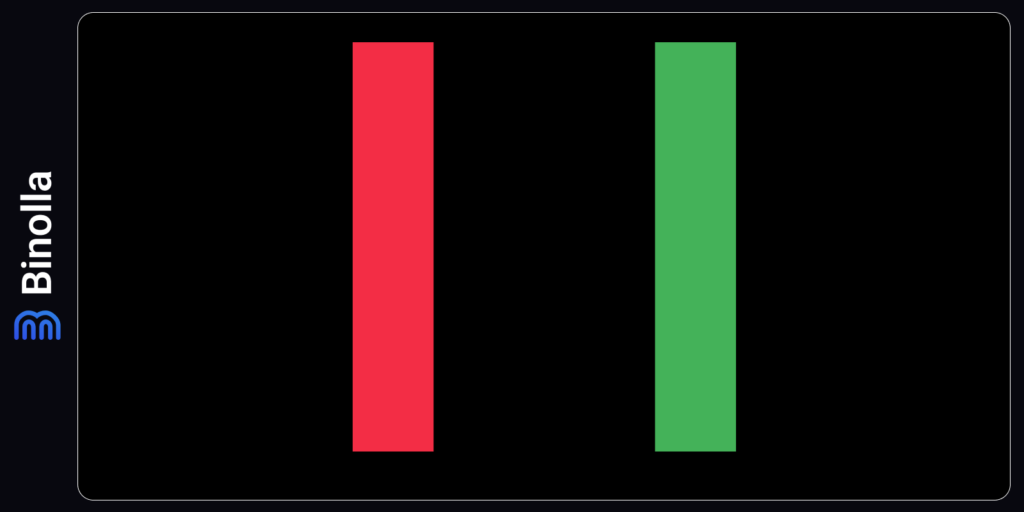
If you take a look at our example, those are candlesticks without wicks. When it comes to bullish Marubosu, it means that buyers were dominating during a particular time interval, while the red one means the opposite (sellers were stronger than buyers).
Unlike Spinning tops, Marubosu is a clear signal of bullish or bearish strength, depending on the color of the candlestick.
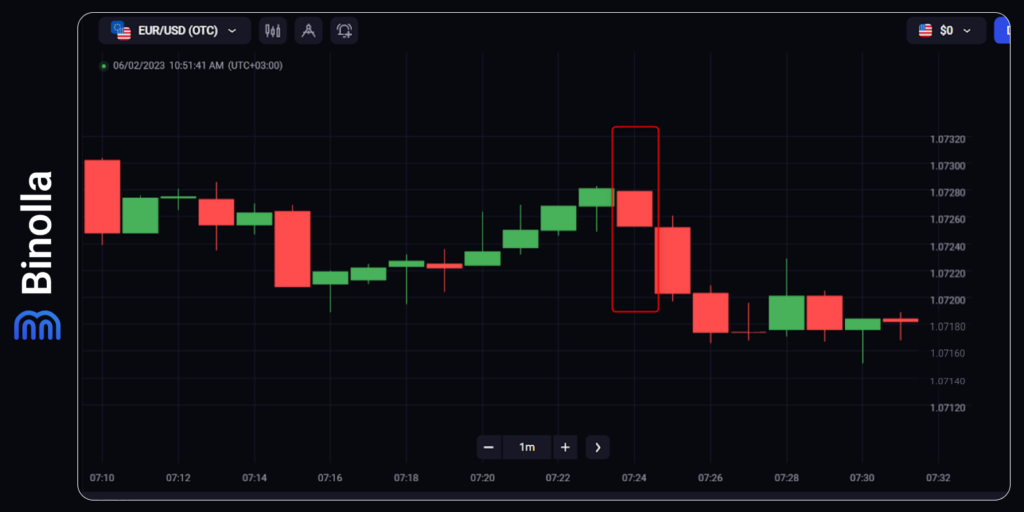
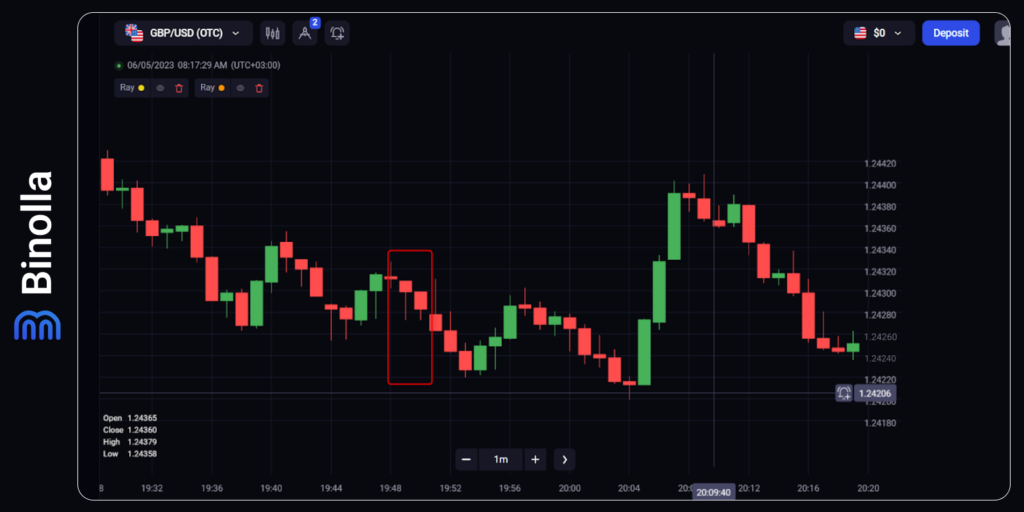
In this particular example, we see a bearish Marubosu, which has no tails at all. This is a signal for a trader that the downside movement is likely to continue. Therefore, you can buy a Lower contract or sell the currency pair. Moreover, if you are already in the market, you can stick to your position for longer, as you can expect that the price is likely to decrease again.
Doji
This pattern looks very familiar to those who have already examined Spinning tops as it also has long tails. However, unlike Spinning tops, Doji has no body at all, which means that the open price is equal to the close one.
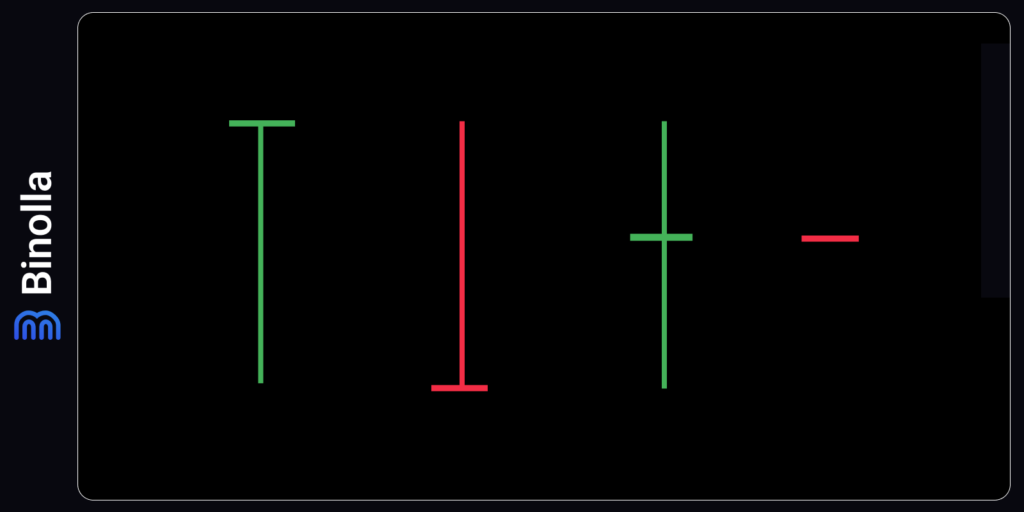
There are four types of Doji that you can find on the chart:
- Both legs are long and the body is located somewhere in the middle;
- Gravestone Doji has no lower leg;
- Dragonfly Doji has no upper leg;
- Four-price Doji has no legs at all.
Similar to Spinning tops, Doji is a pattern of uncertainty, and in some cases, it can be treated as a reversal signal.
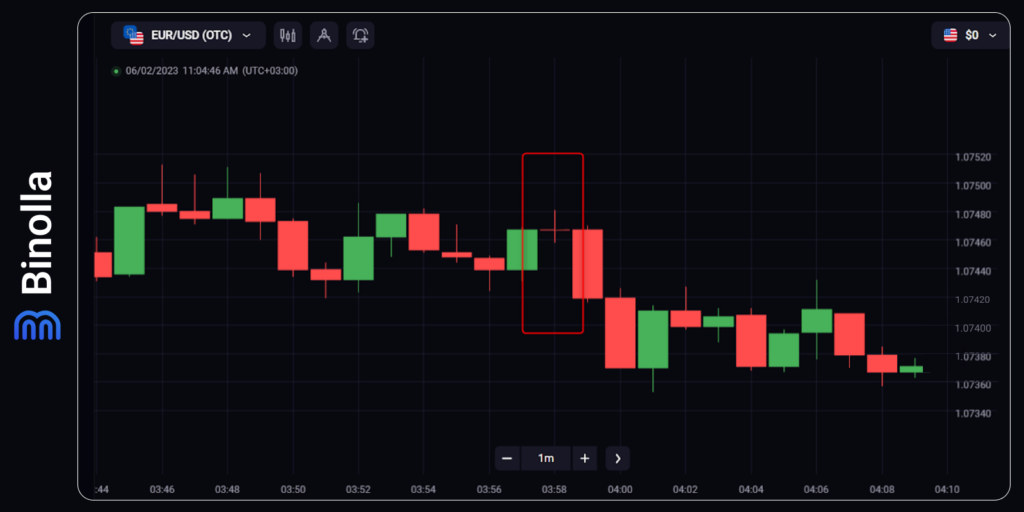
In the example above we have a classic two-leg bearish Doji that is formed after a brief local uptrend. In this case, the price reversed after Doji. Therefore, traders could use this situation in their favor and buy a Lower contract or sell the currency pair.
Hammer and Inverted Hammer
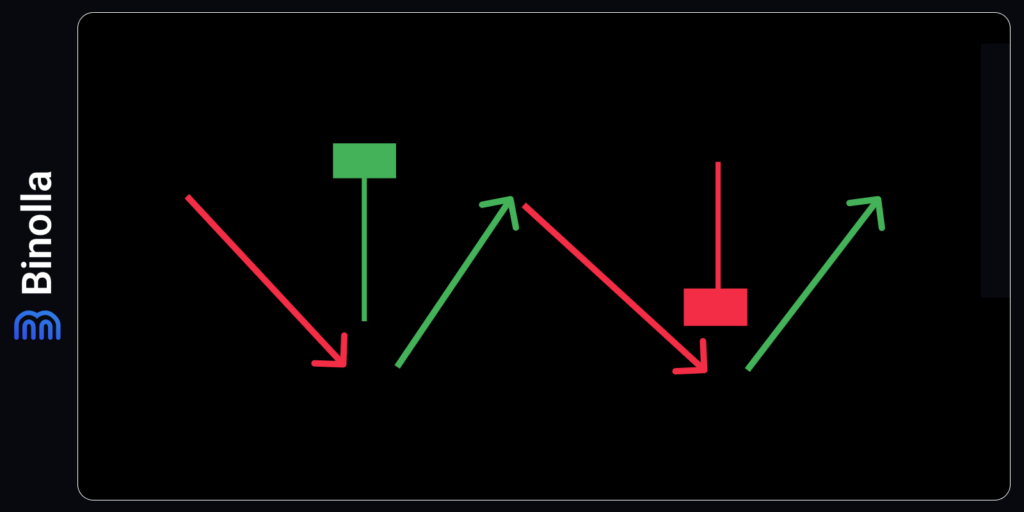
This is one of the most popular candlestick patterns ever. Hammer has a long tail, which is normally bigger than the body. As for the body, it is small. Classic Hammer has no upper wick at all; however, when it comes to charts, you may find Hammers with small upper tails as well.
When it comes to inverted Hammers, they are a mirror image of standard Hammers, which means that they have long tails above and small bodies below. As for the lower wicks, they are minor, but classic Inverted Hammers have no lower wick at all.
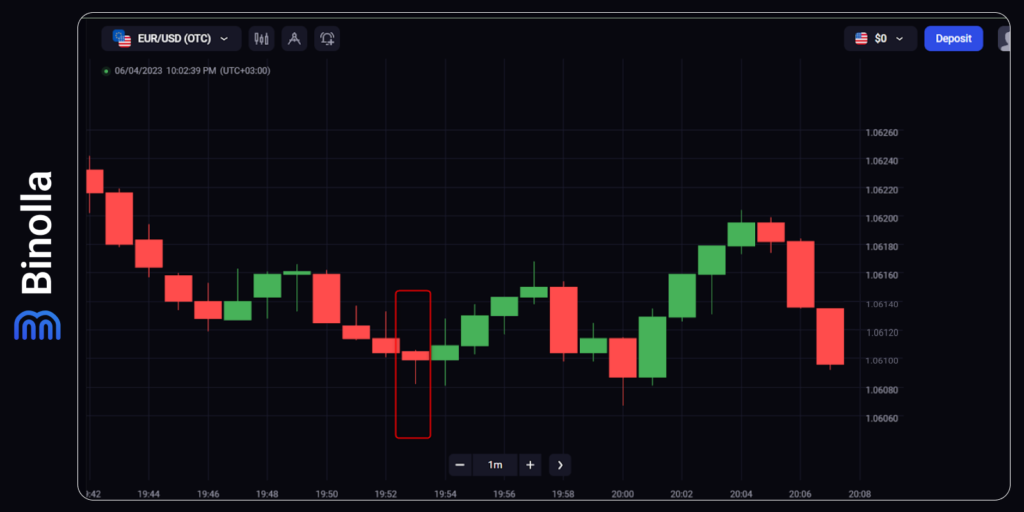
Hammers are reversal patterns. They are formed at the bottom of the market after a downtrend. A standard hammer means that the price is likely to end its downside movements and is likely to reverse upwards. Therefore, once this pattern appears on charts, you can buy a Higher contract or purchase the currency pair.
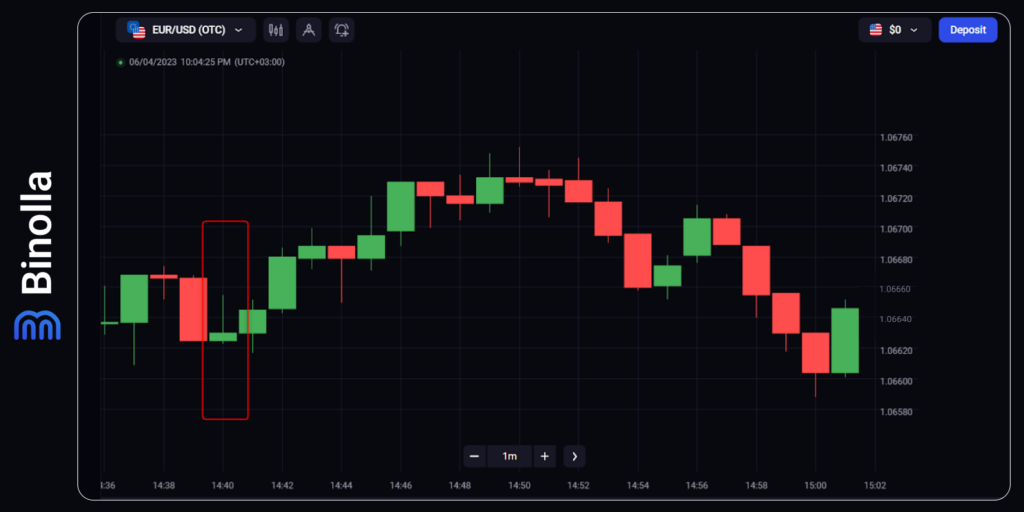
When it comes to inverted Hammers, they are based on the same idea of market reversal. Once this pattern appears, the previous downtrend is likely to come to an end, and the uptrend is likely to start. As a result, you can buy a Higher contract or simply purchase the currency pair.
Shooting Star and Hanging Man
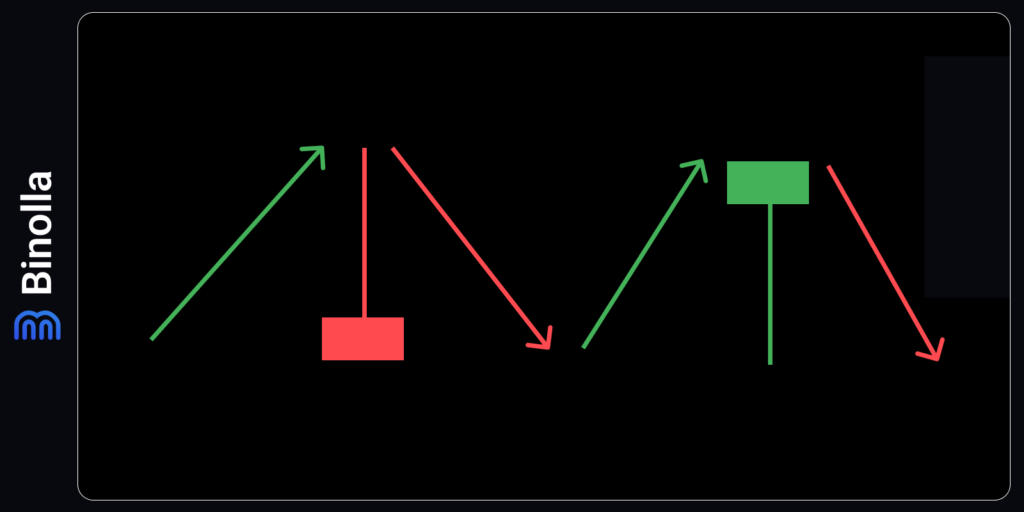
Hanging Man and Shooting Star are both reversal patterns that crop up at the top of the uptrend. Hanging Man looks similar to Hammer and Shooting Star is the twin of Inverted Hammer. While Hammer and Inverted Hammer appear on the support level, Shooting Star and Hanging Man crop up on the resistance level.
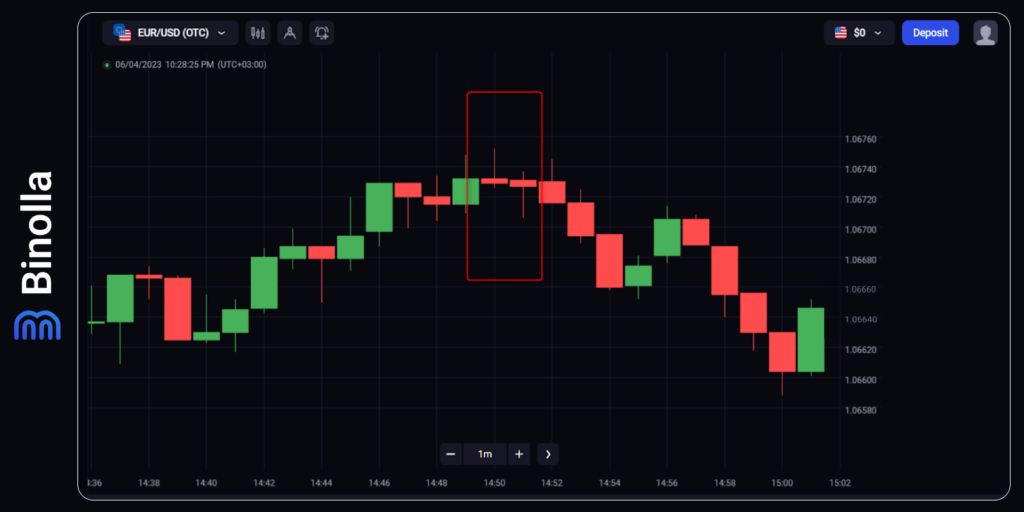
The image above shows both patterns at the same place, which happens sometimes. The first is Shooting Star, and then comes Hanging Man. As it was already mentioned, both are reversals; therefore you can buy a Lower contract after Shooting Star or sell the currency pair.
Bullish and Bearish Engulfing
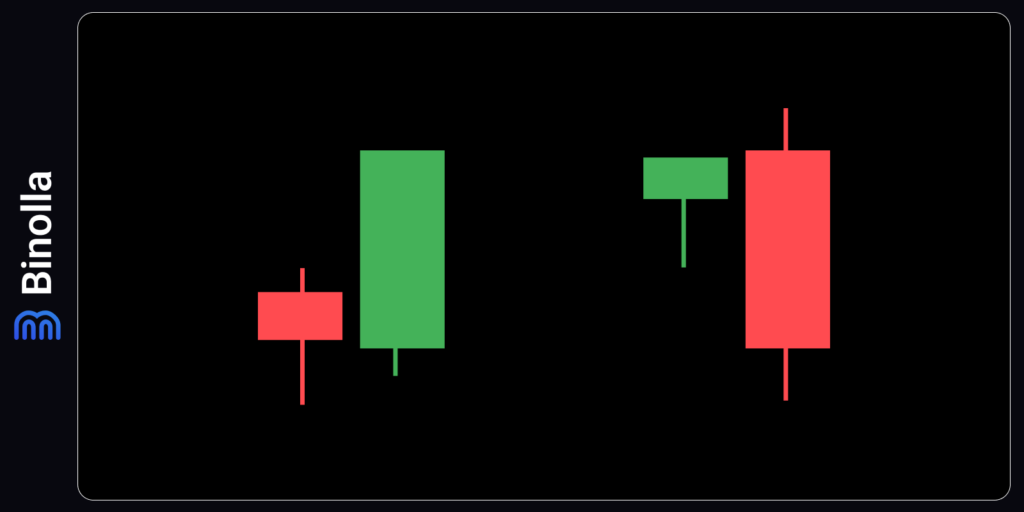
All the patterns that were described above are based on a single Japanese candlestick. However, apart from them, there are also double and even triple-candlestick models. Engulfing is one of them.
Bullish engulfing appears after the downtrend. The first candlestick in this double-candlestick model should be bearish, and the second should be bullish. According to the name of this pattern, the second “engulfs” the first, which means that its body is larger.
When it comes to Bearish engulfing, this is a mirror pattern to a bullish one. We have two candlesticks, with the first being bullish and the second being bearish. Another key condition for this pattern is that the bearish candlestick should “engulf” the bullish candlestick.
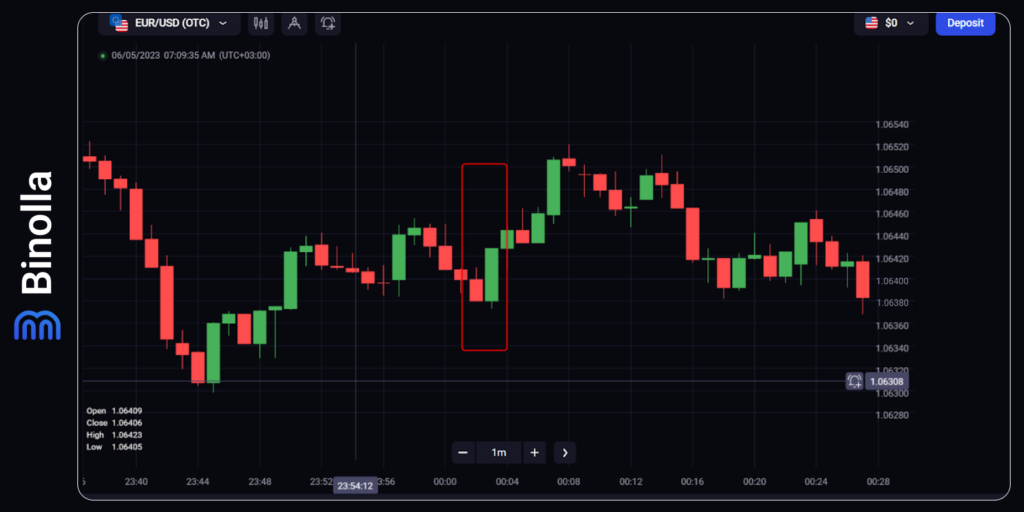
Let’s take a look at the charts. In the example above, you can see classic Bullish Engulfing, which crops up in the support level. After the local downtrend ends, this pattern shows that the price is likely to reverse upward. Therefore, you can buy a Higher contract or purchase the currency pair.
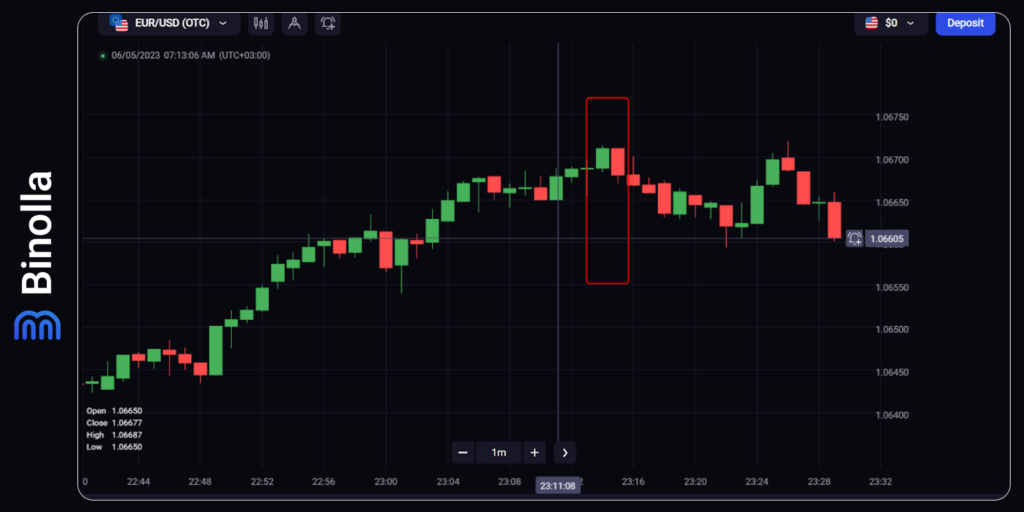
Bearish Engulfing, on the other hand, appears in the resistance level and predicts the end of the local uptrend, as shown in our example. As a result, you can buy a Lower contract or simply sell the currency pair after the bearish candlestick crops up.
Harami
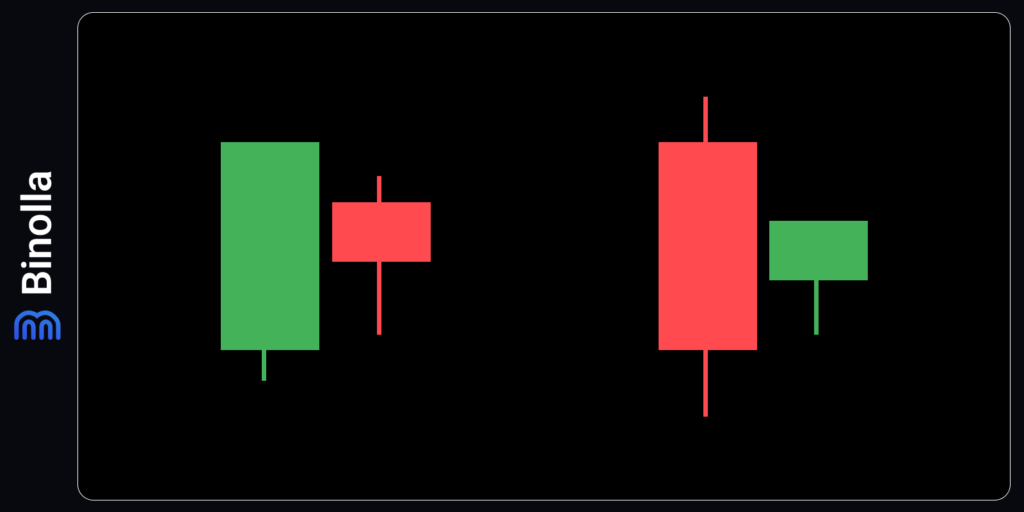
A classic Harami pattern represents two candlesticks, where the second one is “engulfed” by the first one. This model has a lot in common with Engulfing, being its mirror copy. In bearish Harami, you have the first bearish candlestick with a longer body and the second bullish candlestick with a smaller body, which is “engulfed” by the bearish one.
When it comes to a bullish Harami pattern, the first bullish candlestick has a longer body, and the second bearish one is “engulfed” by the bullish candlestick.
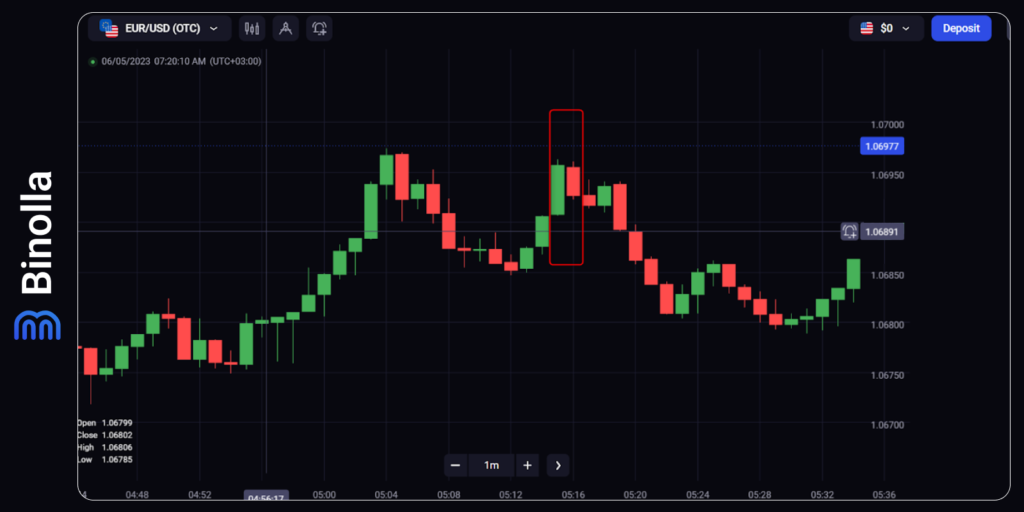
Keep in mind that a classic Harami can be mostly found in Stocks, where gaps are frequent. In the example above, we have a kind of Harami, where the bearish candlestick is completely engulfed by the bullish one. However, when it comes to Forex, this type of pattern can be rarely found on charts due to higher trading volumes.
If you see this bearish Harami, you can think about buying a Lower contract or selling the currency pair.
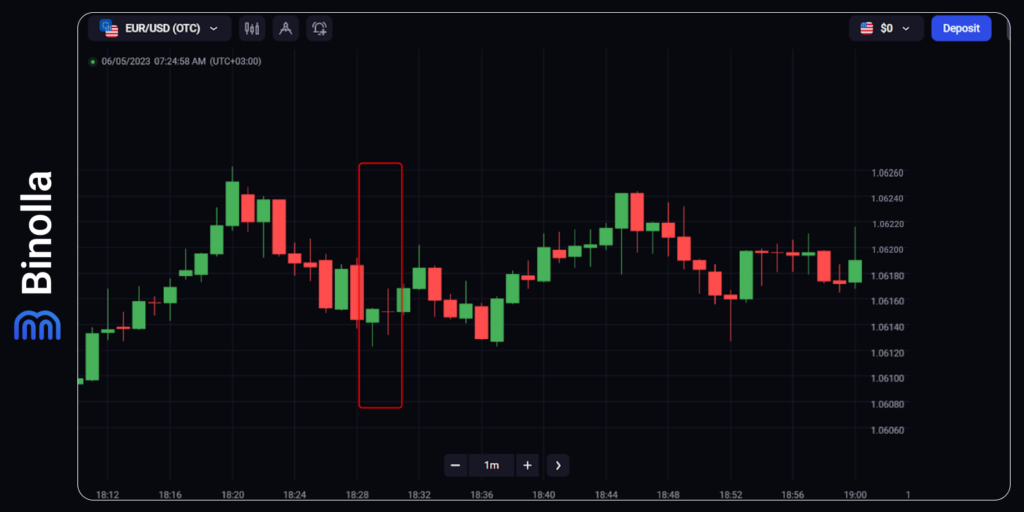
There is one more type of Harami that includes one standard candlestick and one Doji. This combination is known as Harami Cross. It has the same meaning for the markets, as the idea of the model is to show that the previous trend comes to an end and the new one is likely to begin. In the example above, you can see a bullish Harami Cross after a local downtrend. Traders could buy a Higher contract or purchase the currency pair in this situation.
Tweezers
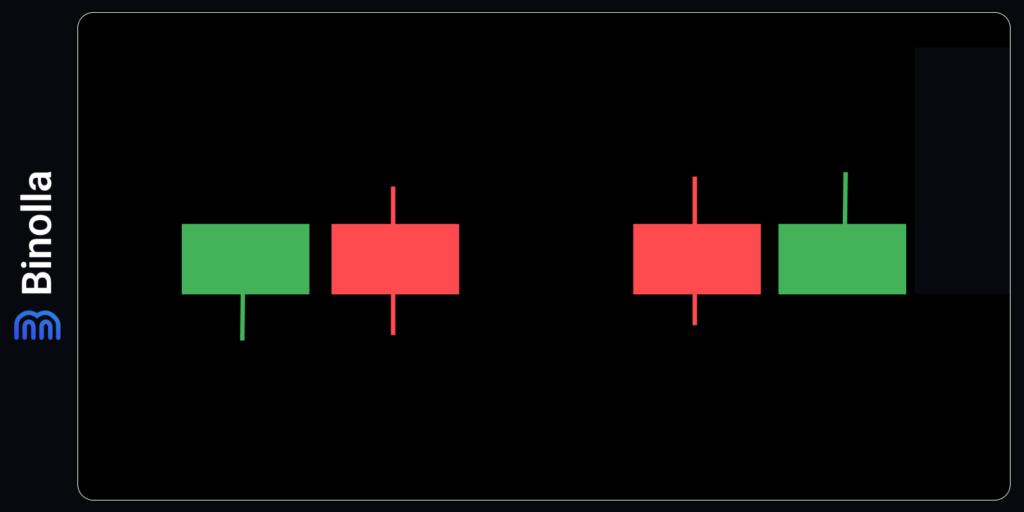
Tweezers or Twins are very rare candlestick patterns with two identical candlesticks facing in various directions. Bullish Tweezers crop up after a downtrend. It consists of a bearish candlestick, which is identical or almost identical to the next bullish one. One of the key conditions of this pattern is that two candlesticks should have wicks below the same size, meaning their lowest levels are the same.
When it comes to bearish Tweezers, they are a mirror reflection of the bullish ones, with bullish and bearish candlesticks of the same size having wicks of the same length. In turn, hit the same highs.
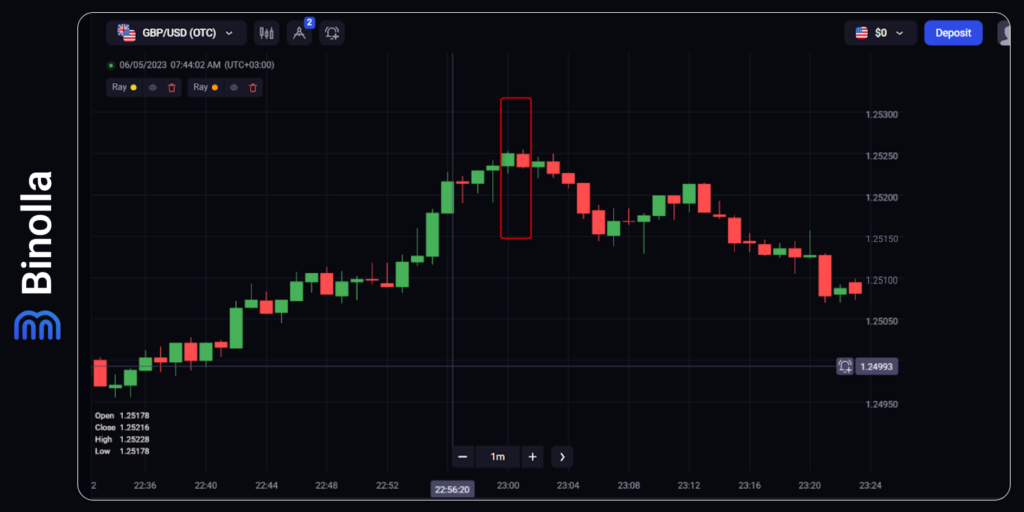
Classic Tweezers are very rare, but if you find one on the chart, you can use it as this is a very strong pattern. In our example, we have a pattern that is very close to classic Twins, but a bullish candlestick here has a lower wick, while a bearish one has none. Anyway, this pattern can be treated as Tweezers with the idea to buy a Lower contract or sell the currency pair.
Morning and Evening Stars
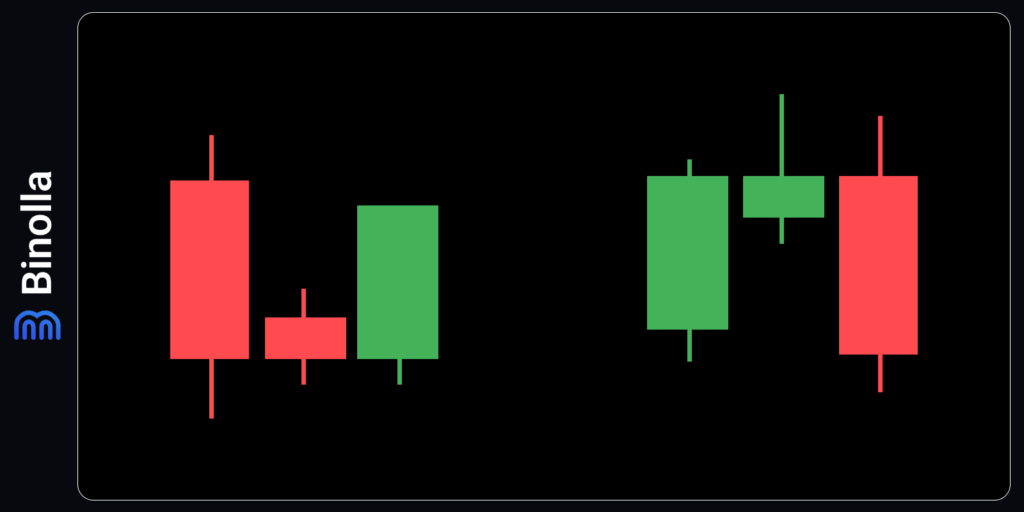
Those are triple-candlestick patterns that allow you to find spots on the chart where the price is likely to reverse. Morning Star crops up in the support level. It starts with a large red candlestick, which is still the continuation of the previous downtrend. Then comes a small Spinning Top, which shows the uncertainty of the market and demonstrates that the bulls come into play. The next long-bodied candlestick confirms the reversal.
When it comes to Evening Star, it is the mirror reflection of Morning Star with the first long-bodied bullish candlestick, Spinning Top, and a long-bodied bearish candlestick, which confirms the beginning of a new trend.
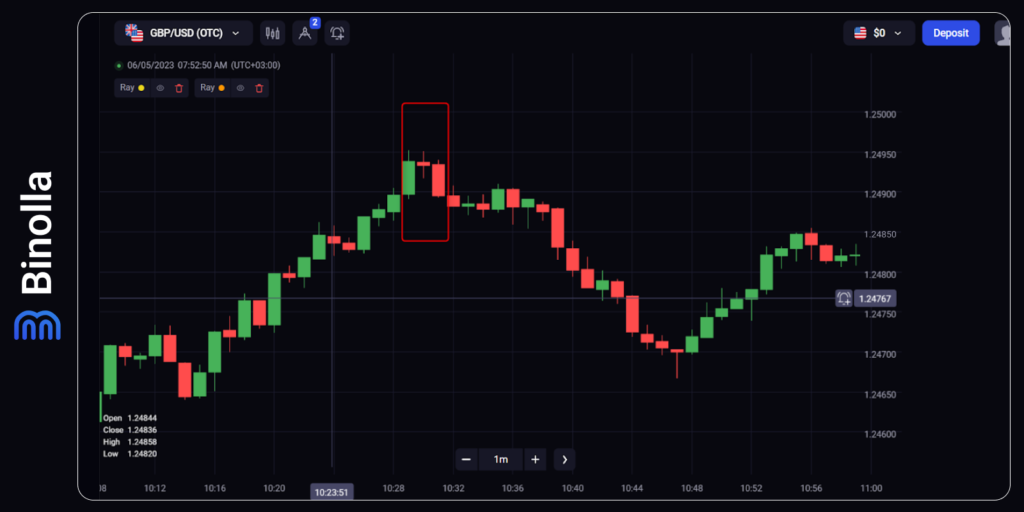
The example above shows the Evening Star, a pattern that predicts the end of a bullish trend and the reversal of the market. If you see this pattern during your market research, you can buy a Lower contract once the red long-bodied candlestick closes.
Three White Soldiers and Three Black Crows
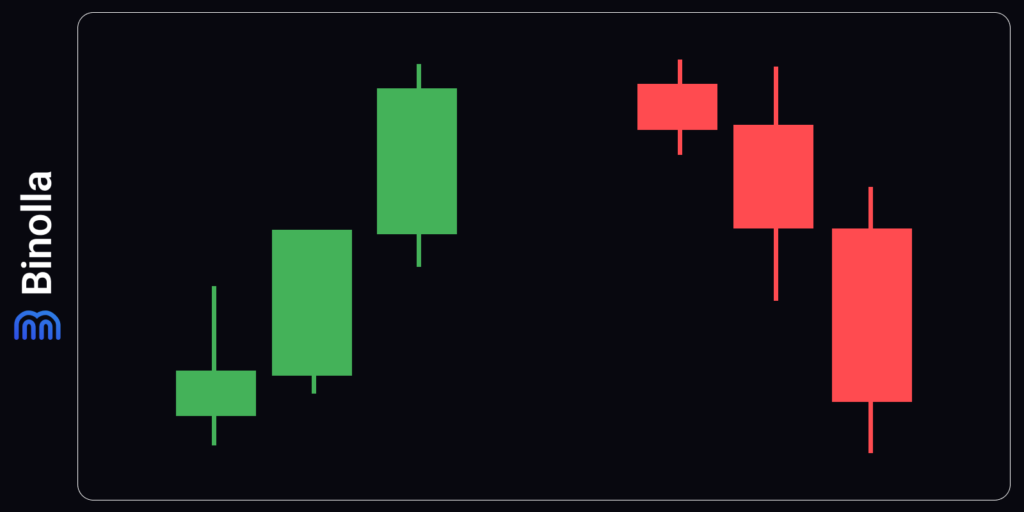
Three White Soldiers is another reversal pattern that forms after the downtrend. It includes three candlesticks that should match the following conditions:
- The first one may have a small body and wick in both directions;
- The second one should be of greater size;
- The third one should at least match the size of the second one, with small or no wicks at all.
Keep in mind that all three candlesticks should be of the same green color, meaning they should be bullish.
When it comes to Three Black Crows, this is a mirror pattern for Three White Soldiers with the following conditions to be met:
- The first candlestick should be small, with wicks in both directions;
- The second one is of a larger size;
- The third one should be at least the same size as the second one, with small or no wicks at all.
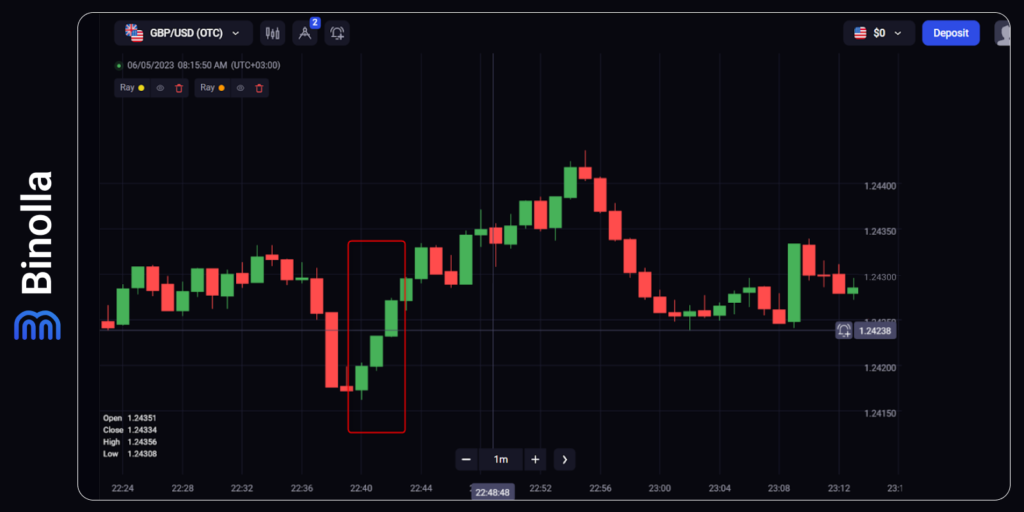
The example above demonstrates how a bullish pattern works. We have three candlesticks after a bearish trend, which meet all the conditions of Three White Soldiers. Therefore, once you meet something of a kind on the charts, you can think about buying a Higher contract or buying the currency pair.
In the situation above, we had a local uptrend, which ended and three candlesticks meet all the conditions of the Three Black Crows Pattern. You can buy a Lower contract once the third candlestick is closed, or simply sell the currency pair.
Trading with Japanese Candlestick Patterns: Tips and Recommendations
Before using this type of technical analysis in your trading routine, you should think about the following recommendations:
- Always define support and resistance levels before applying a particular candlestick pattern. Such patterns as Hanging Mand and Hammer are similar, but they should be read differently. Hammer predicts the likelihood of an uptrend, while Hanging Man tells about the possibility of the price going down.
- Avoid trading candlestick patterns without knowing the approaching macroeconomic releases. While Japanese candlestick analysis is a reliable strategy to follow, key data releases may break even the strongest and most evident patterns.
- Identify the current market state. Japanese candlestick patterns depend on current market trends. If you consider Hammer, for instance, it appears after the downtrend. Therefore, you should find market trends beforehand.
- Seek confirmations. While this analysis method is independent, it would be a good idea to add additional strategies to confirm its signals, like applying the RSI indicator, for instance, to confirm reversals.
FAQ
What are Japanese candlesticks?
Japanese candlesticks are a type of chart that displays the price movements of an asset over a period of time. They consist of a body and two shadows that show the open, close, high, and low prices of each time interval.
What are the main types of candlestick patterns?
Candlestick patterns are formations of one or more candlesticks that indicate the possible future direction of the market. There are many types of candlestick patterns, but some of the most common ones are reversal patterns, continuation patterns, and indecision patterns.
What is a reversal pattern?
A reversal pattern is a candlestick pattern that signals a change in the prevailing trend. For example, a bullish reversal pattern indicates that the price may rise after a downtrend, while a bearish reversal pattern suggests that the price may fall after an uptrend.
What is a continuation pattern?
A continuation pattern is a candlestick pattern that confirms the continuation of the current trend. For example, a bullish continuation pattern shows that the price is likely to keep rising in an uptrend, while a bearish continuation pattern indicates that the price is likely to keep falling in a downtrend.

