Hammer and Inverted Hammer Patterns: How to Catch Market Reversals with High Probability

There are a lot of trading patterns around, which allow traders to find entry points and try to predict future price fluctuations. Hammer and inverted hammer patterns are among the most popular ones as they are very simple when it comes to their identification. Moreover, they are widely spread on charts. Whatever part of the chart you take, you are likely to find at least one hammer there.
While the concept of both hammer patterns may seem straightforward, some pitfalls may await you when you start using them. Read this article to get familiar with these patterns as well as to discover some of their secrets. Learn more about how to use them in digital options, Forex, and stock trading. Delve into the basics of the hammer pattern and start trading at Binolla.
Hammer and Inverted Hammer Basics
Before delving into strategies that you can use when dealing with hammer and inverted hammer patterns, it is worth looking at the pattern itself and understanding its concept.
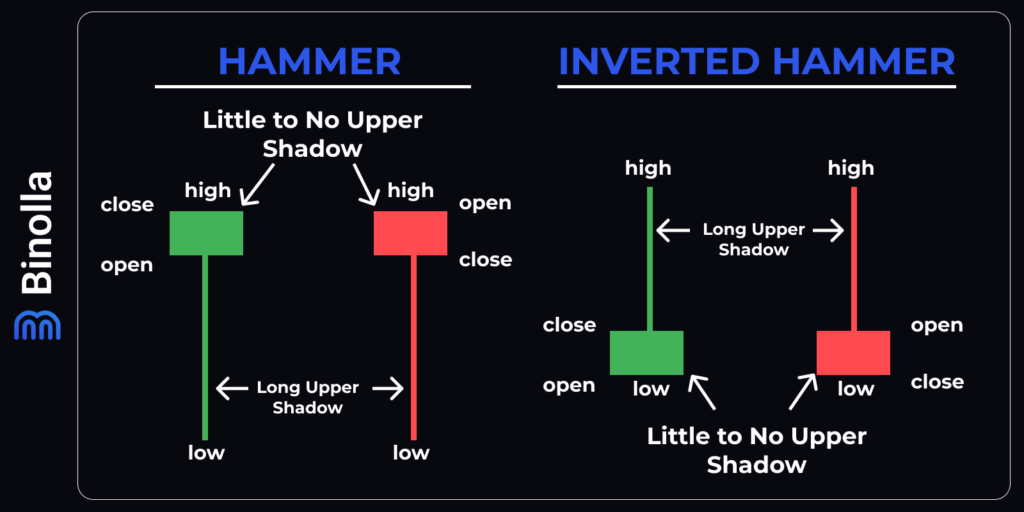
A hammer is a pattern with a small body and a long lower wick. The image above shows a classic one. A hammer candlestick can be both bullish and bearish. When it comes to the upper wick, the classic hammer pattern has none, while when you are going to meet this model on live charts, you will see some deviations, including small shadows above the body.
The inverted hammer is a mirror pattern, which means that the small body is at the bottom and the long upper shadow. Similar to the hammer, there is no lower wick here. However, when you are going to meet this pattern on real charts, some minor deviations are possible.
Now that you know the basics, it is time to watch where this pattern can be found on charts. Being a bullish reversal pattern, the hammer appears at the bottom of the market.
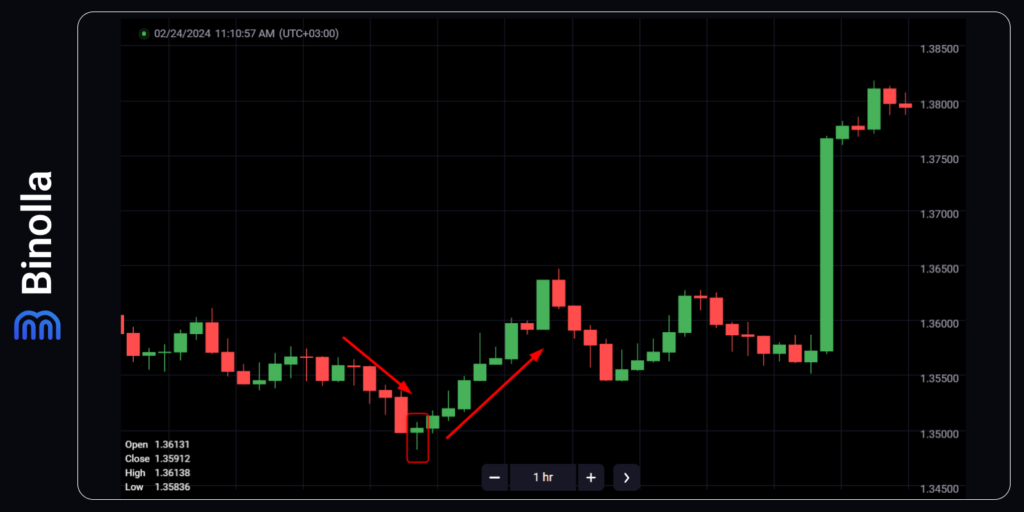
The first example is a hammer, which appears after the downtrend. As we have already mentioned, it may differ from the classic hammer pattern that we have demonstrated above. As you can see, this one has an upper wick and its lower shadow is smaller as compared to our example. However, this one is still the hammer pattern that predicts the reversal of the market.
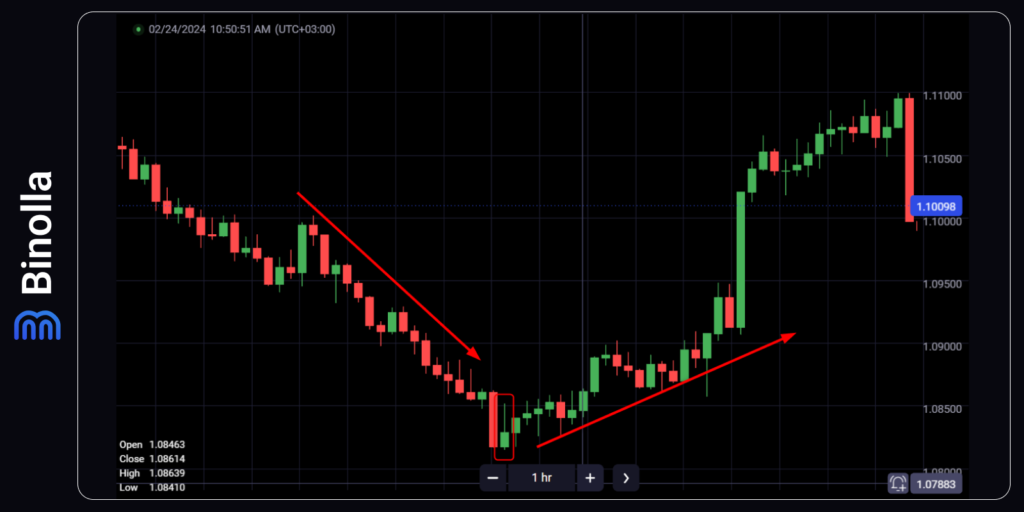
In our next example, you can see an inverted hammer, which also appears at the bottom of the market. It looks more like a classic inverted hammer pattern, but its body is a bit bigger than it should be. Anyway, if you meet such a pattern on charts, you can consider it as an inverted hammer.
Psychologic Aspect Behind Hammer
To better understand why this pattern is a reversal one, you should dive into the psychological aspect behind it. Whatever hammer pattern you meet on charts, there is one important thing behind all of them you should remember. A long shadow is an attempt to move the price lower, which is failed. Therefore, if the price fails to move in one direction, it goes in the opposite one as more and more traders join the bullish movement.
When it comes to an inverted hammer, the situation is quite the same, but this time, the attempt was to push the price higher. While it failed, market participants did not change their opinion and made other attempts to finally drag the price higher.
It may seem that we have different situations in both cases, but the thing that makes them similar is that both hammer and inverted hammer are formed on the support level. Therefore, in the case of the classic normal hammer, the market participants try to push it lower, below the support line, and fail, while in the case of the inverted hammer, traders try to pull the price from the support line, fail, but make other attempts as the support line prevents the price to go below.
Hammer vs Hanging Man
Hammer has its twin pattern, which is known as hanging man. Both look similar, but there is still a big difference between them.
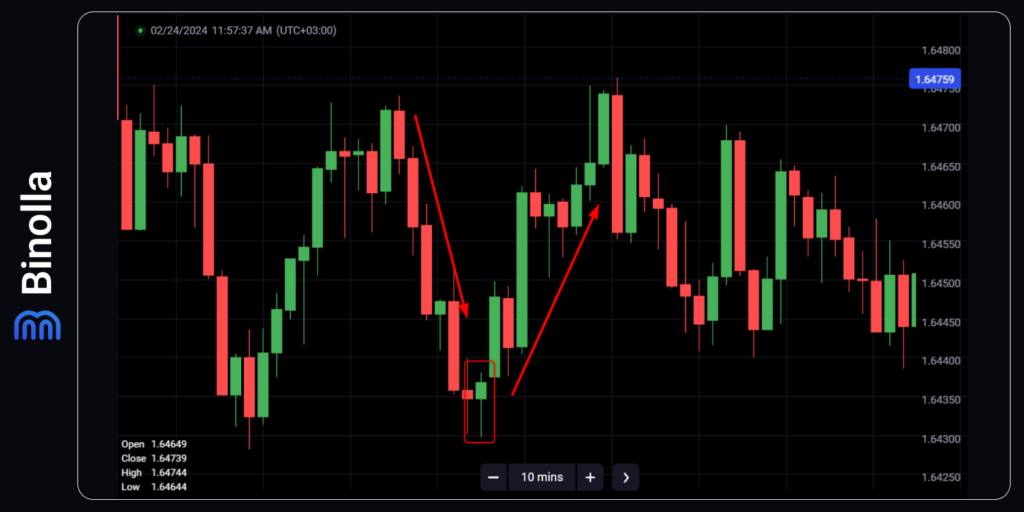
The hammer pattern appears at the bottom of the market as we have already mentioned, while the hanging man model appears at the top. Therefore, while the hammer pattern predicts a reversal from the downtrend to the uptrend, the hanging man pattern, in turn, is a signal that the uptrend is likely to come to an end, and the downtrend will follow.
Inverted Hammer vs Shooting Star
The same is true when it comes to inverted hammer and shooting star patterns. Both look similar, but they differ from each other depending on their position.
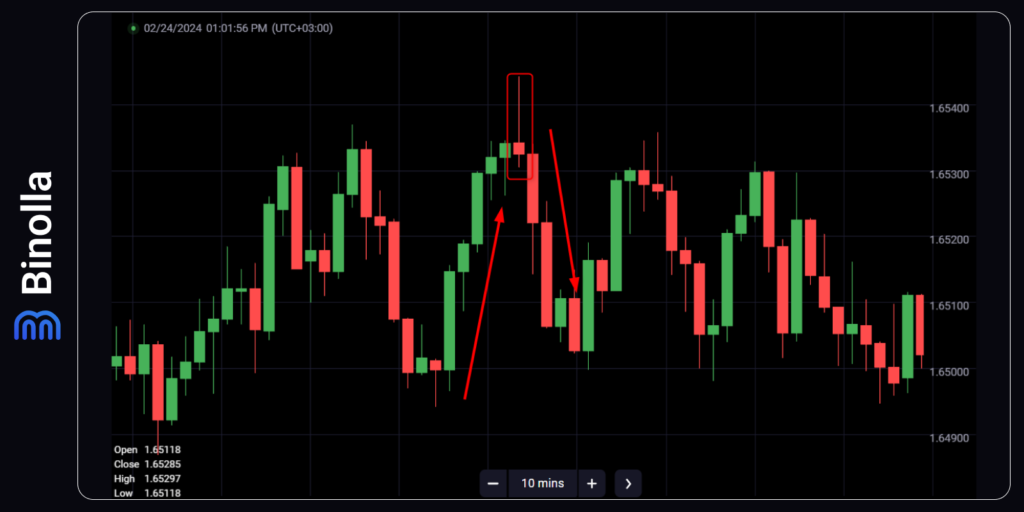
The shooting star pattern appears at the top of the market and predicts the reversal from the uptrend to the downtrend, while the inverted hammer pattern appears at the bottom and signals the reversal from the downtrend to the uptrend.
Hammer and Inverted Hammer Patterns and Digital Options
Both patterns are suitable for digital options trading. They provide clear and concise signals allowing traders to find exact entry points. If you use it to trade digital contracts, you need to simply wait for the hammer or inverted hammer candlestick to close and buy a Higher contract. When it comes to expiration, you can choose whatever you want depending on the timeframe of the chart.
Hammer and Inverted Hammer Patterns and Forex/Stock Trading
Similar to digital options, traders can use the hammer and inverted hammer patterns to find entry points. Moreover, they do it in the same way, once the pattern appears on the chart and the candlestick is closed, you can buy a currency pair or a stock. However, unlike digital options, where risks are fixed, in Forex or stock trading, you can use the hammer to set stop losses.
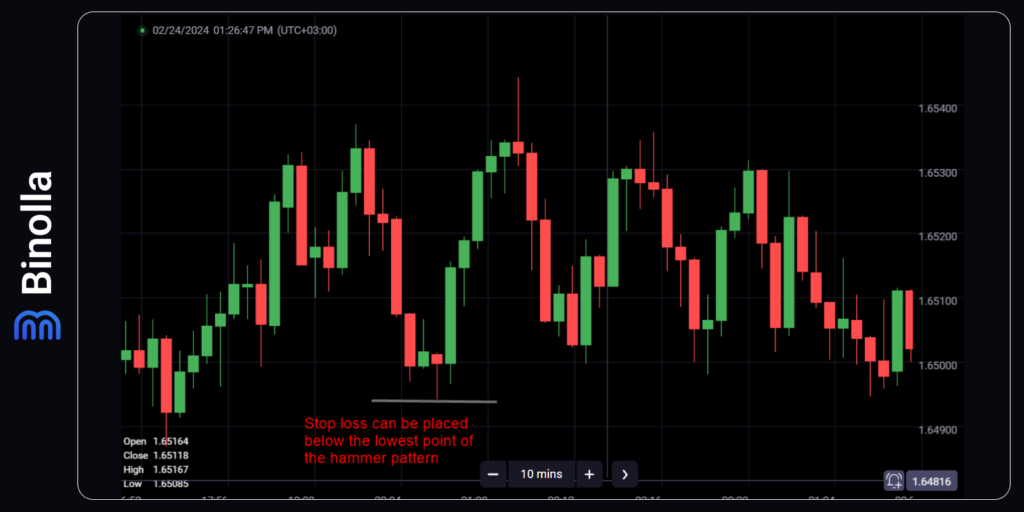
In this particular example, a trader can place a stop loss below the grey line, which highlights the lowest point of the hammer candlestick. The idea behind this is very simple. The lowest point of the hammer pattern is supposed to be the local lowest low. The price tried to move lower again as you can see by the shadow of the next green candlestick, but it failed to reach the lowest point of the hammer pattern.
Hammer and Inverted Hammer Strategies
Being among the most popular patterns, hammer and inverted hammer models are used in many strategies. Some of them are presented below.
Basic Hammer Strategy
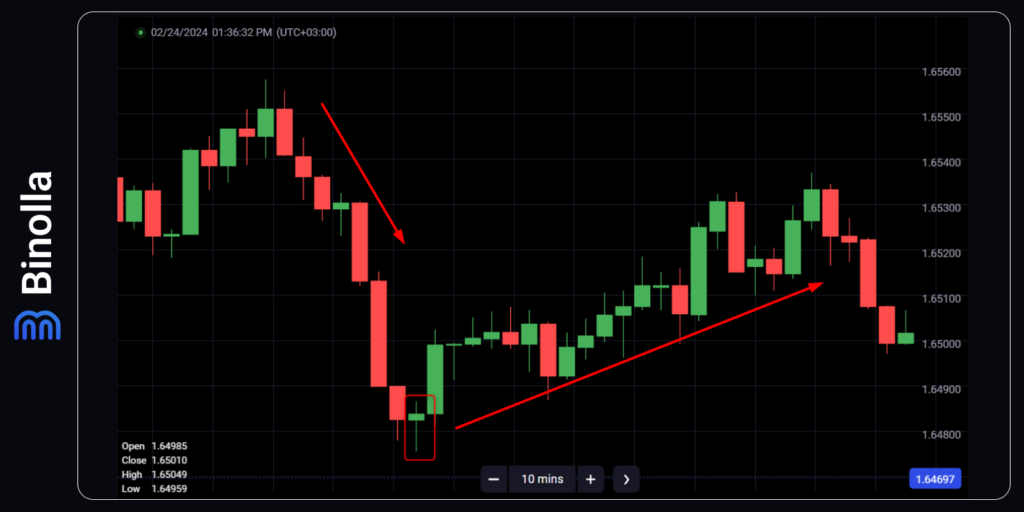
This basic strategy involves the hammer pattern which appears after the downtrend. To start trading, you need to wait until the hammer candlestick is closed and buy a Higher contract, or buy a currency pair/stock.
If you are trading Forex currency pairs or stocks, then you can place a stop loss below the hammer’s wick.
Bladerunner Hammer Strategy
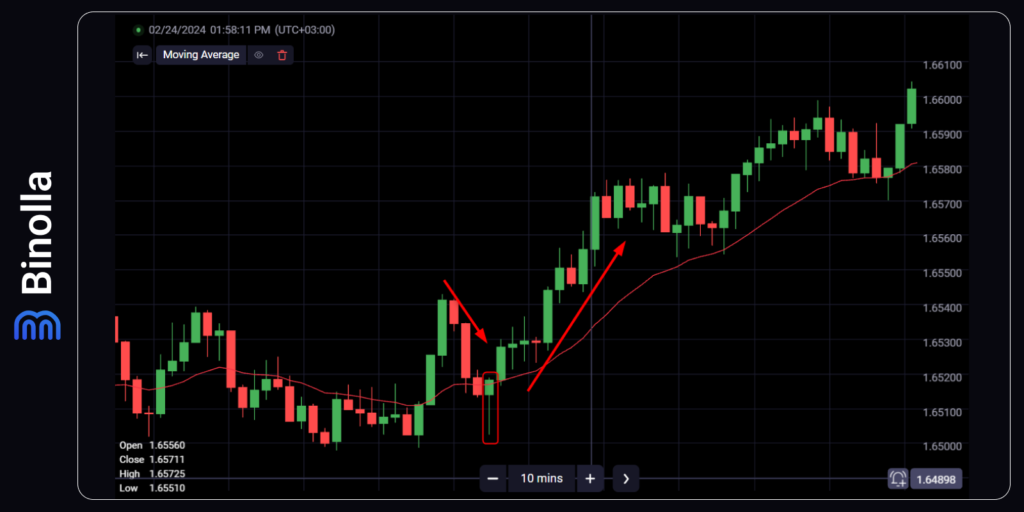
The famous Bladerunner strategy involves buying when the price retests the 20 EMA from above. When it comes to the hammer pattern, if you have it formed close to the 20 EMA or even piercing it, then it is a signal for a trader to buy a Higher contract or purchase a currency pair/stock. The idea behind this strategy is that the exponential moving average plays the role of dynamic support. When a hammer pattern appears on this curve, then you can buy the asset.
A Hammer Strategy with Bollinger Bands
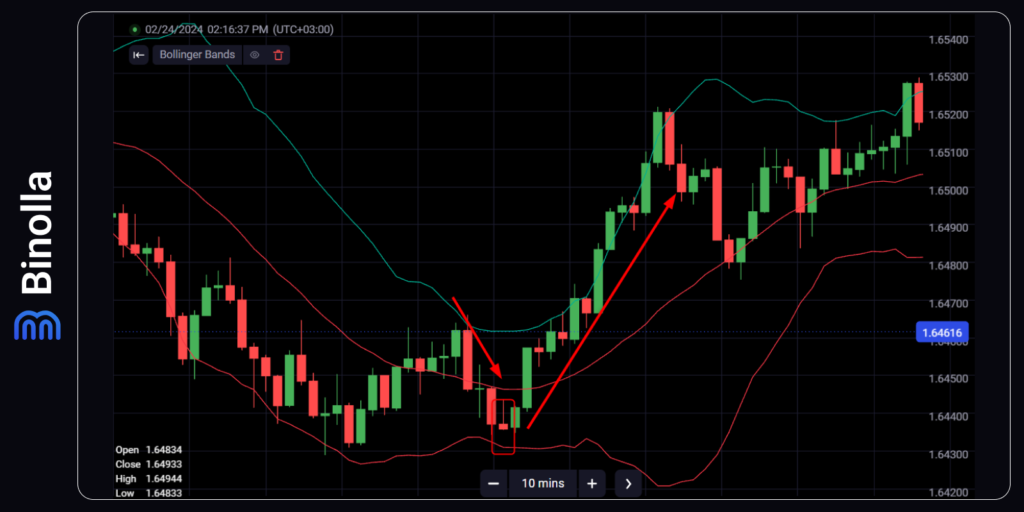
This basic strategy involves the Bollinger Bands indicator and the inverted hammer pattern (or a classic hammer). If you see that the pattern appears close to the lower band of the indicator (or even touches it/pierces it), then you can buy a Higher contract or simply buy a currency pair/stock.
Hammer and Inverted Hammer Patterns Recommendations
To augment your trading with the hammer and inverted hammer patterns, you can follow some useful recommendations. Find some of them listed below:
- Confirm the hammer or inverted candle hammer pattern with other technical indicators or chart patterns to increase the likelihood of a successful trade.
- Look for hammer patterns in conjunction with oversold conditions on indicators like the RSI or Stochastic oscillator for stronger confirmation.
- Consider the volume accompanying the hammer or inverted hammer pattern, as a higher volume can validate the signal and increase its reliability.
- Use a combination of multiple timeframes to identify hammer and inverted hammer patterns for better entry and exit points.
- Place stop-loss orders below the low of the hammer pattern in bullish trades and above the high of the inverted hammer pattern in bearish trades to manage risk.
- Take profit targets based on key support or resistance levels, Fibonacci retracement levels, or previous price swings when trading hammer or inverted hammer patterns.
- Monitor the overall market trend to ensure that the hammer or inverted hammer pattern aligns with the broader market direction for higher probability trades.
- Practice patience and wait for confirmation of the hammer or inverted hammer pattern before entering a trade, avoiding premature entries.
- Consider using price action analysis in conjunction with hammer and inverted hammer patterns to gain additional insights into market sentiment and potential price movements.
- Keep a trading journal to track the success rate of hammer and inverted hammer patterns in your trading strategy and make adjustments based on your observations over time.
FAQ

What is the significance of the long lower shadow in a hammer pattern?
The long lower shadow in a hammer pattern indicates that buyers were able to push the price higher from the lows of the session, suggesting a potential bullish reversal.
How does the body of a hammer pattern compare to its shadows?
The body of a reversal hammer pattern is typically small and located at the top of the price range, while the long lower shadow extends below the body, emphasizing the buying pressure.
In what market conditions are hammer patterns most effective?
Hammer patterns are most effective when they occur at the bottom of a downtrend, signaling a potential reversal to the upside as buyers step in to support the price.
What does an inverted hammer pattern suggest about market sentiment?
An inverted hammer pattern at the top of an uptrend suggests that sellers attempted to push the price lower but were unsuccessful, potentially signaling a reversal from bullish to bearish sentiment.


