Flag Pattern for Successful Trading: How to Use Price Corrections

The flag pattern is among the most popular price patterns so far. When you find one on the charts, you can expect the trend to continue after a short consolidation. In general, the flag pattern is used by traders to find entry points along the main trend.
Flags can be used by all types of traders. Whether you are buying digital options or trading Forex currencies/stocks, you will be able to find entry points.
There are two types of flags in trading. One that appears somewhere in the middle of the uptrend, which is also known as the bullish flag, and another, that is formed during the downtrend, which is known as the bearish flag. By reading this article, you will find out more about flags in trading, their main features as well as some basic strategies that will allow you to use flags in your everyday trading routine. Create an account on the Binolla platform and start trading with flag patterns.
Contents
Flag Pattern Basics

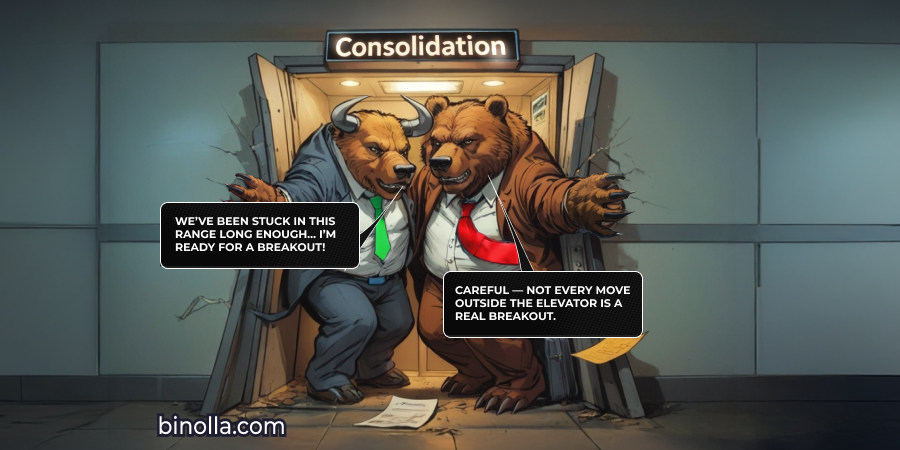
Flag patterns appear after a trend movement (mostly sharp ones). This movement is known as flagpole. A flag itself is a brief pause between the two trend movements. As you may probably know, trends, especially sharp ones, always have a moment of relief or consolidation, when those who traded along the first part leave the market, while the others still add positions. Once this consolidation is over, the trend resumes.
There are two types of flags that you can find on charts. The first one appears in between two uptrend movements. Such patterns are known as bullish flags. Once you find them on charts, you can expect the price to resume the uptrend after a while.
When it comes to bearish flags, they appear after a sharp downside movement. Once an upside consolidation begins, you can outline such a pattern on the chart and wait until the downtrend resumes.
The key moment in trading flags is to wait for a breakout. For bullish patterns, traders can buy an asset or purchase a Higher contract once the price breaks the upper line, while for bearish flags, signals come when the price breaks the lower line of the rectangle.
Key Characteristics of Flag Patterns
Successful flag pattern trading is impossible without knowing its main parts and features. Whatever type of flag pattern you use for trading, you should know about the following aspects:
- The main trend. Being a trend-continuation pattern, a flag appears during a strong directional price movement. Therefore, even before you can say that there is a pattern on the chart, you should identify a directional price momentum or gradual price growth first. For the bullish flag, it should be a preceding uptrend, while for the bearish one, a strong downtrend movement should be on the charts. The first trend movement, that precedes the flag formation is known as “pole”;
- Consolidation. Another key feature of flag patterns is consolidation or price correction. Traders draw a rectangle that encompasses such price consolidation to prepare themselves for trading. One of the key features of the classical notion of flags is that the price within such rectangles should move on the opposite side of the main trend. However, When you identify flags on charts on your own, you will see that sometimes the consolidation will be sideways;
- Declining trading volumes. One of the key characteristics of flag patterns is a drop in volumes. This is due to the fact that the consolidation itself is a moment when the price pauses for a while. Some traders have already sold the asset, while others still add their positions. Once the flag pattern starts working, volumes are high again;
- A breakout concept. One of the key concepts of trading flags is that a breakout should occur. For bullish flags, the price should break the upper line of the rectangle, while for bearish ones, the lower line of the flag should be broken by the price. This is the main rule that you should remember about this pattern as it defines entry points.
Examples of Flag Patterns on Charts
Now that you know the basics of flag patterns, it is time to delve into their examples and see how flags may look when they appear on charts. First, let’s take a look at the bullish formation.

The pattern that we have outlined in the first example is a classic flag with a relatively long pole and a clear consolidation movement that goes in the opposite direction to the main uptrend. As you can see, the price starts the uptrend at some point and, after a while, it stops and goes in the opposite direction. Once the consolidation, which is highlighted with a blue rectangle is over, the uptrend resumes.

Another example of a flag pattern can be seen in the chart above. While the downtrend is not as sharp as in the previous example, we can still find a flag pattern there. After a long downside movement, the price makes a brief consolidation, which ends with a breakout, and the downtrend resumes.

Traders can switch to line charts to find flags. In some cases, this is the best option as the line chart offers pure price without abundant information. As you can see, there is a strong downside momentum before the correction begins. Later, a consolidation starts and the price goes in the opposite direction. Once the lower line of the flag pattern is broken, the downtrend resumes.

Now we are going to consider one more example of the flag pattern that you can find on line charts. This time, the price makes a sharp upside movement. Later, a consolidation starts. After this correction ends, the price breaks the upper line of the rectangle to continue the uptrend.
Broken Flag Patterns
Not all patterns of this type lead to the trend continuation. In some cases, the price goes in the opposite direction, which means that the formation is broken and you should avoid trading at such moments. Here are a couple of examples, which shed light on such situations.

The first example of the broken flag demonstrates the pattern that you shouldn’t use in trading. There is a strong uptrend and a consolidation after it. However, instead of breaking the upper line, the price breaks the lower one and an opposite trend begins. If you encounter such a situation on your charts, then you should skip such flag patterns and find other ones that work.

The next example shows another broken flag pattern, but this time, the downtrend precedes it. After a sharp downside movement, we have a consolidation. The flag is outlined, but instead of going down, the price leaves it through the upper line, which means that the formation is broken and you can’t rely on it in trading.
Flag Trading Strategies
Now that you know the basics of these patterns, let’s take a closer look at the basic strategies that you can apply when using flags.

The first strategy allows traders to buy Higher contracts or to purchase a currency pair/stock. The idea behind it is very simple. You need to identify a bullish flag first. You can do it by looking for parts of the chart where there was a strong upside movement and a consolidation. Next, you need to wait for the candlestick to leave the flag by breaking the upper line. Once it happens, wait again for the signal candlestick to close. After all these phases are completed, then you can buy a Higher contract or purchase a currency pair/stock.

Try trading with the flag pattern now!
Create an account on the Binolla platform and use the flag pattern now
Sign upSome traders buy once the price breaks the upper line. This strategy can also be used, but it is risky as you don’t know whether there will be a breakout before the candlestick closes. When it comes to line charts, you can start trading after the breakout takes place as there are no additional confirmations when you deal with lines.

Now let’s consider the opposite situation when the downtrend is paused by an upside correction. To buy a Lower contract or to sell a currency pair/stock, you need to wait until a candlestick breaks the lower line of the flag pattern and closes below it. Once it happens, you can start trading.
Flag Patterns in Trading: Video Guide
Flag Patterns Recommendations
Traders can add flags to their trading arsenal and use them when they want to make money on trend continuation. Here are some key recommendations that you may consider before you start using such a formation:
- Understand flag patterns. Before trading flag patterns, ensure a solid understanding of what flag patterns are. Flags are continuation patterns that indicate a brief consolidation before the prevailing trend resumes;
- Identify strong directional price movements. The best flag patterns appear after strong and even sharp directional price movements. Therefore, you should be able to identify them before considering any flag formation;
- Make a difference between bullish and bearish flags. The first appears after an upside price movement, while the second is formed after a downside trend;
- Consider flagpole length. The length of the preceding flagpole (the initial strong move) can provide a target for the potential continuation of the trend after the breakout from the flag pattern;
- Wait for confirmation. Patience is key. Wait for confirmation of the breakout from the flag pattern before entering a trade. False breakouts can occur, so it’s essential to ensure that the price movement is sustained.
FAQ

What is a flag pattern in trading?
A flag pattern is a technical analysis chart pattern that represents a temporary consolidation or pause in the prevailing trend. It consists of two parallel lines – a trendline (flag) and a flagpole, indicating a strong price move before the consolidation.
How can traders differentiate between a bullish and bearish flag pattern?
Bullish flags slope upward and are usually seen in an uptrend, indicating a potential continuation of the upward movement. Bearish flags, on the other hand, slope downward and typically occur in a downtrend, signaling a possible continuation of the downward trend.
Why is volume analysis important when trading flag patterns?
Volume analysis is crucial as it provides insights into the strength of the flag pattern. During the consolidation phase, decreasing volume suggests a contraction of volatility, while an increase in volume during the breakout confirms the potential for a strong continuation of the trend.
What role does the flagpole length play in trading flag patterns?
The flagpole length, representing the initial strong move before the flag pattern, serves as a reference for setting price targets. Traders often use the length of the flagpole to estimate the potential distance the price may move after the breakout from the flag, helping in setting realistic profit targets.