EUR/USD Is Under Pressure as USD Is Gaining Strength Again

The EUR/USD pair remains in the red zone near the 1.0700 level, as it is affected by a broad rebound of the US Dollar and a somewhat mixed market sentiment early on Tuesday. Despite a rebound in Germany’s Retail Sales, the Euro fails to gain traction ahead of significant releases of Eurozone inflation and GDP data.
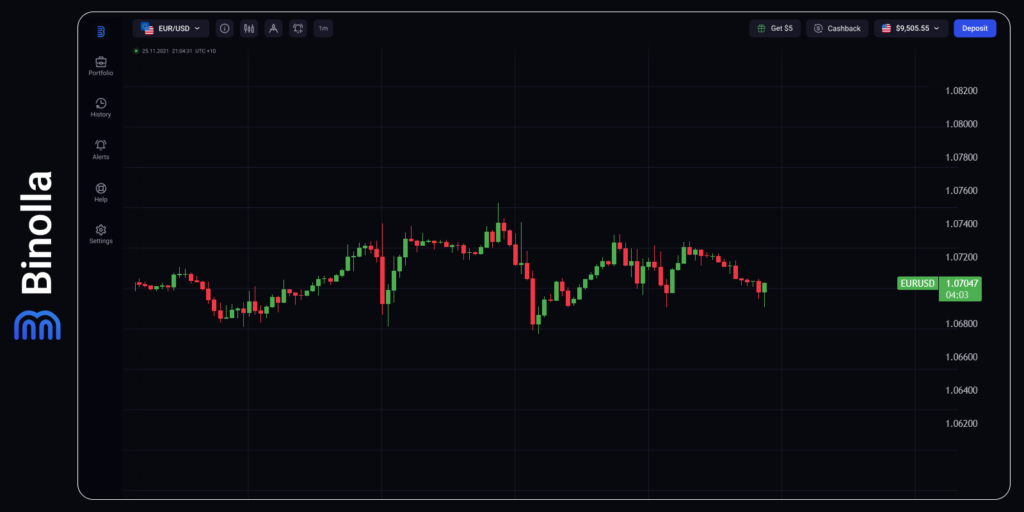
On the upside, the EUR/USD pair is anticipated to encounter its first resistance at the significant 200-day SMA level of 1.0803. This is followed by further resistance levels, including the April peak of 1.0885 (April 9), the March high of 1.0981 (March 8), and the weekly top of 1.0998 (January 11), all preceding the psychological barrier of 1.1000.
However, a downside move could be prompted by a breach of the 2024 low at 1.0601 (April 16), potentially indicating a return to the November 2023 low of 1.0516 (November 1). Subsequently, traders may look towards the weekly low of 1.0495 (October 13, 2023), followed by the 2023 bottom of 1.0448 (October 3), with a possibility of testing the round milestone of 1.0400.
In the 4-hour chart, a consolidative mood prevails for the time being. Initial resistance is observed at 1.0752, followed by the 200-SMA at 1.0775. On the other hand, early support is provided by the 55-SMA at 1.0679, ahead of key levels at 1.0601 and 1.0516. The Relative Strength Index (RSI) has dipped below 56, indicating a neutral sentiment.
GBP/USD Remains Under Pressure Due to USD Rebound
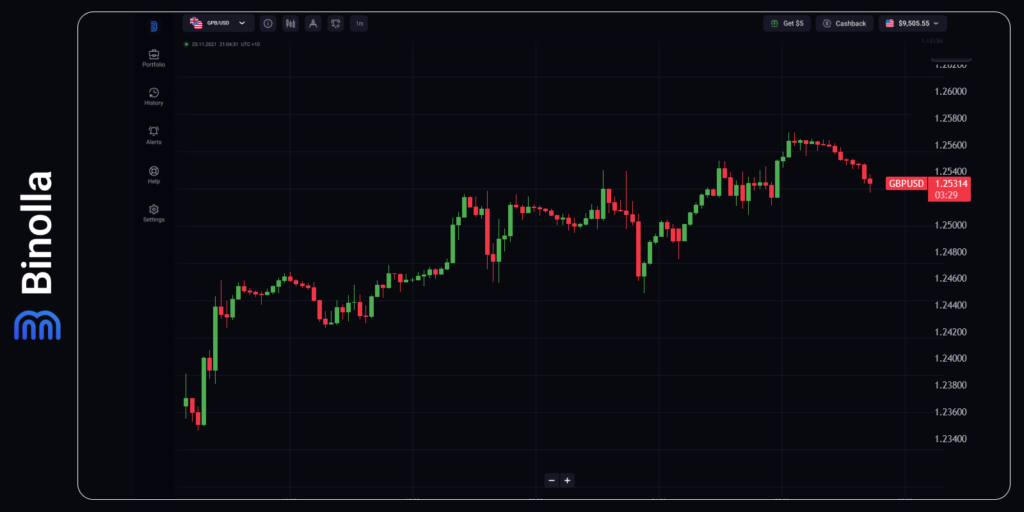
In European trading on Tuesday, GBP/USD is seeing further declines toward the 1.2500 level. The pair is weighed down by a cautious risk tone and a notable rebound in the US Dollar. With a light economic calendar in the UK, attention now turns to mid-tier US data releases.
On the 4-hour chart, the Relative Strength Index (RSI) indicator remains near the 60 mark, indicating ongoing strength. GBP/USD is holding above the 100-period Simple Moving Average (SMA) at the key level of 1.2500. Looking at potential price movements, resistance is anticipated at 1.2530, which corresponds to the Fibonacci 38.2% retracement level of the recent downtrend.
Further resistance is found at 1.2560, coinciding with the 200-day SMA. A daily close above this level could attract buyers, potentially leading to a move higher toward 1.2600. On the downside, initial support lies at the 1.2500 level, marked by the 100-period SMA. Subsequent support is seen at 1.2450, representing the Fibonacci 23.67% retracement level and the 50-period SMA.
Gold Continues to Grapple with the $2,330 level, with Attention Now Turning to the Upcoming Fed Decision
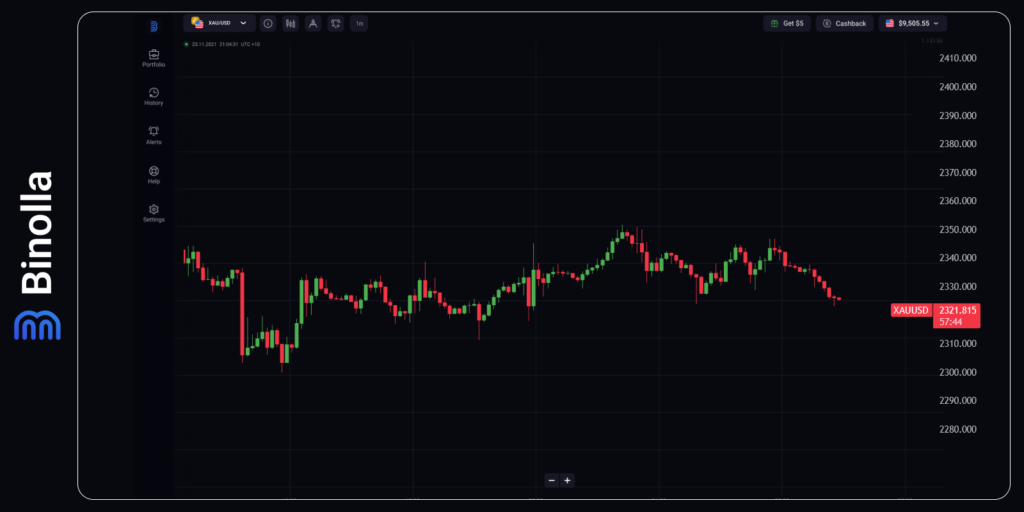
Monday saw gold prices closing below the critical 21-day Simple Moving Average (SMA), settling at $2,336. Early on Tuesday, amidst extended weakness, the precious metal once again tests the rising trendline support at $2,330. Should sellers solidify their position below this level on a daily closing basis, it may signal the beginning of a fresh downtrend toward the 50-day SMA at $2,212.
However, potential support awaits at the previous week’s low of $2,291 and the psychological level of $2,250. Despite a downward trend in the 14-day Relative Strength Index (RSI), which remains above the midline, the bearish momentum in gold prices may be constrained. On the upside, reclaiming the 21-day SMA support-turned-resistance will initially pose a challenge, followed by resistance at the previous week’s high. Further upward movement could target the $2,370 round level and the April 22 high of $2,392.
The Price of Bitcoin Remains Trapped within a Range
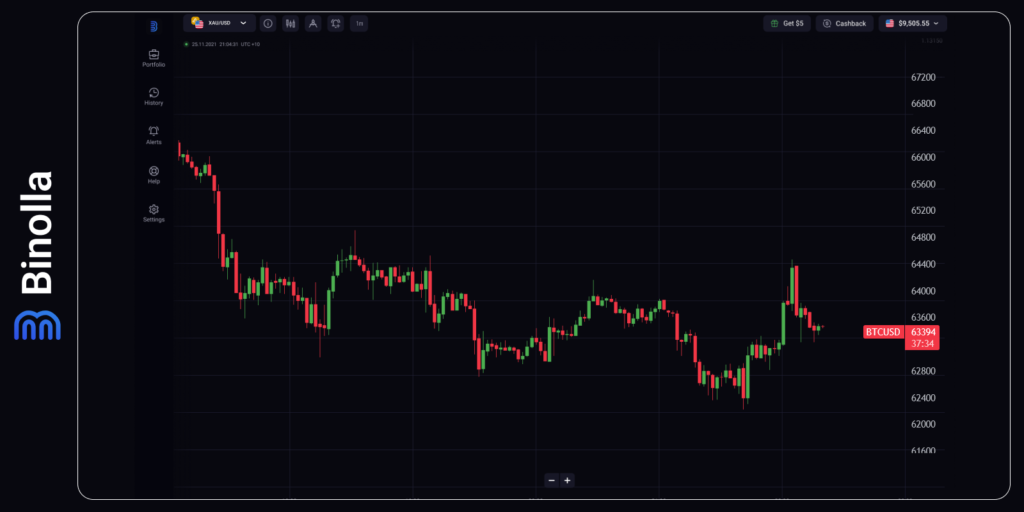
The latest weekly close has solidified the $65,600 level as a formidable resistance for Bitcoin, leaving the cryptocurrency ensnared between two critical thresholds: $65,600 to the upside and a liquidity pool below, residing within the range of $60,600 to $59,005. Forecasts lean towards further downside potential in the short term.
Observing the Relative Strength Index (RSI), a downward trajectory suggests diminishing buying pressure, signaling a growing bearish sentiment, particularly as it dips below the pivotal 50 mark. This sentiment is echoed by the Awesome Oscillator (AO) indicator, with its red histograms in negative territory underscoring the prevailing bearish sentiment.
According to the volume profile, bullish activity may only materialize once Bitcoin retraces to the $50,000 level, as indicated by the presence of volume spikes near this psychological threshold.
Heightened selling pressure could prompt Bitcoin to test the liquidity pool between $60,600 and $59,005, with potential further downside if this level fails to provide adequate support, potentially leading to a descent towards $50,000.
Conversely, a resurgence in buying interest could facilitate a recovery in Bitcoin’s price. Establishing the weekly close above $65,600 as support would be a positive development, yet a definitive breach above $72,000 would be necessary to nullify the bearish outlook and signal bullish momentum.
In an optimistic scenario, Bitcoin could retrace to its previous peak of $73,777, potentially paving the way for a new all-time high. Notably, the inverse correlation between Bitcoin and the DXY Compare indicator suggests a potential reversal in Bitcoin’s price trajectory, mirroring historical patterns.
Overall, the interplay between key technical indicators and market dynamics paints a nuanced picture, with potential opportunities and challenges ahead for Bitcoin traders and investors.
USD/CAD Edges Higher Above 1.3650 Before Canadian GDP Release
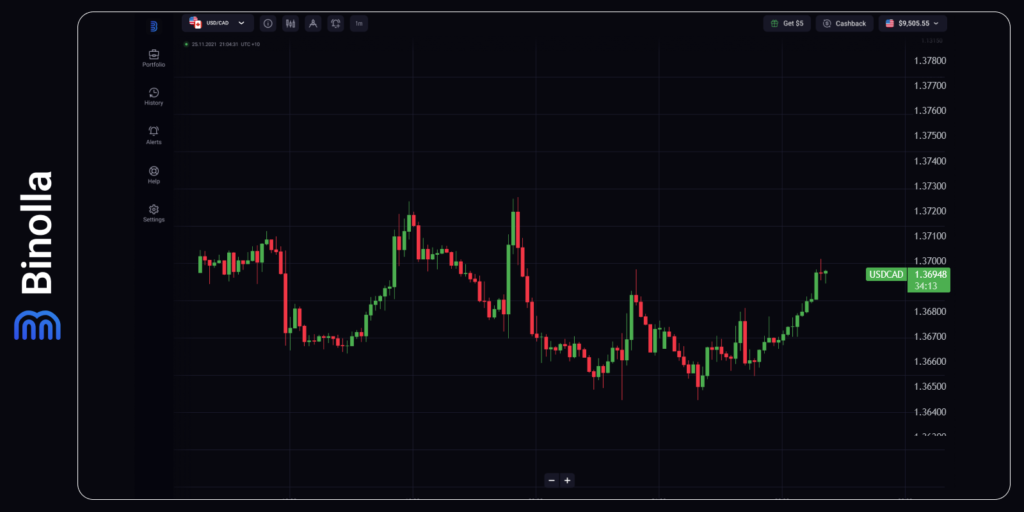
During early Asian trading hours on Tuesday, the USD/CAD pair sees slight gains around 1.3665, supported by a modest rebound in the US Dollar (USD) and pressured by declining oil prices affecting the commodity-linked Loonie. Market attention shifts towards Canada’s February Gross Domestic Product (GDP) growth figures, with investors eager to gauge economic performance. Furthermore, anticipation builds for the Federal Open Market Committee’s (FOMC) interest rate decision scheduled for Wednesday.
Amidst speculation regarding the US Federal Reserve’s (Fed) monetary policy, policymakers express reluctance to lower rates, citing potential inflationary risks. This sentiment, coupled with the notion of maintaining current rate levels or even hiking them in certain scenarios, bolsters the USD against its Canadian counterpart.
The upcoming FOMC meeting is anticipated to maintain interest rates within the current range of 5.25%–5.50%. Investors closely monitor the tone of the FOMC statement and subsequent press conference for clues on future policy direction. A hawkish stance could bolster the USD further, while a dovish outlook may exert downward pressure.
Regarding the Loonie, expectations suggest the Bank of Canada (BoC) may delay rate cuts until June or July, pending economic data. Weakness in February’s GDP figures could prompt earlier rate adjustments, influencing CAD performance. Additionally, declining oil prices, given Canada’s status as a major crude oil exporter to the US, may further weigh on the Loonie.


