Channel Pattern Trading: How to Identify and Use Bullish and Bearish Channel Patterns

Price channels are widely used by professional traders for many reasons. The most important one is that they allow market participants to see the market perspective and have an opportunity to open positions in both directions, along the current trend and during reversals.
Similar to many other useful technical analysis tools, channel pattern trading can be applied to various markets, including Forex, commodities, stocks, and cryptocurrencies. Moreover, this method works across various timeframes, which, in turn, allows you to apply it to all existing strategies from scalping to position trading. By reading this article, you will learn the basics of bullish and bearish channel patterns as well as how to use them in your trading sessions.
Ready to place your first trade? Join Binolla and start trading with a trustworthy and reliable brokerage company.
Contents
- 1 Key Takeaways
- 2 What Is Channel Pattern Trading?
- 3 How to Add Channels on the Binolla Platform
- 4 The Main Types of Channel Trading Patterns
- 5 Identifying Channels in Trading: A Step-By-Step Guide
- 6 Try using channel with Binolla!
- 7 Technical Indicators to Use Instead of Drawing Channels
- 8 Trading within the Bullish Channel
- 9 Trading within the Bearish Channel
- 10 Breakout Trading
- 11 Common Mistakes to Avoid When Trading with Channel Pattern Strategies
- 12 Conclusion
- 13 FAQ
Key Takeaways
- Channel pattern trading allows you to find entry points along the directional price movement or during sideways.
- There are three main types of channels in trading: bullish, bearish, and range.
- Traders can place orders within a channel or trade breakouts.
- When trading channels, market participants should watch the global context.
- By using channels, traders can not only find entry points but also use various risk management strategies.
What Is Channel Pattern Trading?
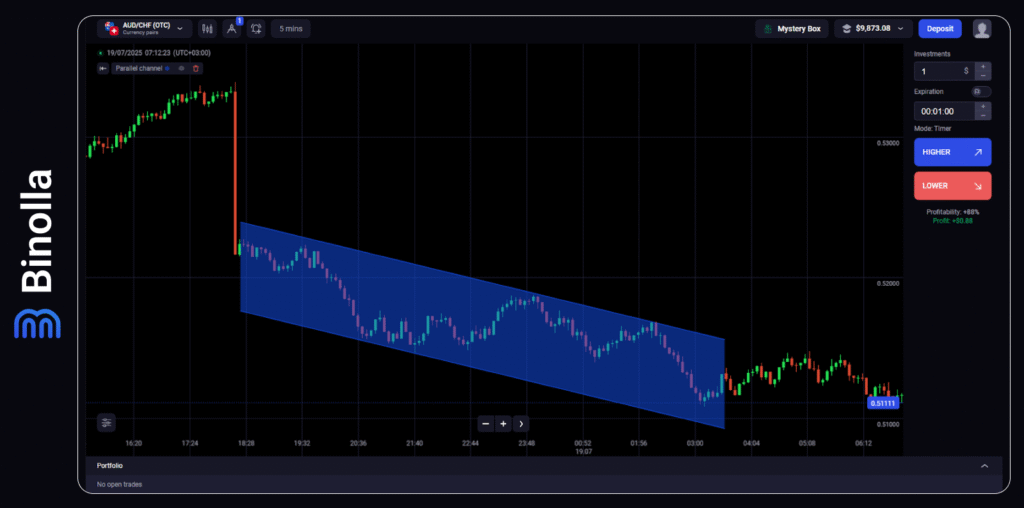
Before delving into some strategies and methods, it is worth looking at the basics of channel pattern trading. This formation occurs when the price of a financial asset fluctuates between two parallel lines. This pattern includes the following parts:
- The lower line (support) is drawn through higher lows or lower lows, depending on the type of channel.
- The higher line (resistance) is drawn through the higher highs or lower highs, depending on the type of channel.
The key features of such channel patterns in trading include:
- Both lines should be parallel to each other. While a slight angle between them is acceptable, the structure must resemble a channel formed by two parallel lines.
- The slope of the channel indicates the direction of the trend. If both lines are formed by higher highs and higher lows, the channel is bullish, while if the channel is formed by lower highs and lower lows, then the channel is bearish.
- Several touches. There should be at least a couple of touches of the lower and upper lines for the channel to be considered valid.
By using the channel pattern trading method, you can better visualize the current price movement direction and find entry points. Moreover, this method allows you to identify the key risk and reward zones where you can place stop loss and take profit orders. The example above is drawn using a ready-made channel tool that is available on the Binolla platform.
How to Add Channels on the Binolla Platform
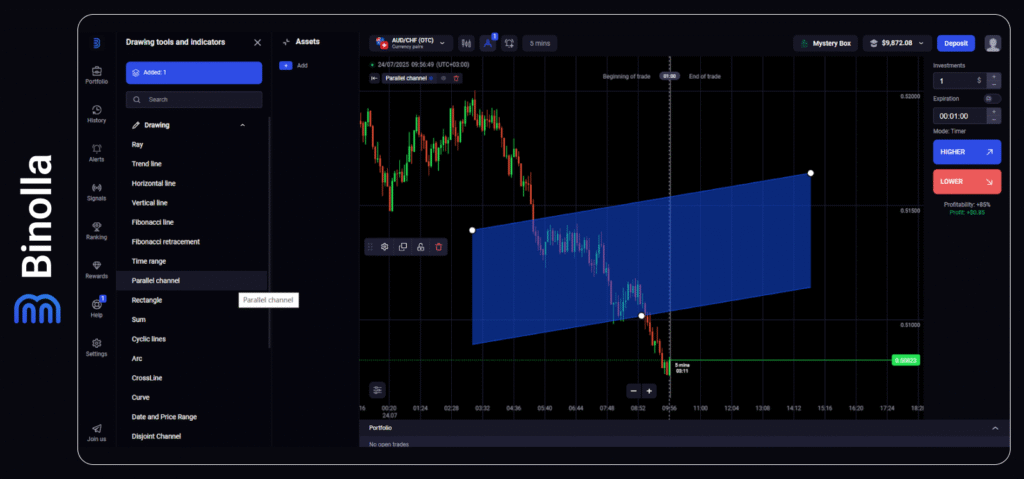
To add the drawing tool to the Binolla platform, you need to do the following:
- Click the tool icon at the top of the platform.
- Open the Drawing menu on the left side of the trading terminal.
- Browse down to find Parallel Channel there.
- Click on this menu.
The channel appears on the chart. Now you need to drag the dots to apply it to any channel on the chart.
The Main Types of Channel Trading Patterns
There are three key types of channel pattern trading: bullish, bearish, and sideways. All of them allow market participants to find entry and exit points that are based on the structure and psychological aspects. Let’s delve deeper into each of them.
Bullish Pattern in Trading
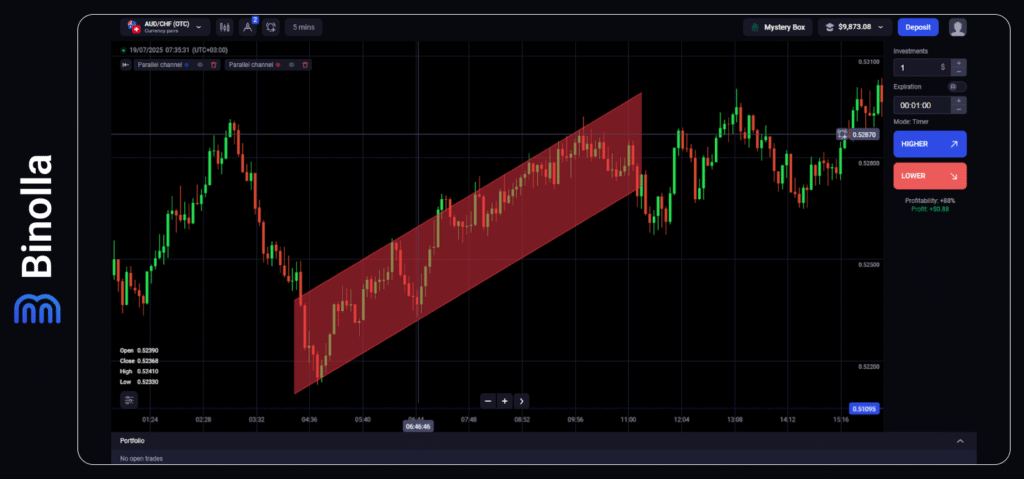
A bullish channel occurs when the price sets new higher lows and higher highs. The price does not move in a single direction. After setting a new higher low, it moves to the upper band of the channel and reverses there. After a couple of such touches, you can draw a channel. The lower band is drawn through the ascending lows, while the upper one is drawn through the ascending highs.
This channel pattern in trading shows the bulls are controlling the market. However, bears are trying to change the situation when the price reaches the upper boundary of the ascending channel. The strength of the directional movement is confirmed by new higher lows and higher highs.
Bearish Channel in Trading
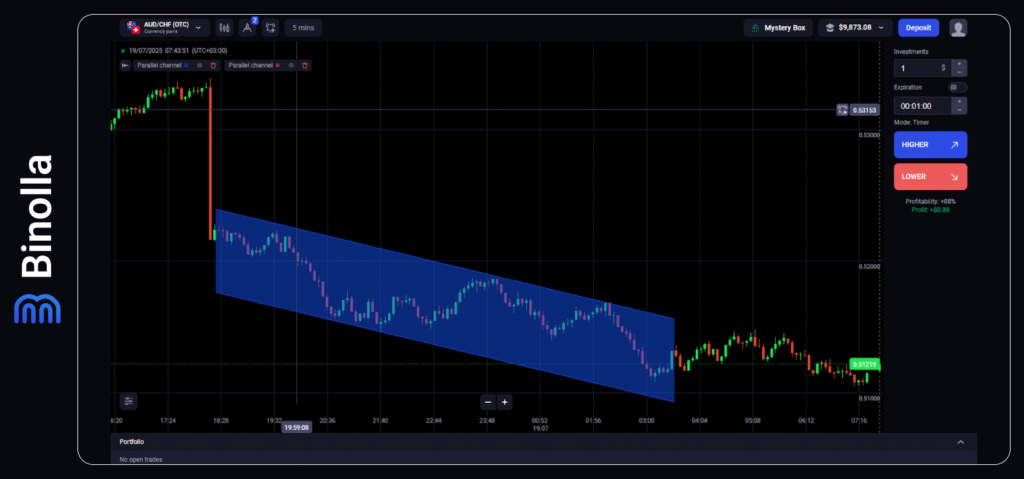
A bearish channel pattern in trading is drawn through lower highs and lower lows. As you can see, it is formed when the market is in a downtrend. The price is bouncing between the two descending lines. The upper boundary is the downside trendline, while the lower one connects the lower lows.
This formation shows that bears have total control over the market. When the price reaches the upper line of the pattern and then bounces off it, sellers confirm their domination. Bulls are trying to overtake at the lower line, but they failed.
Horizontal Trading Channels
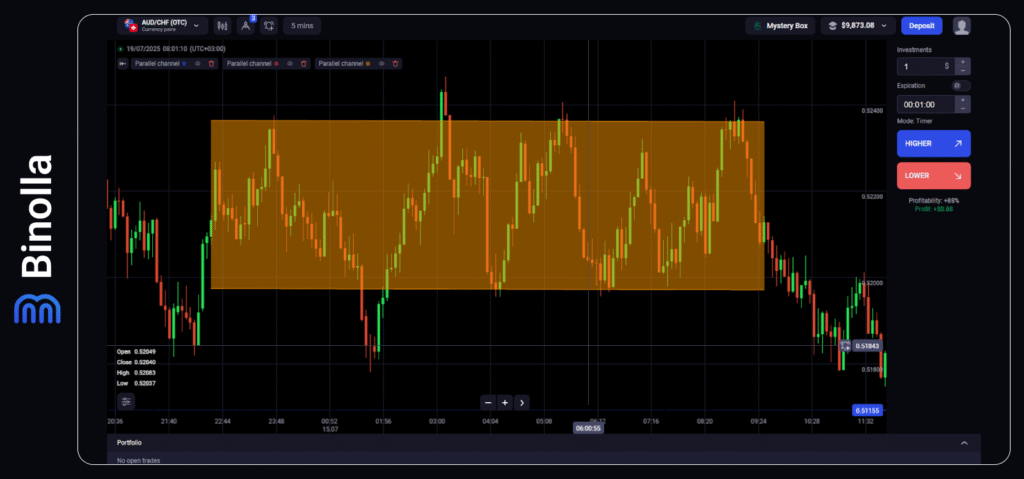
A horizontal trading channel forms when lows and highs do not show any clear direction. This can occur during periods of consolidation. The support line is drawn through lows, while the resistance line is drawn through highs. Both are flat, which means that there is a balance between sellers and buyers, and neither side is controlling the market.
This pattern demonstrates market indecision. Neither side can push the price out of the range, which means that there is a pause until one of the sides regains control.
Identifying Channels in Trading: A Step-By-Step Guide
Knowing how to identify and draw channels is essential if you are going to use these patterns in trading. While it may seem complex, by grasping some basic components, you will be able to build your own channels and benefit from these formations. Here is how to recognize price channels in trading.
1: Spot the Trend
The first step that you should take is to identify the current price movement direction. To do it, simply look at the chart and watch the price movement direction. If the price is setting higher lows, then buyers are in control at the moment. On the other hand, if you see lower highs, then bears are dominating the market. Finally, if highs or lows are equal, there is no clear direction, and such a formation is known as a range.
For better visualization, traders can use candlestick charts or even lines. If you use candlesticks, you can either check open/close prices as well as tops/bottoms of the wicks.
2: Draw the Trendline
The trendline should be drawn through highs or lows, depending on its direction. For the upside trendline, you should draw it through higher lows. When it comes to the descending one, it is drawn through lower highs. When it comes to range markets, you can draw the line through both lows and highs.
3: Adding the Parallel Line to Create a Channel
After drawing the trendline, you should create another parallel line to form a channel. In the uptrend, the parallel line should be built above the trendline, while in the downtrend, the parallel line should be drawn below the trendline.
When adding the line, you should make sure that both are parallel. In real trading, a slight angle between them can exist. If the angle is more evident, then instead of the channel, you may deal with a triangle or wedge.
4: Validity Confirmation
The channel pattern in trading should be confirmed before you start using it. It is required that a channel have at least a couple of touches before placing a trade. Thus, the price should touch each boundary at least two times. Moreover, you should also have a visual confirmation of the pattern, which means that the quotes should move within the channel. Avoid situations when the price moves outside boundaries, or do not react to them.
5: Use Technical Indicators for Confirmation
Instead of simply relying on what you see after drawing a channel, you can add some technical indicators to confirm the channel. For instance, market participants can add some momentum tools like RSI or Stochastic and watch their readings when the price reaches the lower or the upper band.
Technical Indicators to Use Instead of Drawing Channels
Traders who use the channel pattern trading method can draw channels manually or use some special technical indicators to avoid routine. Here are some of the most popular technical analysis tools that can be applied to automate the routine:
- Bollinger Bands. These dynamic bands encapsulate the price, allowing market participants to use both bullish and bearish channels in trading.
- Donchian Channels. The technical indicator helps visualize the price channel, especially in sideways markets.
- Moving Averages. Traders can use a couple of moving averages with different periods and deviations to draw dynamic channels.
Trading within the Bullish Channel
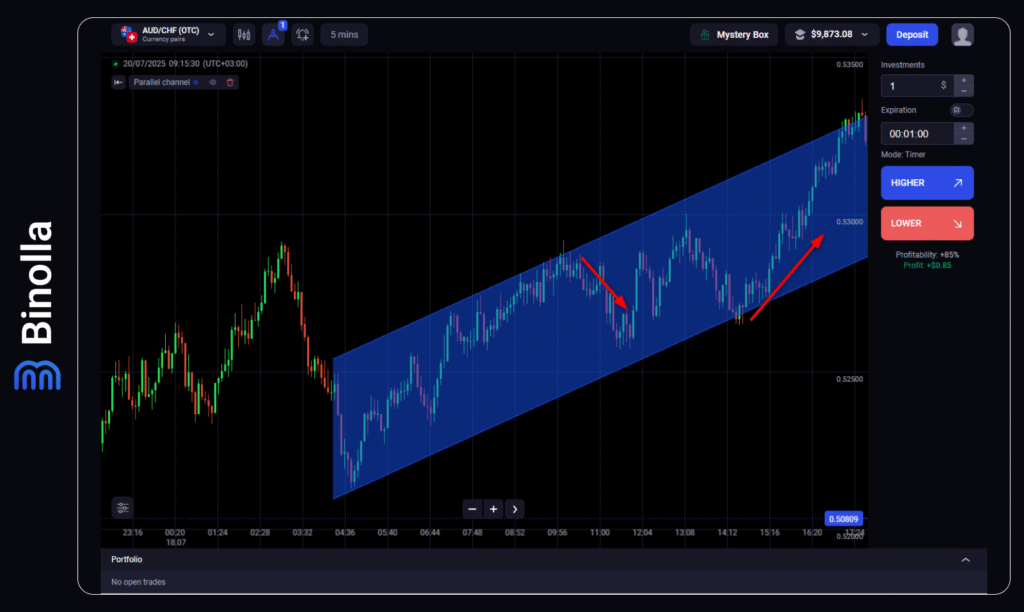
After drawing the bullish channel, you should monitor the price movement to find entry points. One of the advantages of this method is that you can trade in both directions. Traders can buy near the lower band and sell when the price is close to the upper band. The take profit order can be placed on the opposite border of the channel. When it comes to stop loss orders, they should be placed above or below boundaries.
When the price touches the lower band, you should watch for reversal patterns like hammer, inverted hammer, engulfing, bullish harami, or morning star. Also, you can use the RSI indicator to watch for oversold signals to purchase the Higher contract or buy the asset.
Should the price reach the upper band, you should look for reversal patterns like shooting star, bearish harami, bearish engulfing, evening star, hanging man, and others. Also, by adding RSI and watching the overbought conditions, you can find reversal signals.
Trading within the Bearish Channel
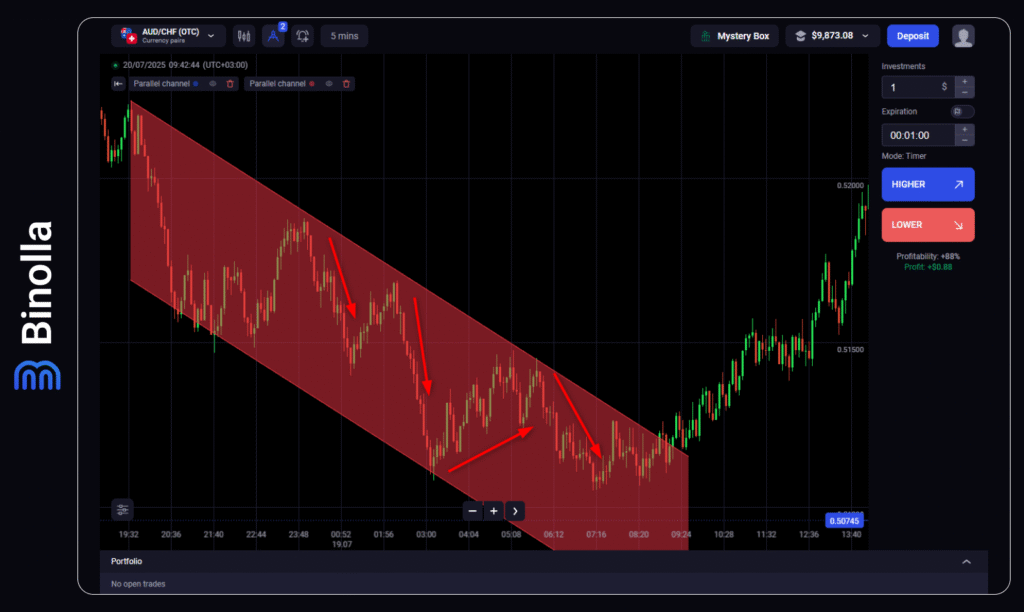
After drawing the bearish channel, you should monitor the price moving inside it. If the quotes reach the lower band, you should look for reversal candlestick patterns like hammer, inverted hammer, bullish engulfing, etc. You can also add RSI or Stochastic to check whether the price is in the oversold area to buy a Higher contract or to purchase an asset.
In the opposite situation, when the price hits the upper band of the descending channel, you should look for bearish reversal patterns like the shooting star, evening star, hanging man, or add RSI/Stochastic to check whether any of these indicators are in the overbought position.
Breakout Trading
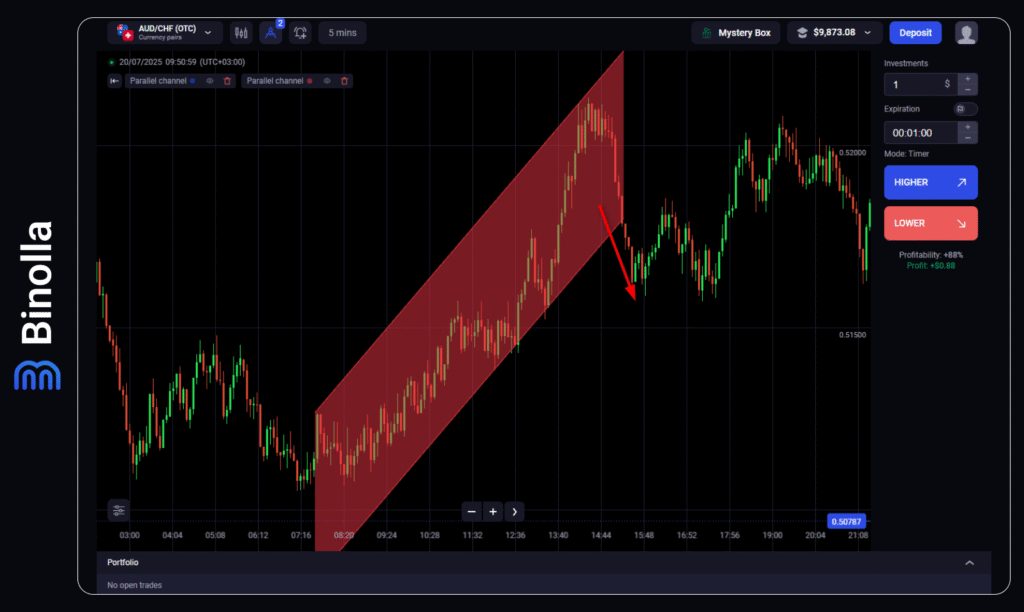
The price may stay within a channel for some time, but at some point it will break one of the boundaries to move higher or lower. When this happens, you can also place a trade and capitalize on this situation.
The image above demonstrates a breakout of the lower boundary of the channel, and the price is moving lower afterwards. To be able to make gains in this particular case, you should wait until the price breaks through the boundary and closes there. In this particular example, traders can place a Lower trade or sell. Also, you can add the volume indicator to see the volume spike. If it occurs, the chances for the breakout will be significantly higher.
Common Mistakes to Avoid When Trading with Channel Pattern Strategies
Channel pattern strategies are very effective as they are based on the basic concepts of financial market trends. However, traders often make mistakes that prevent them from profiting. We have brought together some of the most common ones so that you can discover them and try to avoid them in your trading sessions.
Drawing Channels That Do Not Exist
Beginner traders often try to draw channels that do not exist. This may lead to poor trading decisions. To avoid this mistake, you need to draw channels with at least two touches of both boundaries. Also, it is better to avoid drawing channels that ignore major highs and lows. Finally, if the price breaks both lines many times, avoid using such a channel.
Placing Trades When the Price Is in the Middle of the Channel
Placing trades somewhere in the middle of the channel is a bad idea. This may lead to poor trading decisions as there are no logical stop losses or take profit placements. Moreover, the price may go either way. The best thing to do is to wait until the quotes reach or move close to one of the boundaries and trade from there.
Trading without the Global Context
Some beginner traders focus on isolated channels on minor timeframes without looking at the bigger picture on major scales. This may lead to situations when a local channel on minute timeframes contradicts the major trend on the hourly chart. If this happens, losses may occur. To avoid this, it is better to switch between timeframes and watch for the global context. A confluence of signals on both major and minor timeframes will help you make the right trading decision.
Not Understanding Breakouts and Fakeouts
It is important to wait for a confirmation during breakouts and avoid fakeouts. For instance, if the price breaks above the upper boundary of a channel, then a trader should wait until the candlestick closes or even add the volume indicator to check whether volumes are rising in this situation. Entering the market too early may lead to fakeouts, when the price steps outside the channel for a while and then goes back inside
Applying the Same Strategy Across All Channels
When trading various types of channels, some traders make the mistake of placing breakout trades during range channels or trying to catch bounces when the market is trending. It is better to focus on range trading during sideways channels and find entry points along directional channels that confluence with the main price direction.
Conclusion
Channel trading patterns are among the most visual technical analysis tools, allowing market participants to see the trend and find entry points as well as pinpoint take profits and stop losses. They also help identify the current market stance and filter trend movements from sideways fluctuations. By using these formations, you can significantly improve your chances of profiting.
While channels can be used alone, traders often apply them as a part of more sophisticated strategies by adding various technical indicators. For instance, if they use RSI or stochastic, they can find confirmations on swings, while by adding the volume indicator, traders can be more sure about breakouts.
FAQ

Can I Apply Channel Trading Patterns Across Various Markets?
Yes, absolutely. You can apply channels across all the available markets, including forex, cryptocurrencies, stocks, commodities, and others. When choosing a particular asset, do not forget to check volatility and switch between timeframes.
Is There Any Difference Between Flags and Channel Patterns?
Yes, they are totally different. A flag is a temporary consolidation that lasts several periods, while a channel is a full-fledged formation that can last for days and even weeks. Trading within flags is not recommended, while trading within channels is highly recommended.
Is Trading Bounces Better Than Trading Breakouts?
Both strategies are good and profitable if you know how to use them. Trade bounces if you see reversal patterns or a momentum indicator is in the overbought/oversold zones. Breakouts should be traded when the price moves outside the channel, which is confirmed by rising volumes.
Is There a Fixed Length for the Channel Validity?
No, there is no fixed length for a channel to be valid. It can last for several hours, days, weeks, or even months.


