Binolla Platform General Guide

We offer a modern trading platform that includes all the tools and features that make it convenient for traders of all types. Our trading terminal allows you to buy digital options, conduct deep technical analysis, switch between basic assets, and much more. We have prepared a series of articles related to the platform and its main features. By reading this one further, you will be able to find out more about the terminal.
Contents
1: Personal Account Menu
The top-right part of the screen is devoted to the personal account menu. Here you can:
1 Deposit funds
2 Switch between real money and demo mode
3 Go to your profile
Deposit Funds
To top up your balance and start trading at Binolla, you need to click the blue “Deposit” button at the top-right part of the screen. You will see a popup window with all the available payment options for your region.
To deposit funds, you need to:

- Log in to your Binolla account;
- Click the blue Deposit button at the top;
- Choose your payment method;
- Indicate the amount;
- Accept the terms and conditions;
- Click Proceed;
- Complete the transaction by sending money from your banking option.
To find out more on how to complete such a financial operation, read the Binolla Platform: How to Register and Deposit Funds article.
Demo and Real Money Modes

At Binolla, you can find out more about the platform as well as practice your trading skills in a demo mode. To switch to it, you should click the button with the balance and choose between the Real account and the Demo account. The maximum amount on the demo is $10,000. Once you spend it, you can reset your balance to continue trading on virtual money. Moreover, there is an option to set your own amount of virtual cash (we recommend using this feature and setting the amount that you are ready to spend when trading on a real account as this will help you stay close to reality and prepare yourself for trading).
Personal Area

Click on the icon at the top-right part of the screen and choose Profile from the drop-down menu. Here you will find the following sections:
- Verification Process;
- 2-step verification with Google Authenticator;
- Password Change.

Verification Process
To verify your account, you need to complete the following steps:
- Finalize email confirmation. An email will be sent to your account and you need to copy and paste a code from it in the form, which appears after you click the Confirm button.
- Provide your personal data. Enter your first and last name, choose your gender and provide your date of birth, pick your country, type your city and address of residence.
- Identity verification. Here you need to upload a copy of your ID document and wait until our security department checks it.
Two-Step Verification with Google Authenticator
To set up this option, you need to click the Connect button and download and install the Google Authenticator software. Next, you are to scan the QR code and enter a code that you receive in the Google Authenticator app to complete the procedure.
Password Change
Here you can change your old password. To do that, you are to click the Change button, provide your current password and type your new one two times. Once you do this, click Save below the form for all the changes to take place.
Withdrawals

By reaching this page, you can complete withdrawals from the platform with any of the available payment options. Keep in mind that we do not charge withdrawal transactions with any commissions. To complete a withdrawal, you need to choose a payment option in the Withdrawal Method field and provide all other data that may be required in the form.
Operations

By clicking Operations at the top part of the screen, you will have access to all your financial transactions that you have completed from the very moment of your registration. Here you can find the following options:
- Transaction type. You can choose between deposit, withdrawal, and all operations.
- Status. Here you can sort transactions by their current status, which may be Failed, Successed, Waiting Confirmation, Processing, or Cancelled.
- Period. Traders can filter their deposit and withdrawal transaction data by choosing a particular time interval or even setting an exact date of operation.
After all the filters are settled, you simply need to click the Apply button and see filtered transactions. Also, if you don’t use any of those filters, you will be shown all transactions that you have ever conducted on the Binolla platform.
Deals

By reaching this page, you will find the history of all the trades that you have completed on the platform on both demo and real accounts. In particular, you can use the following filters:
- Trading Instrument. You can switch between Forex, Fixed Time, and other instruments here.
- Account Type. Choose real or demo here to see your transactions in both modes.
- Period. Set a particular period or even a date when you have bought trading instruments on the Binolla platform.
After pressing the Apply button, you will see all your trades or only those that you have filtered.
2: Trading Area

The trading area is located at the right part of the screen. Here, you have all the necessary tools to place trades. In this area, you are to choose the amount of your investment, set the expiration time, and choose the direction of the trade. You will also be able to see the current profit rate and how much you can earn if your forecast comes true. To find out more about how to trade on the Binolla platform, read our Binolla Platform: How to Trade guide.
Keep in mind that trading is not only about pushing buttons. Traders always use indicators or graphic tools to predict major and minor trends, as well as to find possible price momentums. To learn more about how to predict market fluctuations, look through the following articles:
- Top 5 Trend Indicators in Trading;
- Top 5 Momentum Indicators in Trading;
- Trend Line: How to Draw and Use It.
You can also read our News Trading Basics article, which will provide you with more information about how to trade on important data releases.
When choosing an amount for trading, you should act in compliance with your money management strategy. In general, traders do not put more than 1-2% of their total sum in one single trade. If you want to learn more about how much to invest in a single deal, read Money Management for Beginners article.

The Binolla platform allows traders to switch between expiration modes. To do that, you need to click on the grey flag in the trading area above the expiration field.

The first mode is the timer. You can set the time left before the expiration. For instance, by setting it to one minute, you will set expiration to one minute and the contract will expire in 60 seconds. By switching to the Clock mode, one can set the exact time of expiration (according to one’s timezone). For instance, by setting expiration at 14.35, your contract will expire at 14.35. Remember that the expiration time you set can not be higher than the maximum expiration time on the platform.
When opening a trade, one can see a special vizualization demonstrating the area in which the price should be at the moment of expiration.

When hovering over Higher or Lower buttons, traders will see a visualization on the chart. In particular, when you hover over the Higher button, the part of the chart that is above the current price (strike price) will be colored blue and a blue arrow will appear.

Hovering over the Lower button works the same way. A trader will see the red arrow and the area below the the current price (strike price) will be painted red.
3: Chart Area

This is the main area for traders when it comes to thinking about where to buy a particular digital option contract. Here you can see the chart itself and the timeframe that you can change according to your preferences. We offer time intervals from 5s. to 1d. To choose one, you need to click on + or – below the main chart area.

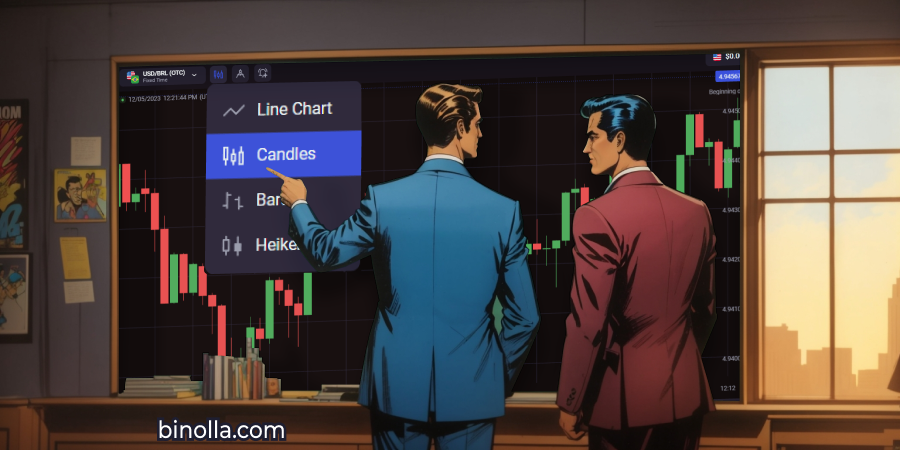
You can choose whatever type of chart is available on our platform. To do that, you are to simply click on the chart icon at the top of the chart area.
The Japanese candlestick chart is set by default, but there are three more options that you can choose from, including:
- Heikin Ashi. This type of chart looks similar to classic Japanese Candlestick with bodies and wicks, but it has major differences in how to read it. Unlike the Japanese Candlestick chart, this one’s last price is calculated as Open+High+Low+Close/4. Find out more about Japanese Candlestick (link).
- Line. It connects price dots from left to right and demonstrates pure price fluctuations. Learn more about line charts here (link).
- Bars. They use the same formula as the Japanese Candlestick chart but have slightly different appearances. Instead of bodies, there are only vertical and horizontal bars on the chart, which is where the name of this type comes from. Discover how to read bars here (link).
Switching between various types of charts may depend on your preferences that are based on price perception. Moreover, some types of charts like Japanese Candlestick allow you to make price predictions without even using technical indicators. Read more about those candlestick patterns in our Candlestick Charts: The Most Popular Reversal Patterns article.
Chart Visualization

A special visual feature allows traders to see the eventual beginning and end of a trade even if they haven’t yet joined the market. Moreover, by increasing the expiration in the Expiration field on the right side of the platform in the trading area, one can see that the distance between the beginning of the trade and the end of the trade expands as well. This will allow traders to better plan their entries as they can see where the price can be when the contract expires.

Another additional feature that one can enjoy on the Binolla platform is the opportunity to stylize it on their own. By clicking on a square icon at the bottom-left part of the chart, a trader will see a special pop-up window with colors and candlesticks. They can change between filled and hollow candlesticks as well as change the color of both bullish and bearish candlesticks.

Those using candlesticks, bars or Heikin Ashi can switch between different timeframes. To do that, a trader should click on the icon with the current timeframe at the top of the chart. A window with all possible timeframes on the Binolla platform will pop up. Once a trader clicks on any of the list, the chart will be switched to that timeframe.
4: Underlying Assets and Technical Analysis Settings Bar

By clicking a button with a current underlying asset, you will have access to the full list of assets and instruments that Binolla offers to its traders. The list allows you to pick any underlying asset and look through its price change for the past 24 hours as well as to check the profitability of each currency pair, commodity, stock, etc. in order to make the right trading decision.

Try the Binolla platform now!
Create a demo account on the Binolla platform to try out all the functionality.
Open a demoHere you can also add underlying assets to your favorities list and have quick access to them in the future. There is also a search bar, which allows you to find your preferred underlying assets in a matter of seconds.
Switching between underlying assets may be necessary for several reasons. First and foremost, you can simply find one that is going to outperform the other according to your forecasts. To find out more about how to pick one, read our How to Choose an Underlying Asset for Trading article.
Traders often use several assets at a time for diversification reasons. Therefore, by getting into this section, you can find all the underlying assets you need to select those you want to trade at a particular moment.

The Binolla platform offers all those popular tools that traders can use to forecast price fluctuations. To reach this section, you simply need to click the icon to toggle the menu and choose whatever tool you are going to use:
- Drawings;
- Trend Indicators;
- Oscillators.
Types of Digital Options Contracts
The platform provides traders with access to the most popular Forex currency pairs and cryptocurrencies. This allows you to use both traditional and modern popular digital coins. The list of underlying assets is constantly changing and you will find even more of them in the near future.
Along with traditional digital options where you can choose expiration, we have added a 5s Scalping feature, which allows you to trade ultra-fast fixed-time contracts that expire in 5 seconds. With this option, you have even more benefits as you can try to make money on smaller price fluctuations.

To choose Fixed-Time contracts, you need to go to assets and click on the Fixed Time button. Next, you will be able to choose an asset and proceed with defining the amount of investment and choosing the direction of the contract.

When it comes to 5s Scalping, to pick this type of contract, you need to go to assets, click on 5s Scalping, then proceed with picking an underlying asset, as well as choosing the direction. In 5s Scalping contracts, you don’t need to set expiration as it is predefined by the conditions of the option.
Drawings
Traders who use technical analysis with drawing tools can find everything they need here. From trend lines to support and resistance levels, and even Fibonacci retracements. To find out more about the main levels, you can read our Support and Resistance Levels: How to Use Them article.
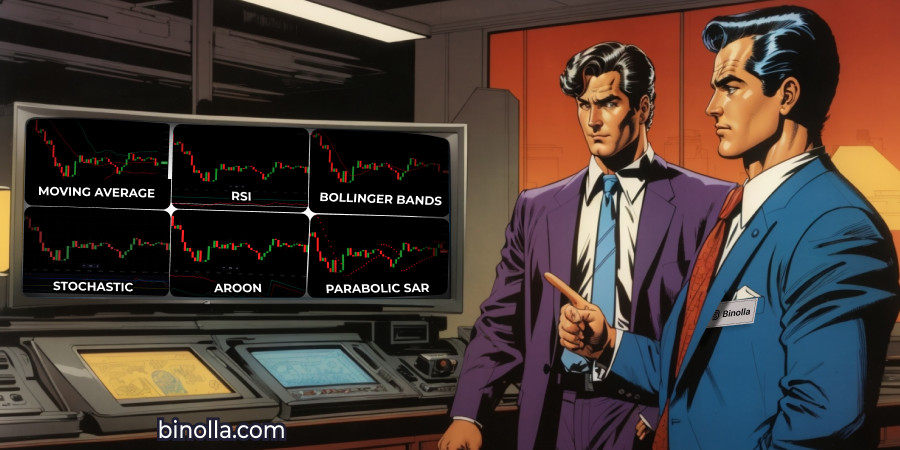
Trend Indicators
Finding trends is crucial for trading. Apart from the trend line, that is available in the Drawings menu, you can use several trend indicators that allow you to automate the process of discovering the current market tendency.
Oscillators
Those indicators are designed to demonstrate the current price momentum. We offer the most popular ones so that you can use them in trend-reversal strategies.
5: Platform Settings, Support, Trading History

The left part of the platform boasts a lot of great features, allowing you to customize it and look through the history of your trading activities. The Portfolio menu opens a special screen below the chart where you can see all the contracts that are currently active (before digital option expirations).

The next important option that you have here is History. After the digital contract expires, the information about it goes directly to this menu. You can use it to analyze your performance and adjust your trading strategy by making more data-driven decisions.

Binolla Alerts is a very useful feature that allows traders to set notifications about a particular price level. By clicking on the Create Alert button, a trader will see a window where they can select the target price of the asset from the chart.

Once the price reaches the alert level, you will see a notification Price Alert with the price on it. This feature allows traders to follow key levels from where they want to buy a particular asset without monitoring the asset all the time.

Another way to set alerts on the Binolla platform is to hover the mouse over the area with the quotes on the right side of the chart. You will see a grey bell there. By clicking on it, you will set an alert automatically on the level where the cursor was at the moment.

If you have any questions about Binolla, you can ask them to our customer support agents. Here you have two main options. We offer a FAQ section with articles about the key features of the platform.
By clicking Go to the support center, you will be able to ask any question about Binolla.

Click Create Request to send your query to our support service. You can also look through all active and closed queries.

Finally, by clicking Settings, you will be able to customize the platform by choosing the language, timezone, and scale.

There are two important options there allowing a trader to better customize the platform. First, you can switch between Mouse Wheel Action modes. Scroll allows you to scroll the chart with the mouse wheel when the cursor is on the chart. The second, Zoom, allows traders to zoom in and out of the chart by scrolling the mouse wheel.
The next important option opens the bar timer feature. It demonstrates how much time is left before the current Japanese, Heiking Ashi or bar candlestick will be closed. This feature is very useful during market analysis and decision-making process as it allows traders not to disperse their attention and focus on the current market situation.
Binolla Ratings
Trading is not only a possibility to make money by capitalizing on price fluctuations. This is also a challenge where you can compete with others. The Binolla platform offers a special ratings table where you can see whether you are among the top traders as well as watch others performance.

The Binolla Ranking feature allows traders to see how others perform. To have access to the table with rankings, one should click on the Ranking button on the left side of the screen. Once inside, a trader can see the results of other traders and their trading performance.

There are two options available for traders there. You can choose P&L, which stands for Profit and Losses. In this table, one can see the rank of top traders, their names, P&L balance, as well as favorite assets. The next option is trading volume, which ranks traders according to their total turnover. Users can also change the period, which varies from Today to Last Week.
Binolla Platform Advantages
By choosing Binolla, you will enjoy the following benefits:
- 24/7 trading with real market and OTC prices;
- The most popular assets available;
- Over 50 technical analysis tools, including indicators and drawing instruments;
- An unlimited demo account so that you can work out your strategy;
- Different types of financial instruments;
- All the most popular payment methods can be used to top up the balance and withdraw profits;
- 24/7 customer support in different languages.
If you want to learn more about our platform, look through the articles below:
Binolla Platform: How to Register and Deposit Funds
Find out more about how to create an account at Binolla and start trading on the platform.
Binolla Platform: How to Trade
Discover the steps that you should take to place your first trade at the terminal.
Binolla Platform: How to Use Indicators
Learn about trading indicators and how to use them on our platform.
Binolla Platform: How to Draw Support, Resistance, and Trend Lines
Start drawing your own support, resistance, trend lines, and others with our well-designed platform.
Learn more about how to switch between charts and read them on the Binolla platform.
FAQ

What Trading Options Do I Have on the Binolla Platform?
You can trade digital options on various digital assets, Forex CFDs, as well as buy/sell stocks. We are constantly adding new functionality so that to make it even more attractive to our customers to trade with us.
How Many Analysis Tools Are Available on the Binolla Platform?
Traders can choose from over 50 analysis tools of different types here. Along with dozens of technical indicators from both trend-following and momentum categories, you can also apply various types of lines, Fibonacci retracements, and many others.
Do I Need to Complete Verification on the Binolla Platform?
In order to have higher limits as well as to access all the features of the website, it is necessary to complete the verification process. ID checking is very simple and takes up to 24 hours.
Can I Trade from My Mobile Device?
Yes, you can. Binolla offers an adaptive mobile site that can be launched from all types of mobile browsers. The page automatically adapts to your screen size and resolution.