Basic Analysis Types in Trading

Traders use analysis to predict future price direction and even find entry points. The idea is to understand the current trend or its changes shortly. To forecast price fluctuations, traders can do research on fundamentals, apply various tools to charts, and even watch for current market sentiment.
You can use all those types of analysis separately or even combine them at some points to strengthen your research and get even better results. In this article, we are going to provide you with the basics of the most popular types of market analysis and compare them. And if you are ready to trade, open account at Binolla and buy your first contracts.
Contents
Fundamental Analysis
All assets’ fluctuations are driven by supply and demand, which, in turn, are influenced by various events. When key market participants make their decisions, they look at fundamentals to predict whether the price of a particular financial instrument is going to rise or fall. Therefore, if you conduct a proper fundamental analysis, you can peer into the very heart of price fluctuations and understand the reason why a particular stock or currency is currently surging or plunging.
What to Look at When Using Fundamental Analysis?

The good news is that there are various macroeconomic and company reports that you can use to try to predict future market trends. When you are trading currencies, you have a so-called macroeconomic calendar at hand that contains various sets of data. The key releases include:
- Central Bank meetings and interest rate decisions. Central banks decide the monetary policy, which, in turn, has a strong impact on currencies, stocks and other assets;
- GDP data. Economic growth is important when analyzing most types of assets, as even commodities are mostly dependent on how strong a particular economy is;
- PMI indexes. Those are advanced indicators showing how active service and manufacturing sectors are;
- Inflation data. The inflation rate determines price growth over time;
- Trade balance. This indicator is important, especially for export-dependent countries;
- Labor market data, and others.
The idea of using this type of analysis is to try to predict how macroeconomic data will affect future central bank monetary policy decisions. If a central bank is going to hike rates, a currency is likely to grow, while during times of interest rate cuts, a dependent currency is likely to plunge.
When it comes to stocks, the situation may differ as lower interest rates mean more cheap liquidity (cheaper loans), which, in turn, means that investors may use this additional money to buy stocks. This is why sometimes in times of economic crisis, stocks are in an uptrend, while during times of higher rates, when liquidity becomes more expensive, stock markets are in correction.
Apart from macroeconomic data, which is important for stock trading, investors use key earning reports that are released by companies on a constant basis every three months. The idea here is very simple. If a company’s earnings are better than they were in the previous quarter, the company’s performance is also better, and this is a good pick for investors.
On the other hand, if the opposite happens (the company’s earnings fall), the performance is worse and investors sell shares.
As for cryptos, they are influenced mainly by economic fundamentals and industry-related news. For instance, in times of broader cryptocurrency adoption by various states, demand is rising, while when governments ban or plan to do something of this kind with cryptocurrencies, the demand plunges.
How Does It Work?
Imagine that you are going to trade EUR/USD in Forex and you expect the ECB to hike rates while the Fed is likely to remain silent and even plan to cut rates due to weak economic growth. Key players are likely to start buying EUR against the US dollar in this case. You can join this trend and make money when trading Forex CFDs.
Another example of how it works is when you expect AAPL to show better performance during the next quarterly earnings report. You buy the stock and hold it until the report is released (or even longer if you are a long-term investor). If the earnings release shows better performance and the price goes upward, you can sell the stock and profit from the price difference or simply hold it for longer, expecting the uptrend to continue.
Cryptocurrency trends can also be predicted by fundamentals. The latest example of an XRP uptrend is the best reflection of how it works in the real world. In 2020, the SEC filed a lawsuit against Ripple Labs for issuing unregistered securities worth $1.3 billion. After Ripple got a partial win against the SEC, the XRP price went upward.
When you are trading with fundamental analysis, you don’t find exact entry points. If you think that the Fed, for instance, is going to hike or hold interest rates whilst the others are likely to cut rates, you simply buy USD against other currencies and hold your trade until the situation changes.
Technical Analysis
Unlike fundamental analysis, technical studies chart Those who use it claim to predict price fluctuations even without looking at fundamentals. They use current and historical price movements to forecast future trends.

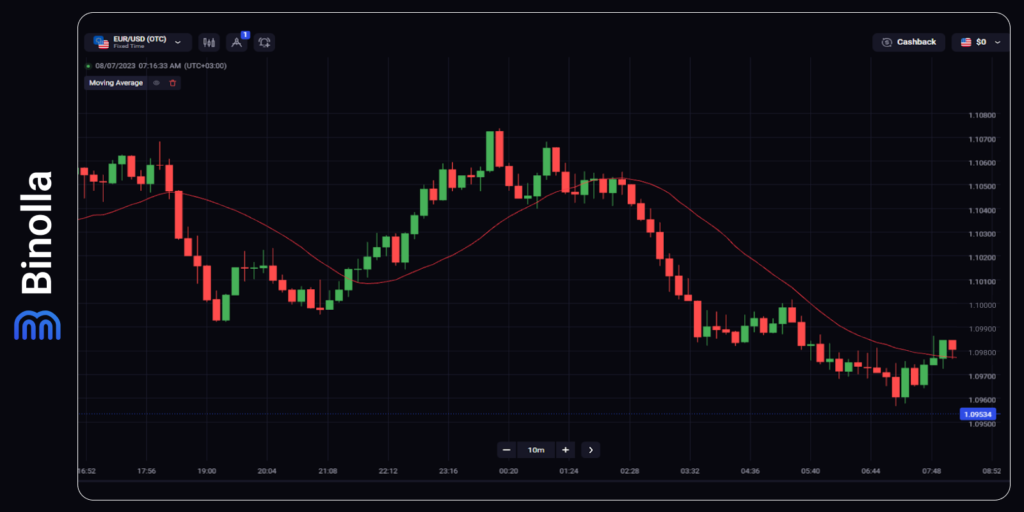
For instance, if you look at the chart above, you will see a moving average indicator that fluctuates below or above the price. When the dynamic line is above the price and goes down, you can assume that the downtrend is developing, while when the line is below the price and goes up, the uptrend is dominating.
One of the basic concepts of this type of analysis is to use historical prices to predict future trends. Apart from simply providing traders with information about the current or future price movement direction, technical analysis allows traders to find entry points. Market participants used various strategies based on technical indicators or graphic tools that helped them buy or sell with a higher level of precision.

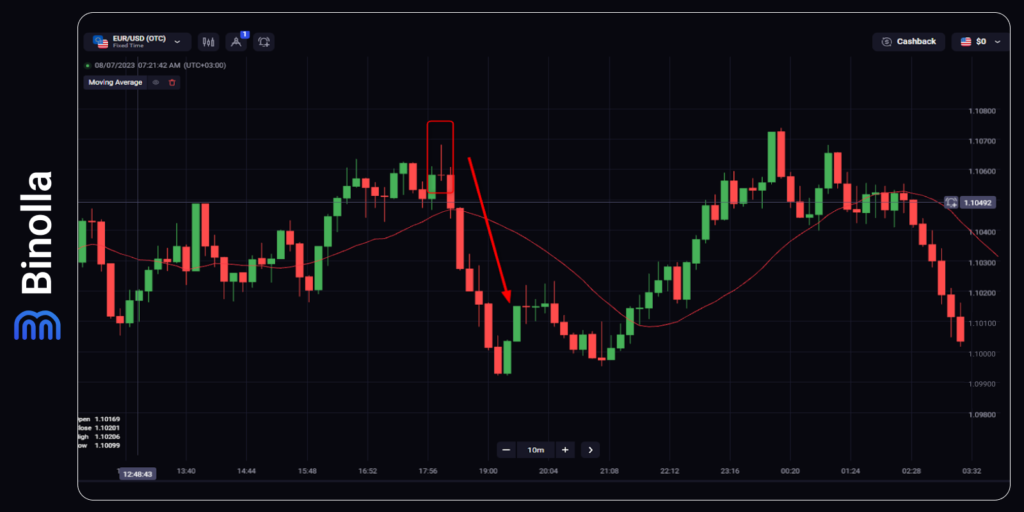
The example above shows how traders can use graphic tools to predict price reversals and, thus, enter the market when the price is peaking in order to make money and the future downtrend. You can see a classic Shooting Star chart pattern that tells you that the price is likely to reverse downwards. If this happens, you can sell a currency pair or buy a Lower contract if you are trading fixed-time derivatives. The same applies to stocks, cryptocurrencies, and all other assets.
One of the advantages of technical analysis is that it can be applied to any type of security. You don’t need to choose a particular indicator or other tool to trade a particular asset like MA for stocks, RSI for currencies, ATR for cryptos, etc. All of them are applicable to all types of assets. The moving average indicator, for instance, can be applied to stocks, currencies, cryptos, commodities, and so on.
Market Sentiment
Another type of analysis that you can use is market sentiment. Traders and investors have their own opinions on the future price fluctuations. You can use various indicators to see whether the market is bullish or bearish currently. This will allow you to decide whether to trade with the trend or try to go against the market if a reversal is likely to occur.
Market Sentiment Indicators
Unlike technical indicators that are based on price calculations, market sentiment is the ratio of positions in most cases. By applying such indicators, you can get insight into the mood that is currently dominating the financial markets. Here are some of the most popular indexes that are available to traders nowadays:
- BPI or Bullish Percent Index. This indicator is based on the stock market sentiment. If there are 80% of bullish patterns on the chart, the market is considered bullish, while if the number of bearish percents severely exceeds this of bullish, the market is considered bearish;
- COT or the commitment of traders. The commodity market offers its own indicator that shows the moods of traders and can be used to predict future price fluctuations;
- How-Low index. This indicator compares the 52-week high and 52-week low. If 30 or more companies are close to their 52-week low, the market is considered bearish, while if the same can be applied to 52-week high, the market is considered bullish;
- VIX. The Volatility index is also very popular among traders who use market sentiment. However, it doesn’t tell you anything about market trends. The index shows the estimated volatility for the next 30 days.
What Type of Analysis is Better?

Many traders often ask questions about which type of analysis to choose for their trading. The truth is that all of them are of equal importance and everything depends on your own preferences. If you don’t want to study fundamental analysis and economics, you can avoid using this type and focus on price fluctuations. On the other hand, if you are good at economics and you doubt the importance of historical prices to predict future price fluctuations, you can choose the fundamental one.
For digital options traders, fundamental analysis is useless as they are using short-term contracts. Therefore, they can focus on the technical method in their everyday trading routine. Forex CFD, stocks, and cryptocurrency traders can choose between both and even pick sentiment analysis if they think that this one is appropriate and can be applied to their strategies.
When it comes to crypto, you can trade news instead of using fundamental analysis. Trading news means buying a contract on a particular data release or event right before or after the publication. When trading news, you don’t do any research, you try to guess the difference between current figures and forecasts.
One of the best solutions for FX CFD, stocks, and cryptocurrency traders is to combine all types of analysis in their strategies. You can, for instance, predict the Fed to hike rates and, therefore, buy USD against other currencies. Then you switch to a particular chart and find entry points to buy the US dollar. Next, you can watch the current market sentiment, looking for confluence signals.
If all systems give you a green light, you can buy. The same is true for any other type of asset. The only exception to this rule is the digital option contract, as mentioned above, has short-term expirations and, therefore, it is useless to apply fundamental analysis to it.
Conclusion
All three types of market analysis are very important. Depending on your strategy, you can use one of them or even make a wise combination of all of them to make data-driven decisions. Whatever analysis you use, you should never forget about proper money and risk management, as both are key to successful trading.
FAQ

What Is the Best Type of Market Analysis?
There is no best or golden type of analysis that brings you immediate and 100% success. You can try to use each of the approaches and find out, which one suits you better.
Why Is Market Analysis Important?
Professional traders use market analysis to predict future trends and find entry points. Without doing proper research, your trades will be random, which means that your chances to succeed are close to zero over time.
What Types of Market Analysis Are Best for Intraday and Digital Options Trading?
Technical analysis is the best for trading short-term contracts, including digital options, Forex CFDs, stocks, and even cryptocurrencies. Fundamental analysis studies long-term trends. Therefore, it is not applicable for short-term price fluctuations.
Can I Use News to Trade Digital Options?
Yes, you can. News trading is a very popular trading strategy. The difference between news trading and fundamental analysis is that the latter covers long-term trends, while news trading allows you to make money on a single data release without any analysis at all.


