Aroon Indicator: How to Apply It to Your Trading Strategies

The Aroon indicator is a technical analysis tool that allows you to watch the current market trend. With this indicator, traders can also see whether the price is trending or trading in a range. Finally, with Aroon, you can measure the strength of the current market trend.
Aroon was developed by an Indian trader in 1995. The name of the technical indicator means “Dawn’s Early Light” in Sanskrit. It describes the nature of this technical analysis tool as the indicator provides you with advanced information about the beginning of a new price trend. Discover the basics of the Aroon indicator and start trading with it on the Binolla platform.
Contents
- 1 Aroon Indicator Explained
- 2 How to Use Aroon Indicator at Binolla
- 3 How Does Aroon Indicator Work and How to Read Signals?
- 4 Practice trading with the Aroon indicator!
- 5 How to Trade with Aroon Indicator: Main Strategies
- 6 Aroon and Digital Options
- 7 Aroon Indicator Pros and Cons
- 8 Aroon Key Takeways
- 9 The Aroon Indicator Final Words
- 10 FAQ
Aroon Indicator Explained
The indicator comprises two lines: Aroon-Up and Aroon-Down. The first one measures how many days have passed since a 25-day high was recorded. The second one, as you can guess, measures the same as the lowest point.
Both lines range between 0 and 100. They are drawn in a single, separate window to make interpretation easier.
How to Use Aroon Indicator at Binolla
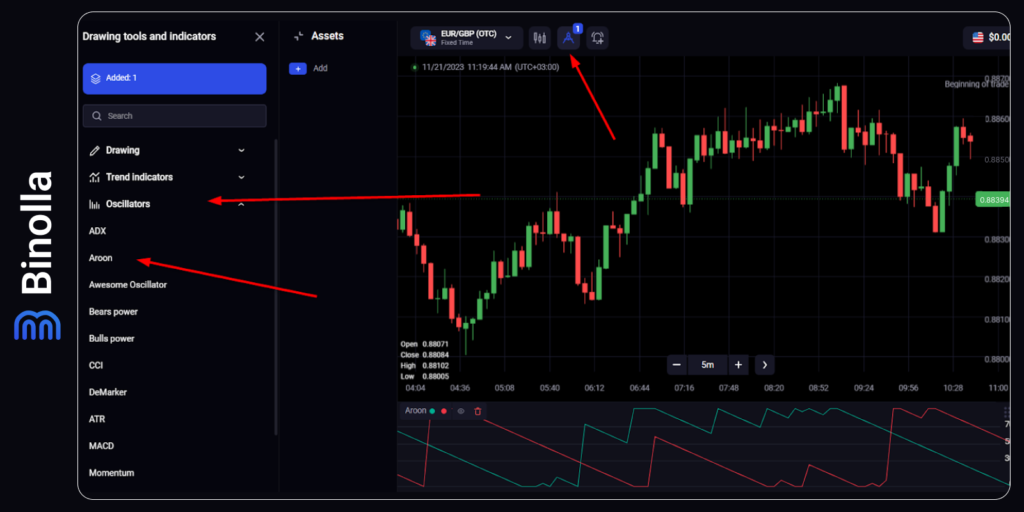
To start using the indicator on the Binolla platform, you should complete several simple steps:
- Go to the platform and log in to your account.
- Click the icon with tools at the top of the screen.
- Choose Indicators in the left vertical menu.
- Pick Aroon there.
After you complete all these steps, the indicator will appear below the chart. The only setting that the indicator has is a period. It is set by default to 25, which is the number of working days in one month. Therefore, you have monthly coverage, which allows you to look at mid- and even long-term trends.
The indicator was designed in such a way that it works within a 25-days period. If you make it lower, you will see that a mess appears in the window with this technical analysis tool. Therefore, changing the period is strictly unrecommended in this case.
How Does Aroon Indicator Work and How to Read Signals?
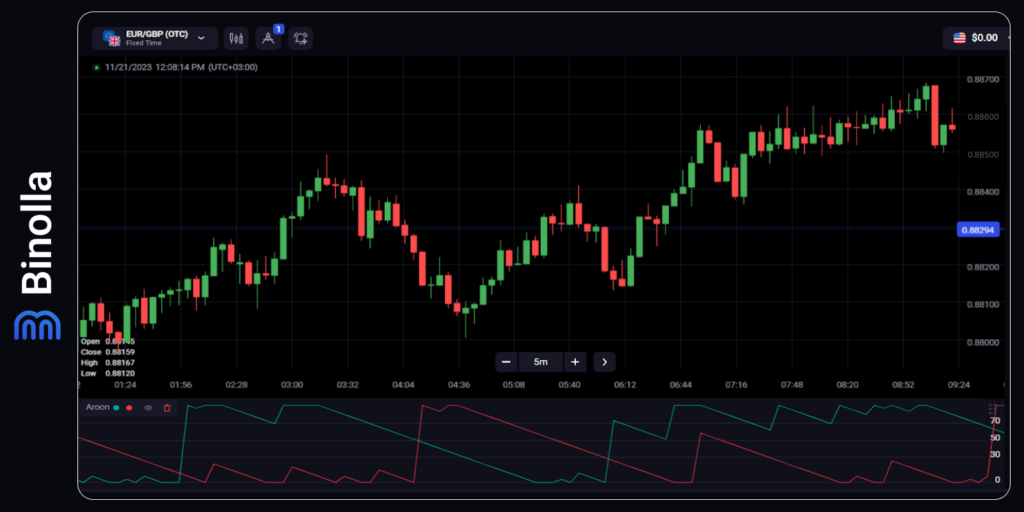
The Aroon indicator is located in a separate window right below the chart. As mentioned above, it has two lines, the green one is known as Aroon-Up and the red one stands for Aroon-Down. If the green one is close to 100 and the red one is close to zero, then we can assume that the uptrend is developing.
On the other hand, when the red line is close to 100 and the green one is close to zero, then the downtrend is developing. This is a very simple interpretation that allows you to check the current price movement direction almost right away.
However, as you can see on the charts, the lines change their positions from time to time, which can be interpreted by traders as changes in the market trends. If the green line goes higher and crosses the red one from below, then you can expect the uptrend to begin. In the opposite situation, when the red line goes higher and crosses the green one from below, then the downtrend is on the way.
How to Trade with Aroon Indicator: Main Strategies
The Aroon indicator can be used as a standalone technical analysis tool with a couple of strategies inside that you can use. However, you can also apply some additional tools to make it work even better in your strategies.
Aroon Basic Strategy
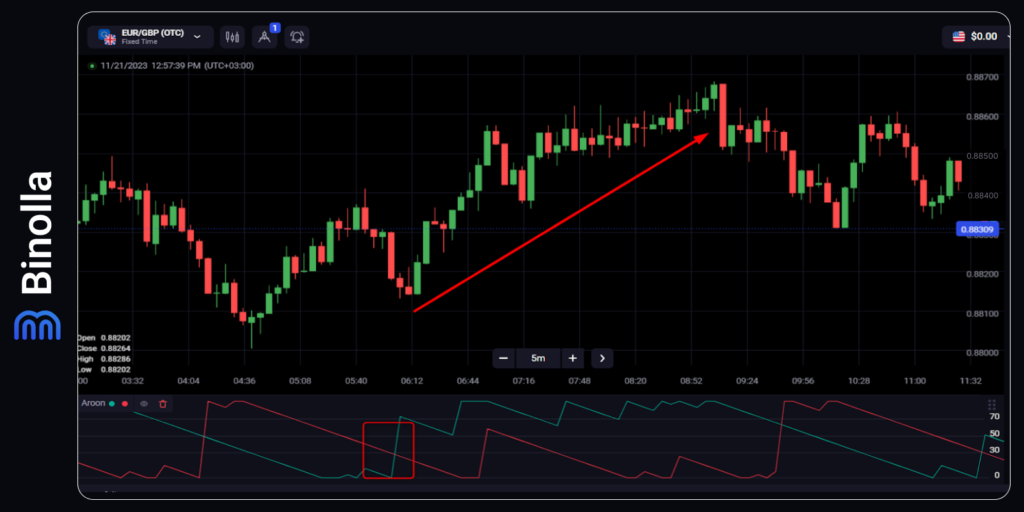
The first strategy that you can apply right away when trading with the Aroon indicator is when the green line goes higher and crosses the red one. As you can see, the price changes its direction as well and begins an uptrend. In this situation, you can buy a Higher digital contract or buy a currency pair/stock.
After the order is placed, digital options traders can sit and wait for the expiration to occur. As for Forex or stock traders, they can hold their positions until the green line goes down and the red one comes into play. This will be a signal to close your trades and look for other signals.
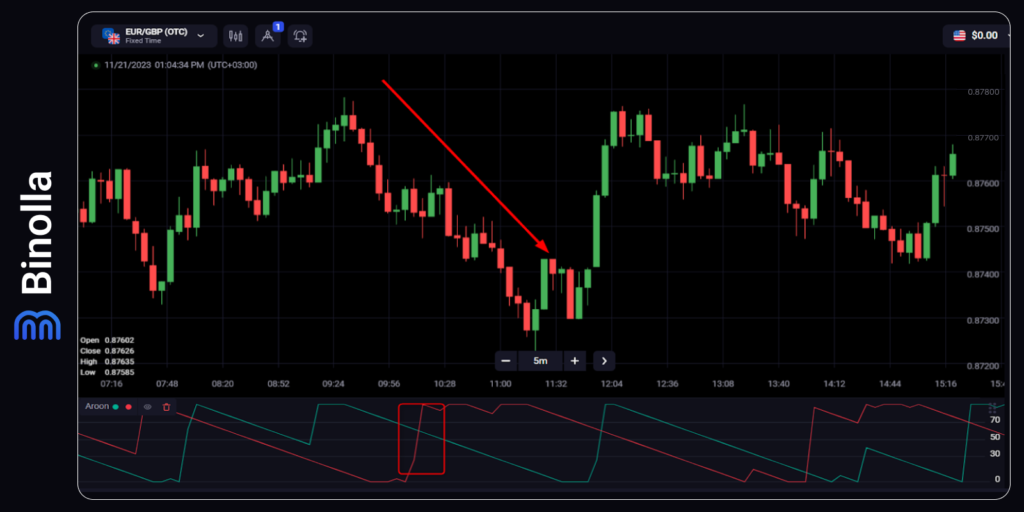
The same strategy can be applied to situations where a downtrend is on the horizon. When the red line goes higher and crosses the green one from below, you can buy a Lower contract or sell a currency pair/stock.
Again, when trading digital options, after buying a Lower contract, you don’t need anything to do. Traders simply wait for expiration to occur. When it comes to Forex or stock trading, it’s a different story. You need to find the points at which you are going to leave the market. To do that, you can use the opposite signals when the red line declines and crosses the green line from above.
Aroon Strategy with Candlestick Patterns
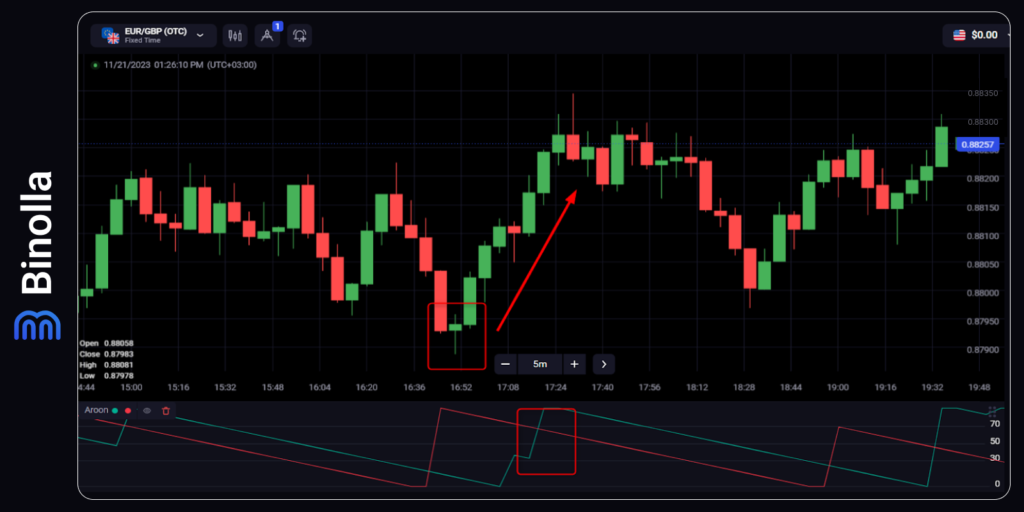
Aroon signals are not always come at the right time. Sometimes they are late. You can still use them when it comes to digital options, but when it comes to Forex or stock trading, you may lose a huge part of the price movement simply by sitting and waiting for the opportunity to come.
In our next example, we have a hammer pattern that appears at the bottom of the market. This is a good signal for both digital options and Forex/stock traders to go long. In this situation, the signal from Aroon comes a bit later, which means that you have better opportunities when trading with the hammer pattern. Anyway, after the signal from Aroon is in place, you can stick to it and hold your positions until the opposite one appears.
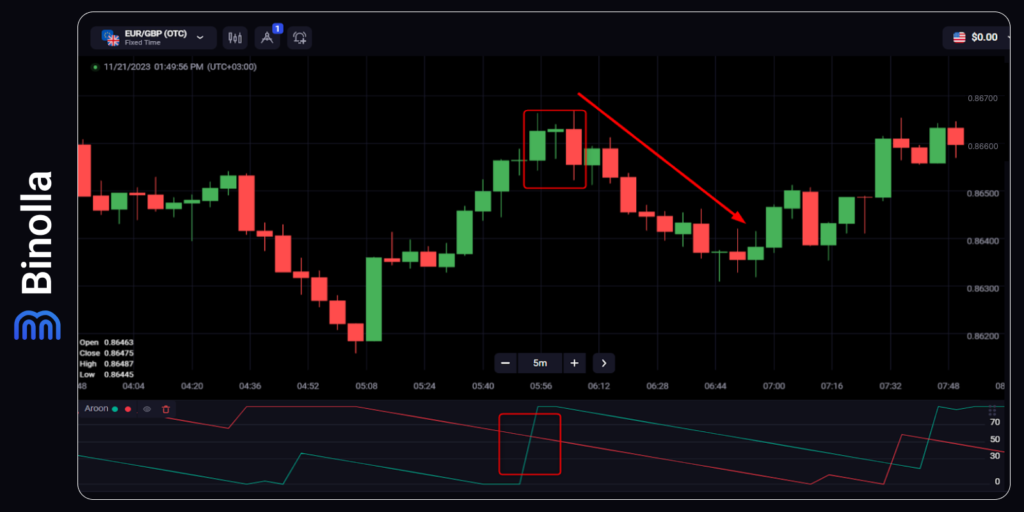
In the next situation, a signal from Aroon comes even beforehand, which allows you to make a decision in advance. When the hanging man (Link to: Hanging Man and Shooting Star) signal appears (a candlestick with a small body that is close to the candlestick’s top), you can already be in the market.
Aroon and Trendline Strategy
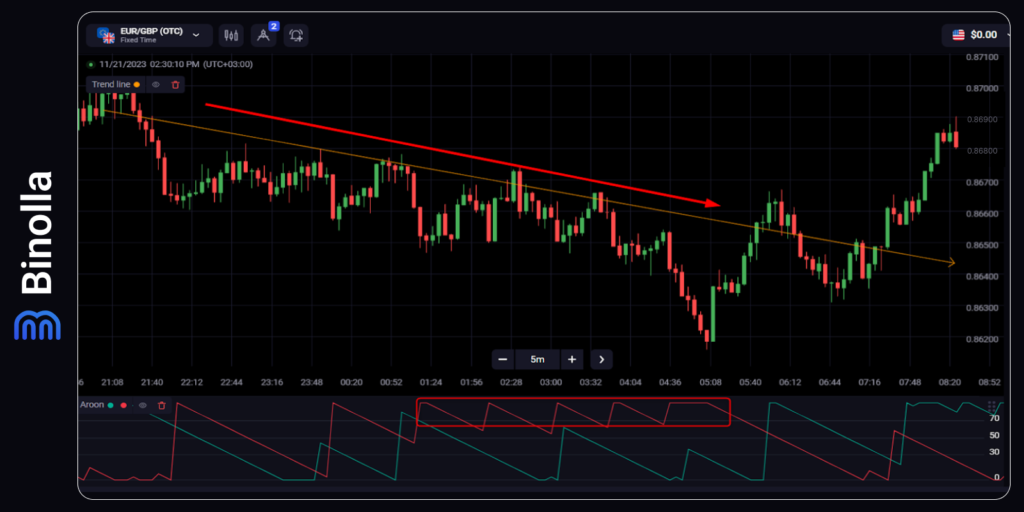
This strategy uses both a trendline and the Aroon indicator. The idea here is to stick to your position or buy Lower contracts/sell FX currencies or stocks until the price stays below the descending trendline. Aroon is used in this case as a confirmation indicator. Until the red line stays close to 100, you can use signals coming from the descending trendline.
Aroon and Digital Options
Aroon can be used for digital options trading as a main indicator. However, it may be too late to provide you with trading signals, as it was already mentioned above. Therefore, you may be late to place orders. Therefore, if you are going to apply Aroon to your digital options strategies, it would be a great idea to combine it with other technical analysis tools so that you can be on time to buy Higher or Lower contracts.
In general, for all oscillators, digital options work better with RSI or stochastic, as both provide you with signals about the possible market reversal beforehand. When it comes to Aroon, it can give advanced signals as well, and if this happens, you can use it alone without looking for confirmations.
Aroon Indicator Pros and Cons
The pros of using the Aroon indicator are:
- It can help identify the onset of a new trend, as well as its direction and strength.
- It can help confirm other trend-following indicators, such as moving averages or trend lines.
- It can help detect trend reversals, such as when the Aroon up and down lines cross each other or diverge significantly.
The cons of using the Aroon indicator are:
- It can generate false signals in sideways or choppy markets, as the highs and lows may not reflect the true trend direction.
- The indicator can lag behind the price action, as it depends on the previous highs and lows, which may not be updated frequently enough.
- It can be subjective, as different traders may use different parameters or interpretations of the indicator.
Aroon Key Takeways
The Aroon indicator is a technical analysis tool that measures the strength and direction of a trend. Here are ten key takeaways from using it:
- The Aroon indicator consists of two lines: Aroon-Up and Aroon-Down. They both range from 0 to 100 and indicate how long ago the highest high or lowest low occurred within a given period.
- A high Aroon-Up value means that the price is making new highs and the trend is up. A high Aroon-Down value means that the price is making new lows and the trend is down.
- A low Aroon-Up value means that the price is not making new highs and the trend is weak or consolidating. A low Aroon-Down value means that the price is not making new lows and the trend is weak or consolidating.
- When the Aroon-Up and Aroon-Down lines cross, it signals a possible trend reversal. A bullish crossover occurs when the Aroon-Up crosses above the Aroon-Down, indicating that the uptrend is gaining strength. A bearish crossover occurs when the Aroon-Down crosses above the Aroon-Up, indicating that the downtrend is gaining strength.
- The Aroon indicator can also be used to identify divergences between the price and the indicator. A positive divergence occurs when the price makes a lower low but the Aroon-Up makes a higher low, suggesting that the downtrend is losing momentum. A negative divergence occurs when the price makes a higher high but the Aroon-Down makes a lower high, suggesting that the uptrend is losing momentum.
- The Aroon indicator can be combined with other technical indicators or chart patterns to confirm or enhance trading signals. For example, a breakout from a triangle pattern can be validated by a bullish or bearish crossover of the Aroon lines.
- It can be customized by changing the period parameter, but you should keep in mind that by doing it, you may receive a mess on the charts.
- The indicator can be applied to any time frame, from intraday to monthly charts. However, traders should be aware of the trade-off between sensitivity and reliability. Shorter periods will produce more signals, but also more false or whipsaw signals. Longer periods will produce fewer signals but also more reliable and significant signals.
- The Aroon indicator does not provide any information about the magnitude or duration of the trend. It only measures how long ago the price reached a new high or low. Therefore, traders should use other tools such as trendlines, moving averages, or Fibonacci retracements to gauge the size and scope of the trend.
- The Aroon indicator is a standalone trading system. However, when using it in conjunction with other aspects of technical analysis such as support and resistance levels, volume, and risk management, you can improve your chances of making money. Traders should also consider the market context and sentiment before entering or exiting a trade based on the Aroon indicator.
The Aroon Indicator Final Words
The Aroon indicator is a technical analysis tool that measures the strength and direction of a trend by comparing how long it has been since the highest and lowest prices of a given period. The indicator consists of two lines: Aroon Up, which tracks the number of periods since the highest price, and Aroon Down, which tracks the number of periods since the lowest price. The indicator ranges from 0 to 100, where a high value indicates a strong trend and a low value indicates a weak trend. The indicator can also signal trend reversals when the two lines cross each other or when they reach extreme values. You can apply it to both digital options and Forex, but it is better to add some other technical analysis tools to your strategies.
FAQ

What is the Aroon indicator?
The Aroon indicator is a technical analysis tool that measures the strength and direction of a trend by comparing how long it has been since the highest and lowest prices of a given period.
How is the Aroon indicator calculated?
The Aroon indicator consists of two lines: the Aroon up and the Aroon down. The Aroon up is calculated as 100 x (number of periods – number of periods since highest high) / number of periods. The Aroon down is calculated as 100 x (number of periods – number of periods since lowest low) / number of periods.
How is the Aroon indicator interpreted?
The Aroon indicator can indicate the strength and direction of a trend, as well as potential trend reversals. A high value of the Aroon up indicates a strong uptrend, while a high value of the Aroon down indicates a strong downtrend. A low value of both lines indicates a sideways or consolidating market. A crossover of the two lines can signal a trend change, with the line crossing above being the dominant trend.
What are some advantages and disadvantages of the Aroon indicator?
Some advantages of the aroon indicator are that it is easy to calculate and understand, it can capture both trend strength and direction, and it can provide early signals of trend reversals. Some disadvantages of the aroon indicator are that it can lag in fast-moving markets, it can generate false signals in choppy or noisy markets, and it can be affected by the choice of the period parameter.

