ADX Indicator in Trading: How to Curb The Lines
ADX stands for Average Directional Index. The indicator is known for its capability of measuring trends or directional price movements. It uses the average true range as well as moving averages to display the current state of the market. Unlike most technical indicators, this one can’t be used for defining market signals. It is applied by traders mostly to filter signals. If you want more information about this technical analysis tool, read this article. Create an account at Binolla and start using moving averages in your strategies.
Contents
How to Use ADX Indicator
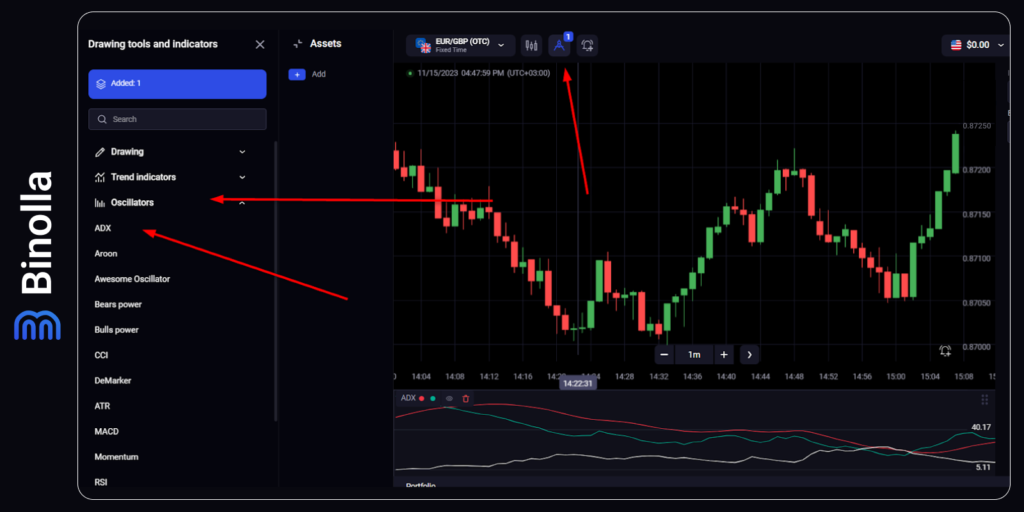
To start using the ADX indicator on the Binolla Platform, you need to complete the following steps:
- Log in to your Binolla account.
- Go to the Tools section by clicking an icon at the top of the screen.
- Pick “Oscillators” in the left vertical menu.
- Click “ADX” there, and the indicator will appear right away on the chart.
ADX Indicator Formula
The formula for calculating the Average Directional Index (ADX) indicator involves several steps. Find its overview described below:
- Calculate the True Range (TR): The True Range represents the greatest distance among three values: the current high minus the current low, the absolute value of the current high minus the previous close, and the absolute value of the current low minus the previous close. TR is calculated for each period.
- Smooth the True Range: To smooth the True Range, a moving average is typically applied. The most common approach is to use Wilder’s Smoothing method, which involves calculating a 14-period exponential moving average (EMA) of the True Range.
- Calculate the Directional Movement (DM): The Directional Movement is determined by calculating the positive directional movement (+DM) and the negative directional movement (-DM). +DM is the absolute value of the current high minus the previous high, while -DM is the absolute value of the previous low minus the current low. If neither of these values is greater than zero, then +DM and -DM are set to zero.
- Smooth the Directional Movement: Similar to the True Range, the Directional Movement is typically smoothed using the Wilder’s Smoothing method. A 14-period EMA is calculated for both +DM and -DM.
- Calculate the Directional Indicators (+DI and -DI): The Directional Indicators represent the ratios of the smoothed Directional Movement values to the smoothed True Range values. The +DI is calculated by dividing the smoothed +DM by the smoothed True Range and multiplying the result by 100. The -DI is calculated in a similar manner but using the smoothed -DM.
- Calculate the Directional Index (DX): The Directional Index is calculated by taking the absolute value of the difference between +DI and -DI, divided by the sum of +DI and -DI, and multiplying the result by 100. This value represents the strength of the current trend.
- Smooth the Directional Index: Finally, the Directional Index is smoothed using a moving average. A 14-period EMA is commonly used to calculate the Average Directional Index (ADX) itself.
- The resulting ADX value represents the strength of the trend. Higher ADX values indicate a stronger trend, while lower values suggest a weaker or less defined trend. Traders often use ADX values above 25 as a threshold for determining the presence of a significant trend.
How to Use the ADX Indicator in Day Trading with Digital Options
The first thing that you should remember before applying ADX to your charts is that this indicator is of small importance for digital options. It provides you with information about the trend‘s strength and direction. You can find entry point signals with this indicator, but it is better to confirm them with other tools.
Knowing about the current trend may be useful for digital options traders, as opening trades along the main price movement direction is safer than trading against it. Nevertheless, some market participants use counter-trend trading systems and do it successfully. Thus, using ADX may hinder them from making appropriate market decisions.
How to Use the ADX Indicator: Suggestions
While ADX does not provide you with good entry points, you may still apply it in your trading routine. Some traders find it extremely useful, especially when they are looking for mid- and long-term trading opportunities when it comes to Forex or stocks. Thus, it would be a good idea to know how to read ADX.
The main line of the ADX indicator shows the strength of the trend movement. +DI and -DI lines help traders highlight the direction of the price movement.
Establishing the Trend Strength
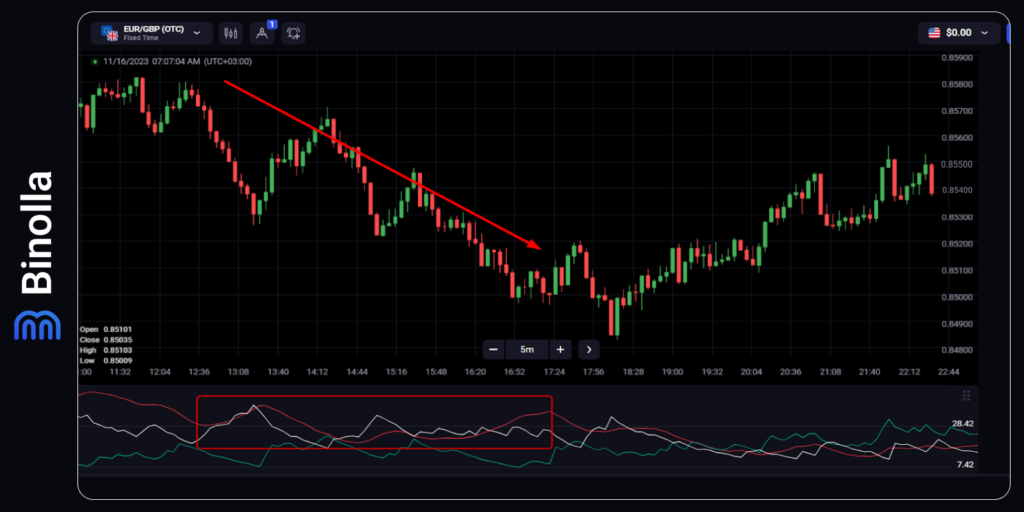
ADX is the line that is responsible for defining the trend’s strength. It is believed that when it is below 20, the trend is weak or there is no trend at all. Once it goes above 20, the current price movement gains strength.
The example above shows how it works. The price is in the downtrend and the ADX line is above 20 most of the time, which allows you to assume that the trend is going to continue.
Important Note:
Some traders wrongly assume that the red line indicates the direction of the price movement. As you can see in our example, the line is high, but the trend goes down.
Once the line goes back below 20, the trend is over as it is substituted by the flat.
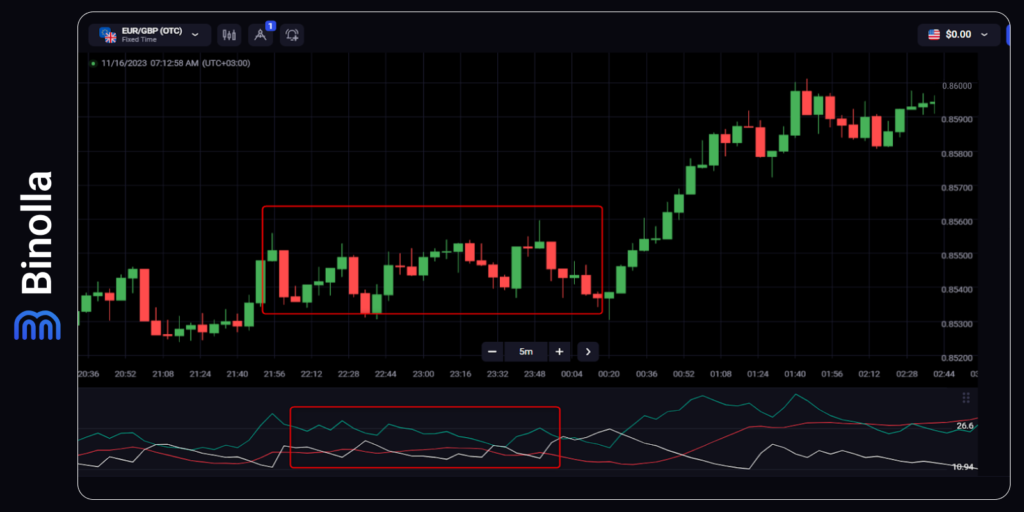
In the example above you can see that the price goes sideways and the red line of the ADX indicator is below 20.
Establishing The Trend Direction with ADX
Apart from using the indicator to evaluate the trend strength, you can equally apply it to your trading system in order to define the current trend direction. The +DI and -DI lines can be used for this purpose. This system works similarly to moving average crossovers.
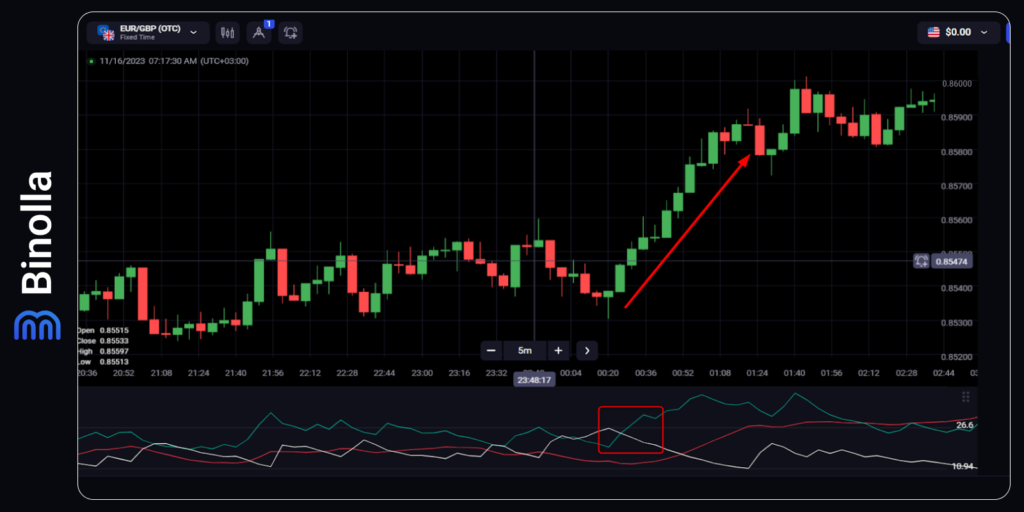
The image above shows you a classic system based on the ADX indicator. Once +DI (green) crosses -DI (white) and goes higher, you can expect the price to go upward. This is where you can apply a crossover strategy. Traders buy Higher contracts at the moment of such a crossover.
However, it is better to use another signal that will tell you about the upcoming uptrend. If you look at the chart, you can find a hammer pattern there, right at the beginning of the whole upward movement.
This can be your signal for buying digital options, Forex, or stock assets. If you are using this hammer strategy and buying a Higher contract, you don’t need ADX anymore as the trade is already in place, and all you need to do is wait for the expiration to come.
Forex or stock traders, in turn, still need ADX to see when the directional movement is over to find exit points. Once -DI crosses +DI from below, the trend is likely to reverse, which means that you can close your long positions. You should also look at ADX. If it goes below 20, the current price movement is over.
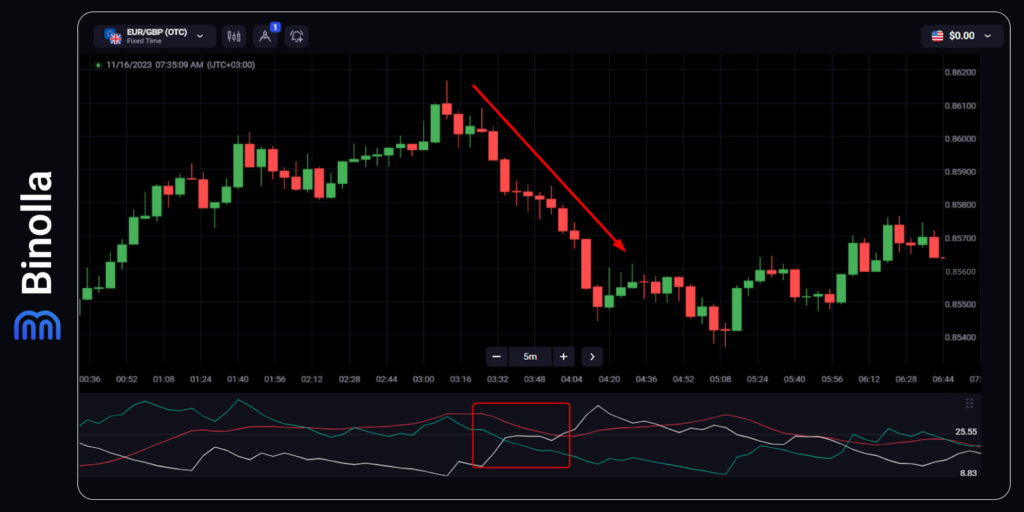
The opposite signal comes when -DI crosses +DI from below. In this case, you have a clear sell signal. Digital options traders can buy Lower contracts, while FX or stock traders go short. However, the trick here is that digital options traders can enter the market after the Shooting Star pattern and simply watch if their signal is confirmed by the ADX indicator (sometimes this confirmation may come even after the trade is closed).
Forex or stock traders, in turn, can sell after the Shooting Star candle is closed. They may still need ADX to see whether the directional movement is going to continue and how strong the trend is.
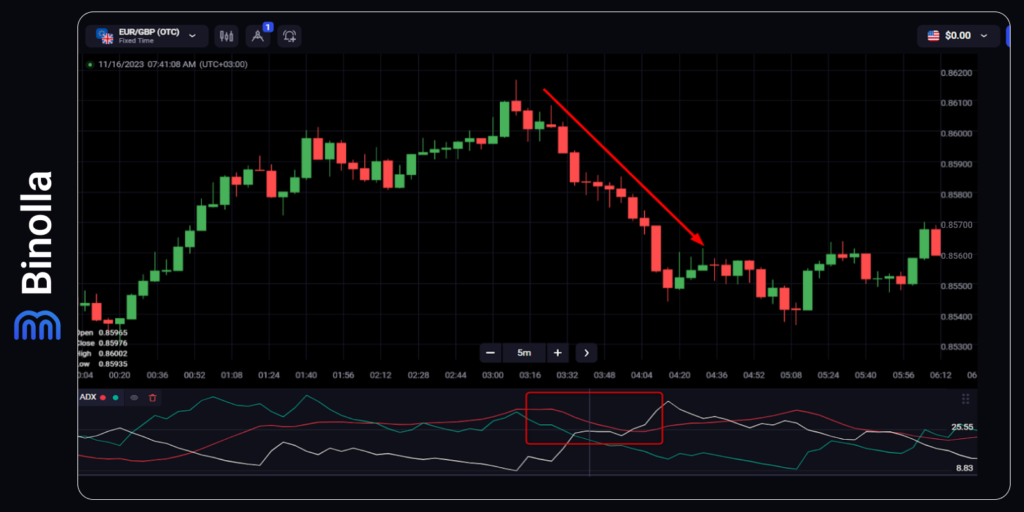
There is one more important thing that you should know about ADX before you start using it. The red line, which is responsible for displaying the trend strength, does not work properly all the time. It may provide you with the wrong information, like in the case that is shown in the example above. This may happen when the trend changes instantly.
Here you can see that the price has strong downside momentum. However, the ADX part of the indicator (the red line) goes down, which can be interpreted as the weakness of the trend. This is due to the fact that the line is unloading after reaching its peaks during the uptrend. Thus, if you see such a sharp switch in a trend movement direction, you should rely on other indicators.
Another thing to consider when you are trading with the ADX indicator is that it is a lagging technical analysis tool. This means that the signals come late, and sometimes you lose part of the movement. Thus, it is better to find entry points using other tools and look at ADX simply to confirm your suggestions.
ADX Indicator Recommendations
Here are some recommendations when using the ADX indicator:
- Confirm trend strength: Use the ADX indicator to determine the strength of a trend. Higher ADX values (typically above 25) suggest a stronger trend, increasing the likelihood of a continuation. Confirming trend strength can help identify potential entry or exit points.
- Combine with other indicators: Consider using the ADX indicator in conjunction with other technical indicators to enhance your analysis. For example, combining ADX with moving averages or oscillators like the Relative Strength Index (RSI) can provide additional confirmation of trend strength or potential reversals.
- Identify potential trend changes: Look for divergences between price and the ADX indicator. If the price is making higher highs, but the ADX is making lower highs, it could indicate a weakening trend and a potential trend reversal. Divergences can serve as early warning signs of a possible change in the market direction.
- Utilize ADX crossovers: Pay attention to the crossovers between the +DI (positive directional indicator) and -DI (negative directional indicator) lines. When +DI crosses above -DI, it may signal a bullish trend, while a crossover in the opposite direction could indicate a bearish trend. Additionally, watch for the ADX line crossing above 25, as it may suggest a strengthening trend.
- Adjust settings for different timeframes: The default period for the ADX indicator is typically 14. However, you can experiment with different settings to suit your trading style and timeframe. Shorter periods, like 7 or 10, can provide more sensitive signals for short-term trading, while longer periods, like 20 or 30, are better suited for identifying longer-term trends.
Remember to use the ADX indicator as part of a comprehensive analysis and consider risk management strategies along with other technical or fundamental factors when making trading decisions.
ADX Pros and Cons
Find the advantages and disadvantages of using the ADX indicator below:
Pros of the ADX Indicator:
- Simple Graphical Presentation: ADX is visually straightforward, making it easy for traders to interpret.
- Clear Interpretation: It provides clear messages and signals about trend strength.
- Few Parameters to Configure: ADX requires minimal parameter adjustments.
Cons of the ADX Indicator:
- Weaker Quality Signals on Lower Intervals: On shorter timeframes (for testing purposes), ADX may generate weaker signals.
- Excludes Sideways Trends: ADX is less effective during sideways or range-bound market conditions.
Remember that while ADX quantifies trend strength, it doesn’t indicate trend direction. Traders often use ADX readings above 25 to identify strong trends suitable for trend-trading strategies. Conversely, when ADX is below 25, trend-trading strategies are often avoided. Keep in mind that no single indicator is perfect, and combining ADX with other tools can enhance your trading decisions.
Final Words
ADX is a rather complex technical analysis tool that allows you to watch the current trend and even measure its strength. When applying it to your strategies, you can find a lot of useful information, but you should also be aware of the drawbacks of this technical analysis tool.
FAQ

What is the ADX indicator?
The Average Directional Index (ADX) is a technical analysis tool used to measure the strength of a market trend.
How is the ADX indicator calculated?
The ADX indicator is calculated by smoothing the price data to determine the directional movement, calculating the positive and negative directional indicators (+DI and -DI), and then calculating the ADX line based on the relationship between these indicators.
What does the ADX value indicate?
The ADX value indicates the strength of a trend. Higher ADX values suggest a stronger trend, while lower ADX values suggest a weak or indecisive trend.
How is the ADX indicator interpreted?
Traders can interpret the ADX indicator by looking at its value and its relationship with other lines. A rising ADX suggests a strengthening trend, while a falling ADX suggests a weakening trend. Additionally, the direction of the +DI and -DI lines can provide further insights into the potential direction of the trend.


