Will EUR/USD Resume Its Uptrend?

The last week was positive for EUR/USD and most other assets trading against the US dollar as traders and investors have received another confirmation from the Fed to cut rates in September. Moreover, market participants expect the FOMC to be even more aggressive in cutting rates in order to avoid recession.
This week there will be a couple of data releases from the Eurozone with German monthly inflation to be published on Wednesday. According to the latest forecasts, monthly CPI in the strongest European economy is likely to slow down to 0.0%. When it comes to the Eurozone’s aggregate yearly inflation, it is expected to decelerate to 2.2% from 2.6%.

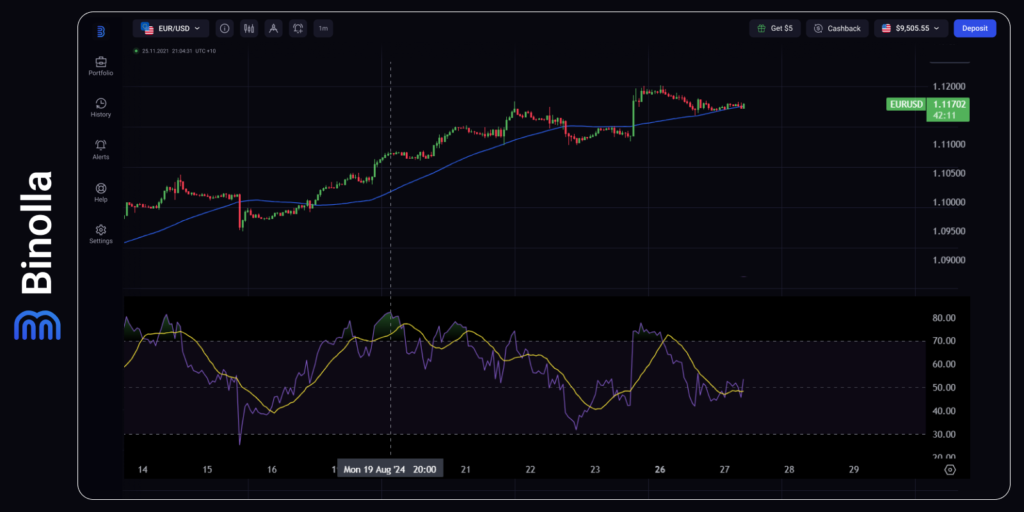
On the technical side, EUR/USD keeps surging above the SMA 50. The currency pair is testing this moving average currently and if the SMA 50 holds, then EUR/USD is likely to make another portion of growth to break 1.1200.
On the downside, if EUR/USD breaks below the SMA 50, then the closest round number will be 1.1100, which prevents the pair from testing the psychological 1.1000 level.
The RSI indicator is currently neutral as the line resides between the overbought and oversold areas.
Contents
GBP/USD Aims Higher as the US Dollar Loses Ground
The British pound aims higher as investors and traders expect the Federal Reserve to start a new round of expansionary monetary policy in September. While there is almost no doubt that the FOMC members will unanimously vote for a 25 bps rate cut, some economists expect the Federal Reserve to make a 50 bps cut and two more cuts during the remaining meetings in 2024.

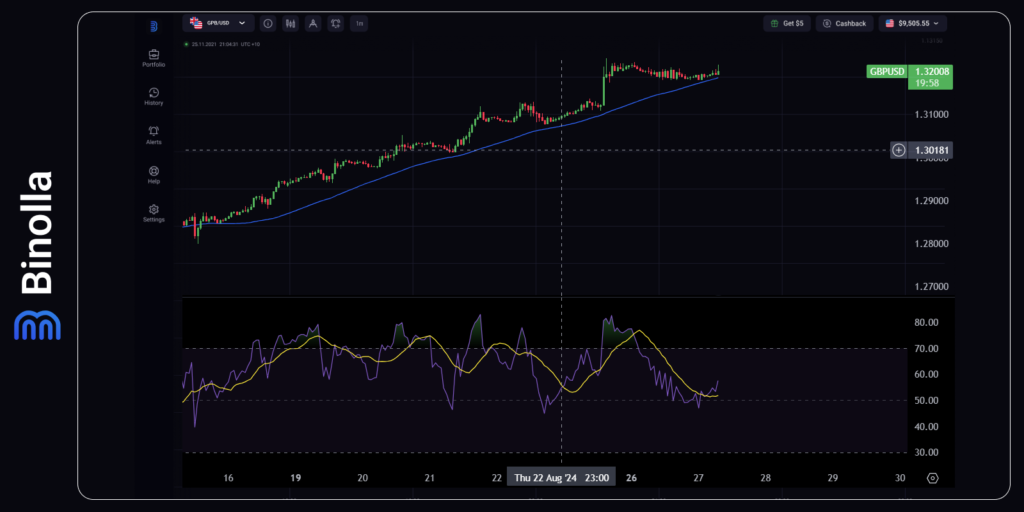
GBP/USD stays above the SMA 50, which confirms that the currency pair is in the uptrend. Currently, the pair tests the moving average. If the line manages to keep the price from getting lower, we can expect GBP/USD to move above 1.3231, which is the closest local high.
On the other hand, if the moving average fails to deter the currency pair from moving lower, the closest support will be at 1.3132. When it comes to the RSI indicator, it is neutral as the line is in the middle of the indicator’s window.
AUD/USD is Steady on the Eve of Australian Inflation Data
The Australian yearly CPI data for July is going to be released on Wednesday. According to economists, inflation is likely to slow down from 3.8% to 3.4%, which is another argument for the RBA to cut rates. However, what is even more important is the general USD downtrend, which is supported by the upcoming Fed rate cut that is likely to be made in September 2024.

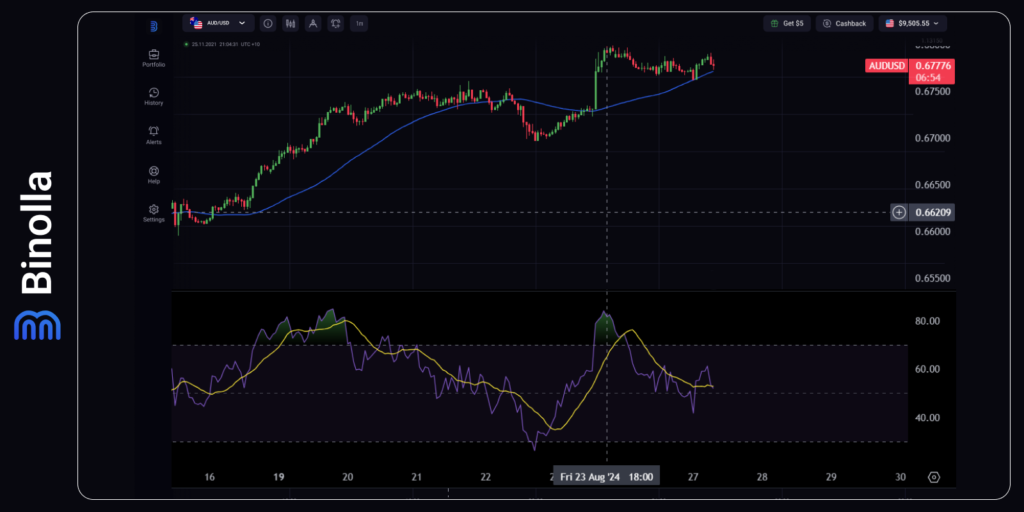
When looking at the hourly chart, AUD/USD stays above the SMA 50, which indicates an uptrend. Currently, the currency pair tests the moving average and if the price rejects it, AUD/USD is likely to test 0.6790, which is the closest resistance level before the local high, which is at 0.6800.
On the downside, the SMA 50 prevents the currency pair from getting to 0.6750, which is the closest support level. The RSI indicator is neutral as the line resides in the middle of the indicator window between overbought and oversold areas.
USD/CAD is Trying to Resume the Downtrend
Canadian monthly GDP data will be released on Friday. According to forecasts, Canadian economic growth is likely to lose 0.1% in July, which is a negative sign, meaning that the BoC may reconsider its monetary policy again this year.

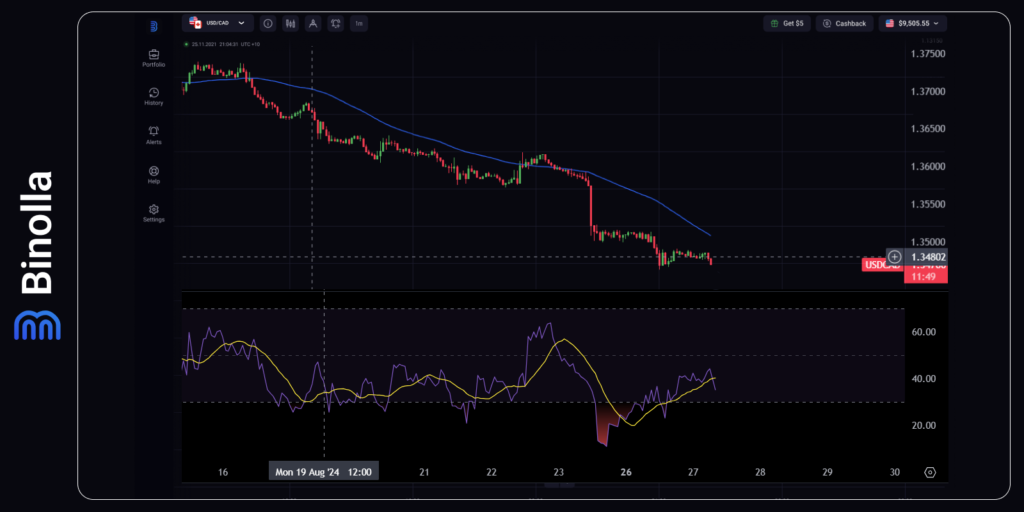
USD/CAD stays below the SMA 50 on the hourly chart. The currency pair moves downwards and resumes the downtrend currently as a small sideways correction is finished. The closest target below is 1.3465. After breaking it, USD/CAD will aim at 1.3400, which is a round level. On the upside, the currency pair can retest the descending SMA 50.
The RSI indicator is neutral. The line left the overbought area on Monday and currently, it resides in the middle of the indicator chart.


