Weekly Currencies Technical Analysis

The week ahead promises a lot of volatility moments as there are plenty of data releases from both sides of the Atlantic Ocean. We have already reviewed them in our fundamental analysis article. By going through this article, you will find out more about current technical trends in the most popular currency pairs.
Contents
EUR/USD

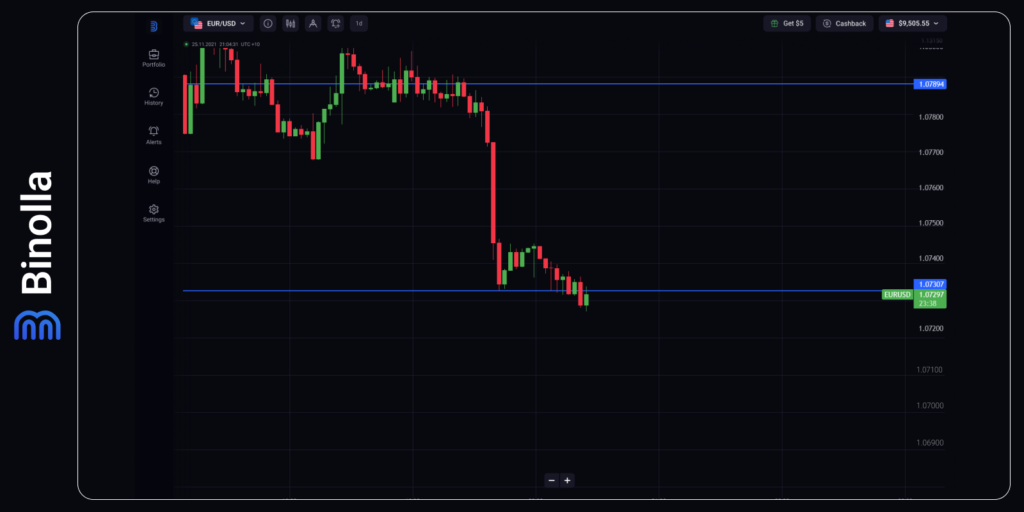
EUR/USD continues to face downward pressure, hovering near a weekly low below 1.0750. The recent surge in the US Dollar, propelled by robust US ISM PMI data, is weighing on the pair, contributing to investor apprehension ahead of the release of key German inflation data.
The closest support level is 1.0730, which is tested by EUR/USD currently. If the currency pair breaks it, the next support will be a round number at 1.0700, which is another defensive bastion for buyers. On the other hand, should the currency pair remain above 1.0730, the chances of retesting 1.0750 will be significantly higher.
GBP/USD
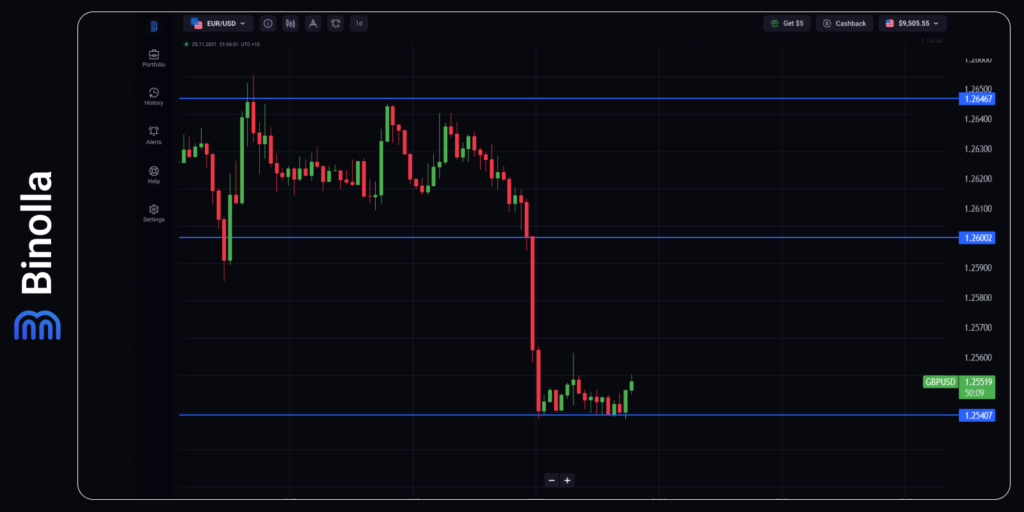
During Tuesday’s European session, GBP/USD persists in a defensive stance near 1.2550. The US Dollar maintains its strength supported by robust US ISM data and a cautious market sentiment, exerting downward pressure on the pair. Attention now shifts to the US JOLTS survey and forthcoming comments from Federal Reserve officials.

After falling below 1.2600, GBP/USD moved straight to the middle of the 1.2500-1.2600 range and even managed to slide below. Currently, GBP/USD is testing 1.2540. The currency pair bounced off this level with a couple of green candlesticks, but the selling pressure still remains strong. The breakout of 1.2540 will allow GBP/USD to target 1.2500 while staying above this level will pave the road to 1.2550 and even higher to 1.2600.
USD/CAD
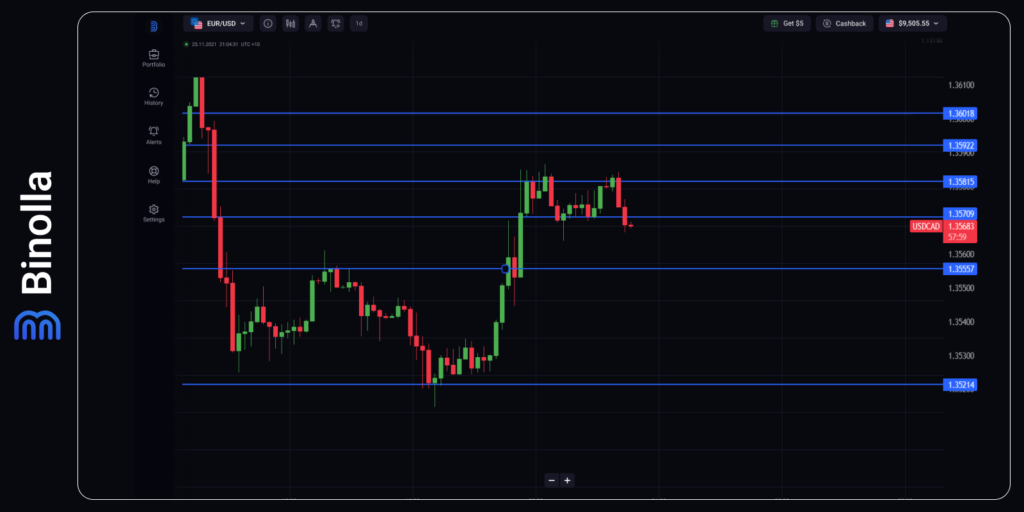
For the second consecutive day on Tuesday, the USD/CAD pair garners interest from buyers, aiming to extend the rebound initiated from the 1.3515 region, marking a one-week low. Presently, spot prices hover around the 1.3580 level, sustained by continued US Dollar buying momentum. However, the potential for further gains could be limited by the bullish trend in Crude Oil prices.

The currency pair had some upside potential at the beginning of the new month. However, we have a clear double top price pattern on the chart, which indicates the possible reversal towards 1.3550. If this support is broken, the next target will be at 1.3520.
Several levels above prevent the price from getting higher. In particular, the two closest resistance lines reside at 1.3570 and 1.3580. Should USD/CAD break them, the currency pair is likely to test 1.3600.
BTC/USD
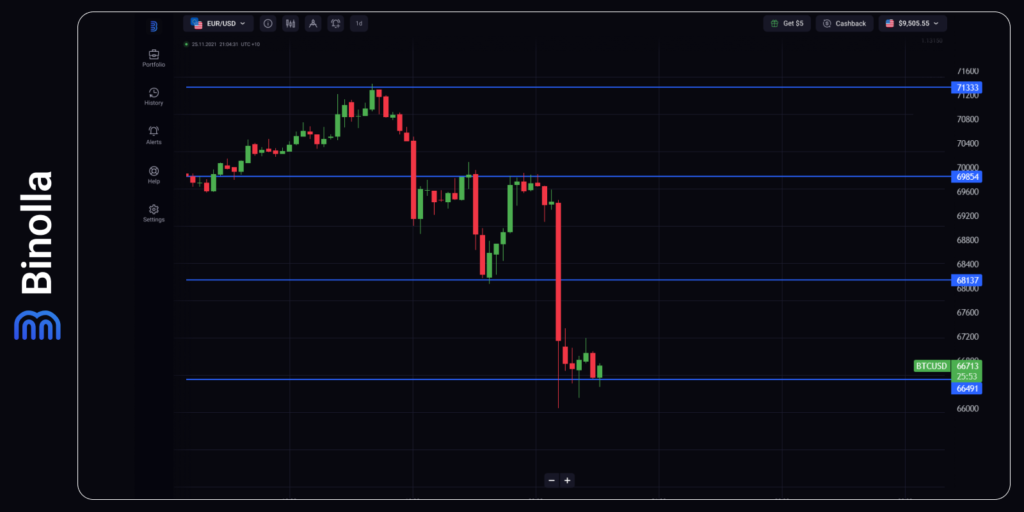
In the early hours of the US session, Bitcoin (BTC) experienced a notable price decline, leading to significant losses for numerous positions. Trading volumes have been subdued as markets resume activity following a prolonged weekend, influenced by the Easter holiday. With the advent of April, the focus intensifies on the countdown to the halving, emerging as a prominent headline, as retail investors are already adjusting their positions accordingly.

BTC/USD seems to find support at 66,490 after a serious price dump that took place on April 1, 2024. The currency pair is currently testing this level and if bears are able to push BTC/USD through it, the next support will be close to 66,400.
When it comes to upside potential, the key target for the bulls is to reach 70,000, from where they will be able to renew all-time highs and pave the way to 80,000.


