Using Fibonacci Retracement Levels in Digital Options Trading Strategies

Fibonacci retracement is an undervalued technical analysis tool that allows traders to find corrections and use them to open positions or to add to the existing ones when trading digital options, Forex or stocks. It is a powerful indicator that can be used by market participants in most trading scenarios. Knowing how to use Fibonacci retracement, a trader can significantly improve their trading results.
By reading this article, traders will discover the key aspects of Fibonacci retracement and learn how to add it to charts. We will also cover some basic strategies. If you already know some Fibonacci strategies, you can apply them when trading with Binolla!
Contents
Why Fibonacci?
Leonardo Fibonacci is an Italian mathematician, born in 1170 in Pisa (according to some sources). He is famous for introducing a sequence of numbers, known as the Fibonacci sequence, where each next number is the sum of the two previous ones that he took from Indian merchants. Some studies point to the fact that this sequence was known in India from 700 BCE.
The sequence begins with 0, 1, 1, 2, 3, 5, 8, 13, 21, 34, 55, 89, 144. Moreover, according to the Fibonacci golden ratio, any number in this sequence divided by the previous one will be close to 1.618, which is often used in architecture, art and most sciences. Da Vinci, for example, used this sequence and the golden ratio in his works.
Now you may have a question about how this knowledge may help you in trading. A special drawing tool, known as Fibonacci retracement was developed based on this theory. It includes 23.6%, 38.2%, 50% 61.8% and 100%, which are the main levels where retracement may take place. If you look at this sequence, you will notice that 61.8% may be familiar to you. The golden ratio is 1.618. Traders took it and transformed it into percent in the Fibonacci retracement tool.
The main level there is 1.618 or 61.8% (in some variations percent is used instead of the number). Other levels appear after further calculations. 38.2%, for instance, is the result of dividing the number of the sequence (144, for instance) and another number located two spots to the right (55). These levels will appear once one adds the tool to the chart.
Why Does Fibonacci Work in Trading?
Ralph Nelson Elliott, the famous inventor of the wave theory, noticed in the 1930s that the movements of stock indices show a 1.618 ratio. Therefore, Elliott combined how way theory with the Fibonacci sequence to strengthen his strategy.
Other traders revealed that market corrections often correspond to 23.6%, 38.2%, 50%, 61.8% and 76.4%, which are also part of the Fibonacci sequence. They were called Fibo levels and became a part of modern technical analysis.
How to Add Fibonacci Retracement to the Binolla Chart
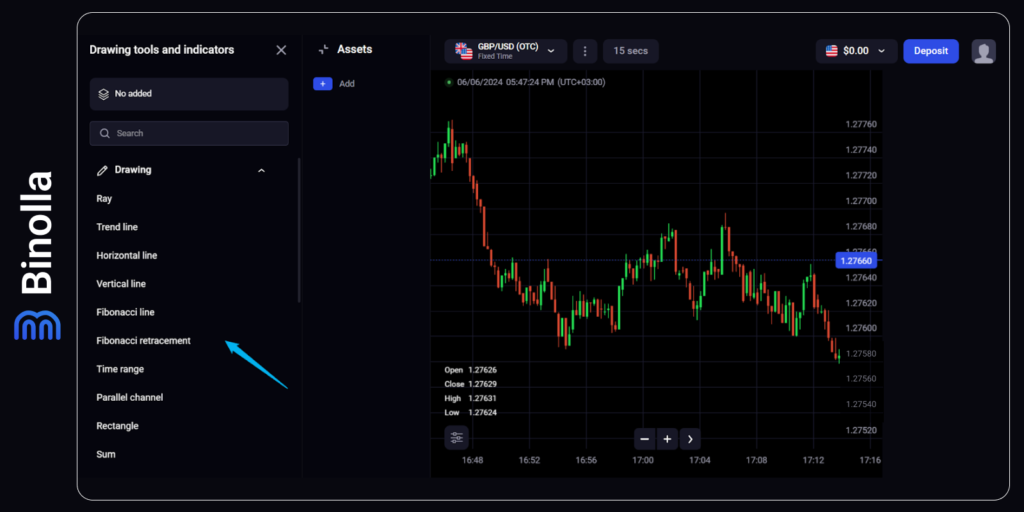
The process of adding the indicator to the chart is pretty much simple. A trader needs to go to the Tools section and then choose Drawing once they are on the Binolla platform. In the dropdown menu, a trader should choose Fibonacci retracement. Once all these steps are done, the indicator will appear in the chart.
However, unlike most technical indicators that are built automatically, Fibonacci requires some action from a trader. By simply adding it to the chart, you will not be able to use it properly. Therefore, some adjustments should be made.
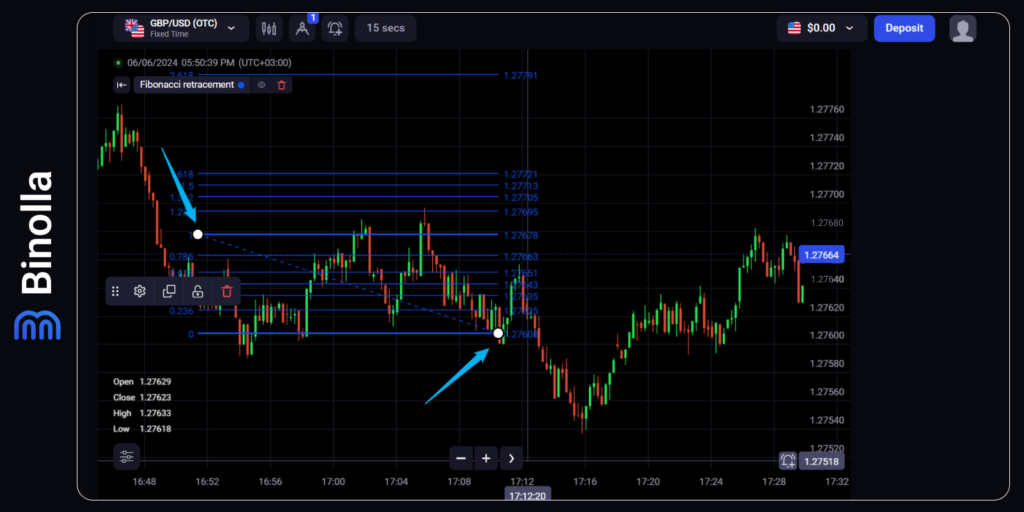
In order to set up this indicator, you should drag white points and set the lines accordingly. Here is one of the best ways to adjust Fibonacci retracement.
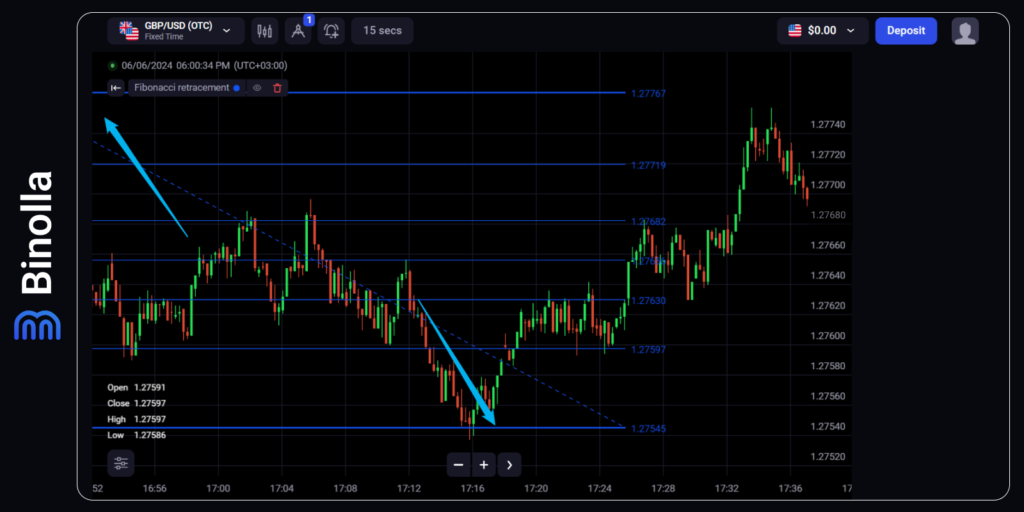
One should place the grid from high to low in the downtrend and from low to high in the uptrend. As you can see, we have already added the indicator and even stretched it according to the rules. Now you can see that the levels are in place and the price hits them from time to time. As a new candlestick appears, you can stretch the Fibonacci retracement indicator to adjust it to your current needs.
What you can see now are levels. You can build them on your own by using the Horizontal line tool on the Binolla platform. However, Fibonacci is considered a more precise tool as it uses the golden ratio approach. Moreover, by using this tool, one can see the corrections and retracements along the trend or during reversals.
How to Use Fibonacci Retracement in Trading
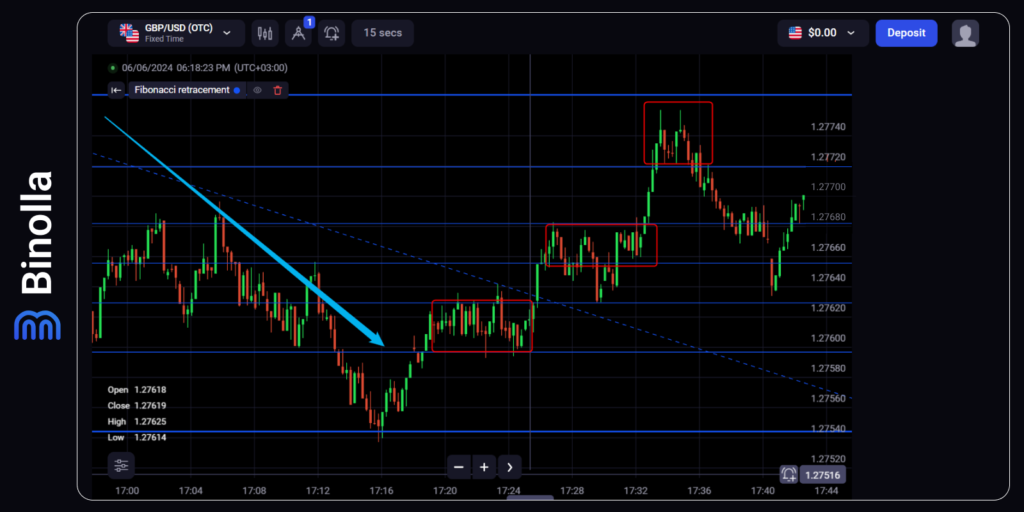
After adding and adjusting the Fibonacci retracement tool to the chart, one will see that the price often returns to its levels. This information can be used by a trader in different ways. They can, for instance, open positions along the new trend or find key reversal points in case of corrections.
In the example above, we have a complete reversal as the price gradually reaches new Fibonacci retracement levels after a downtrend (that we have used to adjust the retracement).
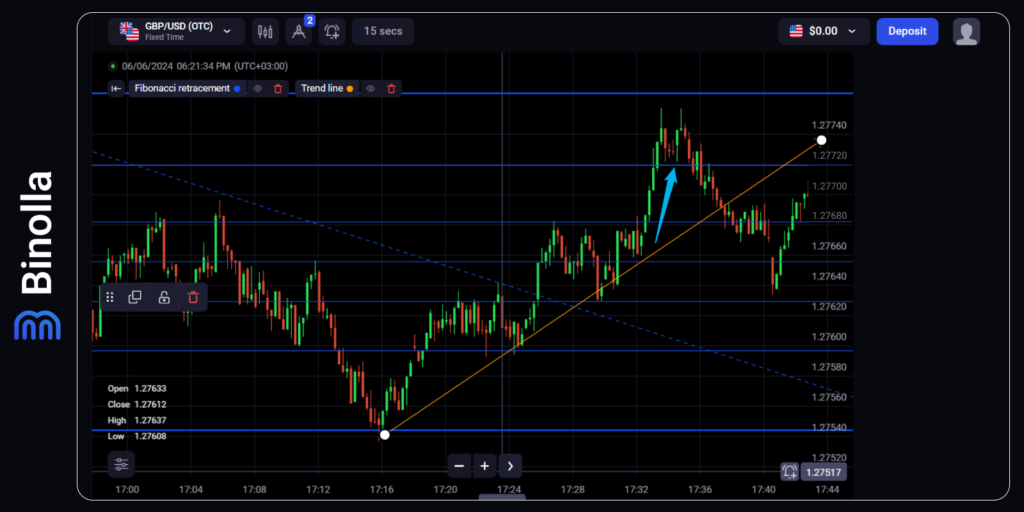
Now if we add an ascending trendline, we can see that Fibonacci levels allow us to predict where a correction to the uptrend may start. Moreover, it allows Forex traders to set trading goals properly or even place stop losses. When it comes to digital options, the tool is equally useful, but this time, you don’t even need to think about goals as the payouts are fixed when trading these contracts.
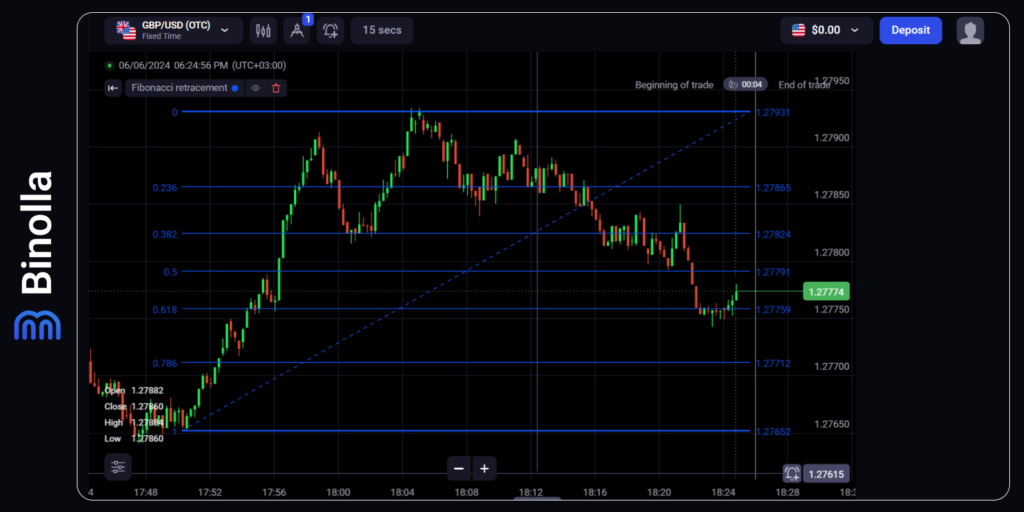
If we reverse the situation and build retracement during the uptrend (stretching it from the lowest to the highest points), we will see that it works the same way. The difference is that the price corrects downwards, which means that the key levels will be support lines.
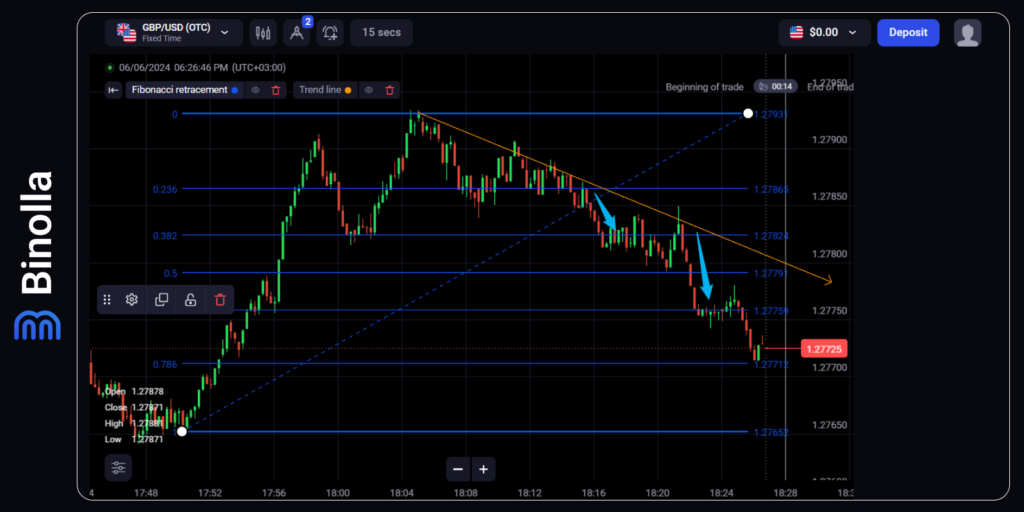
We can also add a trendline and find some entry points allowing traders to go short in Forex/stocks, or simply buy a Lower contract. What is important here is that the indicator still allows market participants to set goals and pinpoint eventual stop loss levels. For digital options traders, this is a good tool for finding entry points. The rest is unnecessary as these contracts have fixed payouts and risks.
Key Pros and Cons of the Fibonacci Retracement Indicator
Before switching to the most popular strategies that one can use to trade with the Fibonacci retracement indicator, we are going to provide you with some key features. Some of them are listed below:
- Identifying reversals. Fibonacci is among the strongest tools to help traders identify potential market reversals. This helps both swing and intraday traders to find entry points along the new trend. The areas that the Fibonacci indicator builds are also known as support and resistance;
- Cross-market application. Traders can use this technical analysis tool across different markets and financial instruments. Fibonacci retracement is equally good for forex, stocks, commodities and cryptocurrencies. Digital options traders can use this tool as well;
- Finding entry points. With the Fibonacci retracement indicator, one can find entry points in every direction of the market. The key levels allow market participants to buy various types of contracts during a trend movement or even in times of correction. For FX traders, Fibonacci is also a great tool allowing them to set stop losses and pinpoint price movement targets;
- Combining with other technical indicators. Similar to moving averages or Bollinger Bands, Fibonacci retracement works better when combined with other technical analysis methods and indicators;
- Multi-level analysis. Instead of having a single support or resistance level, traders can use several lines to find trading signals. This will allow you to see the depth of corrections as well as plan your trading more carefully and thoroughly;
- Historical data. All Fibonacci retracement levels are based on historical data reflecting previous areas of interest.
While there are a lot of advantages, some disadvantages can also be pinpointed. They include:
- No fundamental analysis. When using Fibonacci retracement, all your forecasts are based on technical analysis and they do not include fundamentals such as central banks’ decisions, inflation, economic growth, company reports, etc.;
- Fibonacci levels reflect the consequence without being adjusted to a particular asset. While this is a universal tool, the results are not always relevant;
- Investors can make mistakes as technical analysis is always subjective. Levels can shift that may lead to losses.
Fibonacci Retracement Trading Strategies
The Fibonacci retracement indicator offers a lot of trading opportunities to digital options, FX, or stock traders. With a lot of strategies where Fibo is combined with other indicators, you can always find something that suits your trading style. Find some basic tactics described below.
Fibonacci Retracement Strategy with RSI
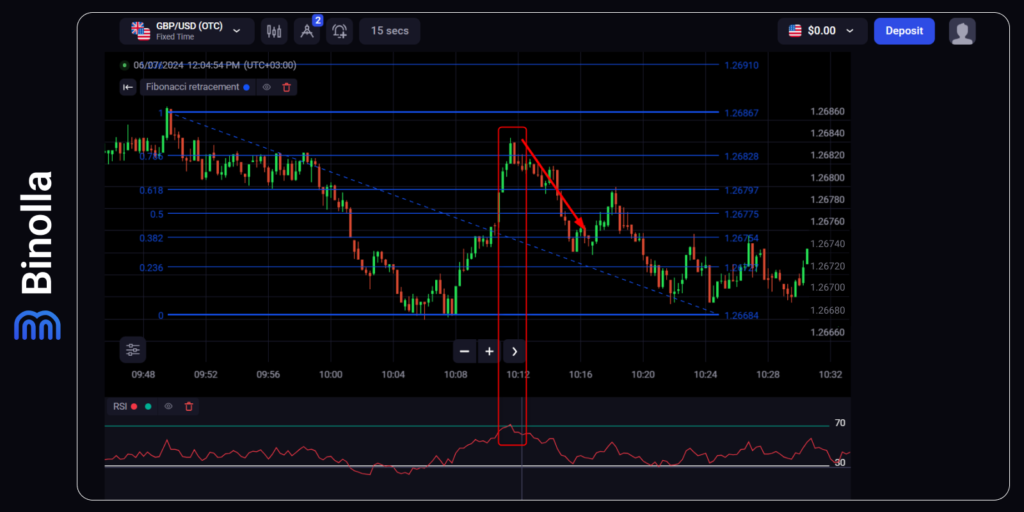
While Fibonacci retracement can be used alone, to be more sure about entry points, traders are better off combining it with other indicators and trading methods. In the first example, we have brought together Fibo and the RSI indicator.
The idea is simple. The indicator indicates corrections or reversals. Digital options traders can use both to buy contracts. In this particular example, the RSI line leaves the overbought area (which is above 70), which hints at the probability of a reversal or a downside correction. A trader buys a Lower contract once the line crosses the 70 level. For Forex traders it is essential to set stop loss levels as well. In this particular case, one can protect their position by setting stop losses above the Fibonacci level where the reversal takes place.
MACD and Fibonacci Strategy
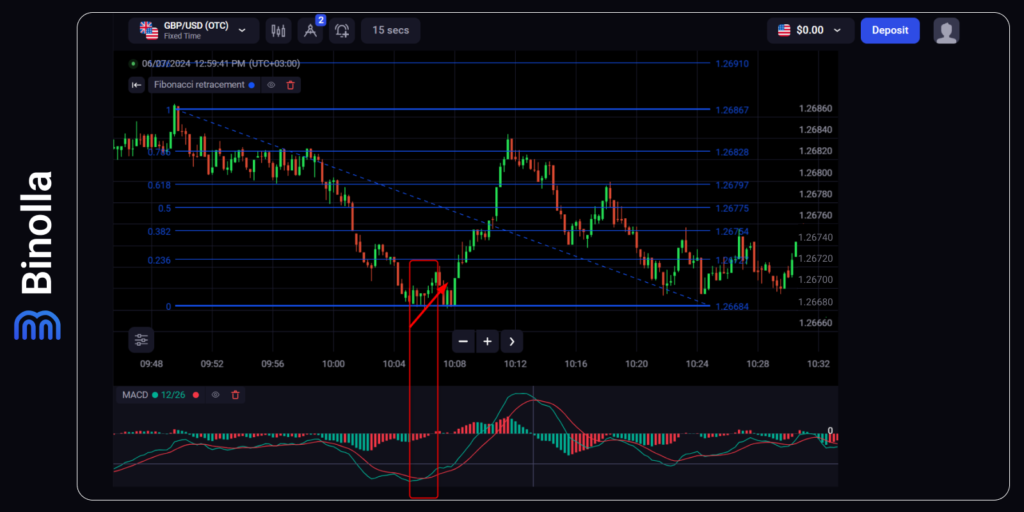
MACD is a famous technical indicator that traders use to check the power of a particular trend as well as its direction. When combined with Fibo, it becomes a powerful tool allowing market participants to find reliable entry points.
The idea of the strategy is to find confluence when the price is rejected by one of the levels and the MACD moving averages cross each other. In this particular case, moving averages have a crossover below the histogram of the MACD indicator, which is a buy signal. Moreover, the support level prevents the price from going lower, which is a confirmation of this signal.
A digital options trader can buy a Higher contract once both signals arrive. FX and stock market traders can buy a currency pair or a share and place stop losses somewhere below the support line formed by a Fibo level.
Using Fibonacci with Japanese Candlesticks
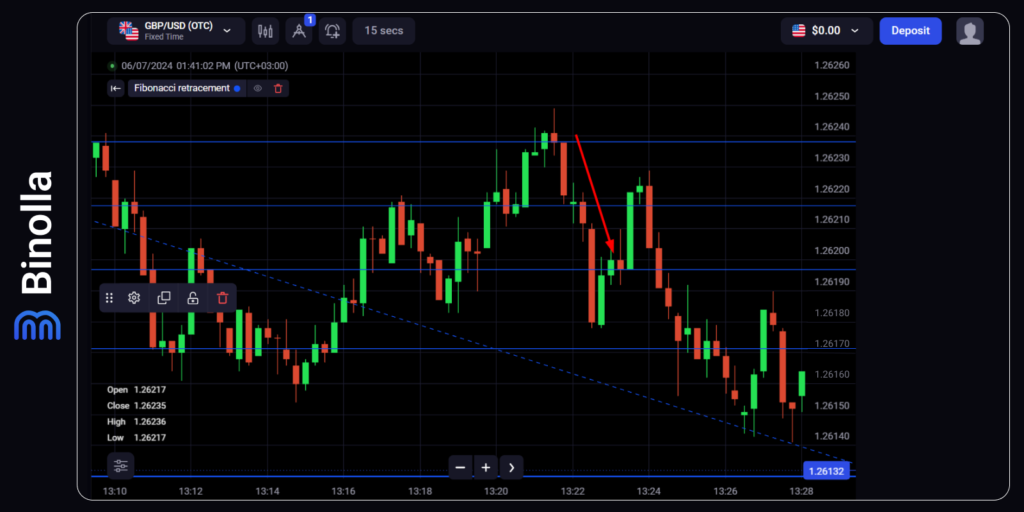
Those who have an understanding of how candlestick patterns work may use them to find entry points along with the Fibonacci retracement indicator. The simplest way is to find reversal candlesticks when the price bounces off levels. The example above demonstrates how a trader can buy a Lower contract by simply finding a reversal candlestick at the resistance level.
The trade can be placed right after the red reversal candlestick is closed. For Forex traders, this is an opportunity to go short. Stop losses can be placed right above the Fibo level.
Conclusion
Fibonacci retracement is a powerful technical analysis tool that allows traders to find support and resistance levels calculated with a famous Fibonacci sequence and golden ratio. This indicator is easy to apply and needs minor adjustments in the future. There are plenty of strategies that traders can use after drawing Fibonacci retracement.
FAQ
What is the Fibonacci Retracement Tool?
This is a technical analysis indicator that traders use to draw support and resistance lines. Unlike classic support and resistance levels that are drawn based on price highs and lows, these ones are calculated using a sequence, known as the Fibonacci sequence.
How Fibo Retracement Levels Are Calculated?
Levels are calculated by dividing the next number of the sequence by the previous one. Once calculated, the levels offer a deep insight into the market situation.
Why Are Fibo Levels Important in Trading?
These levels allow traders to find areas where price direction changes are possible with higher probability.
Can I Use Fibonacci Retracement for Various Assets?
Yes, you can. Traders apply this indicator to different classes of assets, including currencies, stocks, commodities, and many others. Moreover, digital options traders can also use this indicator to buy contracts with higher precision.
What is Fibonacci 0.618 Level?
This is the key level in the Fibonacci retracement tool marking the difference between the correction and a new trend.
What Fibonacci Strategy is the Best?
There is no best strategy as every trader uses their own set of tools to trade with Fibonacci. Some can add MACD, while others trade with the RSI indicator. Keep in mind that whatever strategy you use, you should follow money and risk management rules.


