Trendline: How to Draw and Use It

Trendlines are the alpha and omega of most trading strategies that can be applied in digital options trading. While they are the easiest way to define the current market trend, they are very useful and helpful and can be considered one of the most powerful analysis tools so far. By reading this article, you will learn more about trendlines and how to apply them in your trading routine. You can also start trading right now by creating an account at Binolla.
Contents
- 1 Trendline Basics: What It Is and How It Works
- 2 Why Are Trendlines Important?
- 3 How to Understand a Trendline
- 4 How to Draw a Trendline Correctly
- 5 How to Use Trendlines Properly
- 6 Trendline Fake Breakouts
- 7 Try to find trends and capitalize on them with Binolla!
- 8 Using Trendlines to Define Market Trends
- 9 Using Trendlines to Define End of Trends
- 10 Trendlines: How to Time Your Entries
- 11 Trend-Following and Breakout Strategies
- 12 Trendline: Tips and Tricks
- 13 Drawing Trendlines: Pros and Cons
- 14 Final Words
- 15 FAQ
- 15.1 What is a Trendline in the Financial Markets Analysis?
- 15.2 How to Build a Trendline on Charts?
- 15.3 When Should You Use a Trendline?
- 15.4 Does a Trendline Guarantee 100% Results in Trading?
- 15.5 Which Technical Indicators Can Be Used Along with a Trendline?
- 15.6 How Do You Know that the Trend is Strong?
Trendline Basics: What It Is and How It Works
A trendline is a special, easily recognizable line on the chart that “underlines” trends. It connects a series of prices together to make it easier for traders to see the current direction of price fluctuations. A trendline should be drawn over pivot highs or below pivot lows to show the prevailing market trend.
Traders normally use trendlines as the basic analysis tool that they apply to conduct market analysis. They can be used as a standalone tool or in combination with support and resistance, various technical indicators, and even the Japanese candlestick analysis method (aka price action) to find entry points.
Being one of the most important tools in technical analysis, trendlines help traders define the current direction of movement without resorting to macroeconomic data or other fundamentals. Therefore, traders don’t need to spend a lot of time learning more about the fundamental factors that influence price fluctuations.
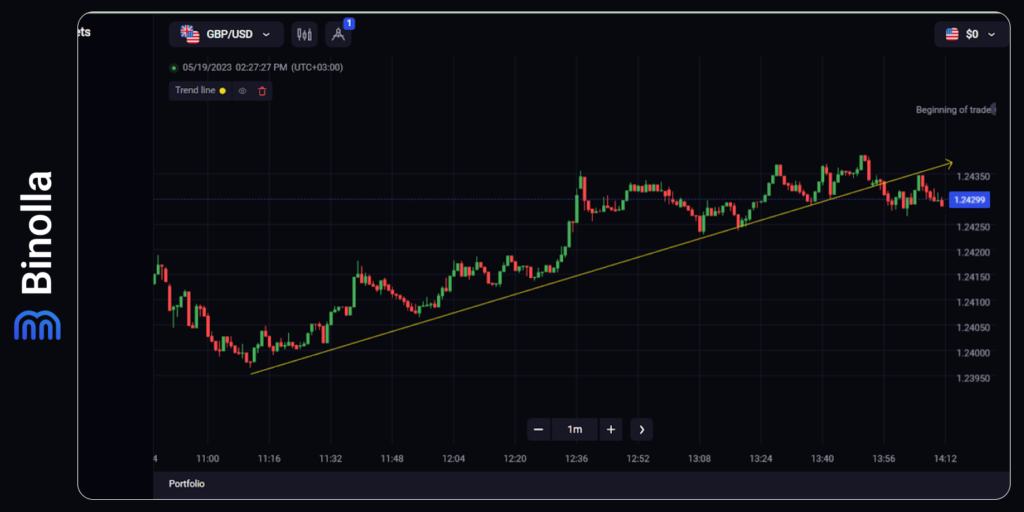
Drawn below pivot lows, it helps define the uptrend on the chart and even shows traders the best points to enter the market. While you may still not be able to say anything about what is currently happening on the chart, by further reading this article, you will see how to benefit from this simple tool.
The most important thing about trendlines is that they are not only telling you about the direction of the price. They also give you some hints on when and where to buy fixed-time contracts or other financial instruments.
Why Are Trendlines Important?
Trends are crucial for traders. Prices are often trending, and it is very important for traders to understand in which direction the price fluctuates. If you know the current trend, you can use this information to open trades using the general market forces as allies.
What happens if a trader does not know the current trend?
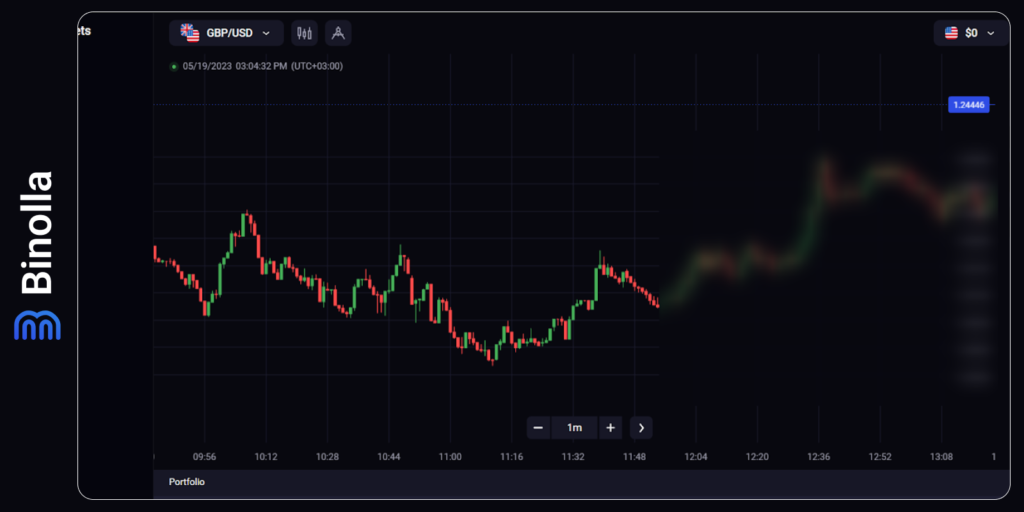
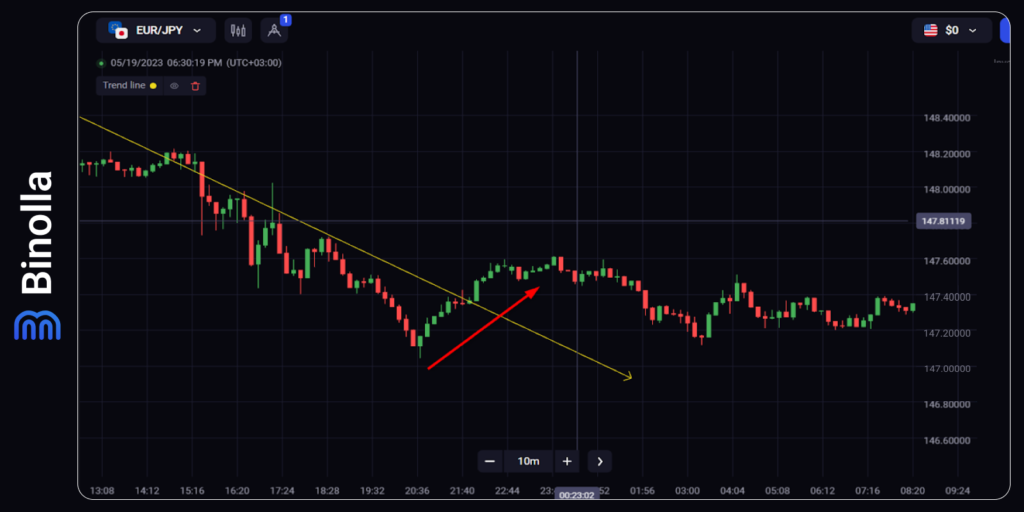
If you take a look at the image above, you will see that the price goes down for some time, and this may be a good idea to buy a Lower option or sell a currency pair. It seems logical to make this decision, but only before you draw a trendline.
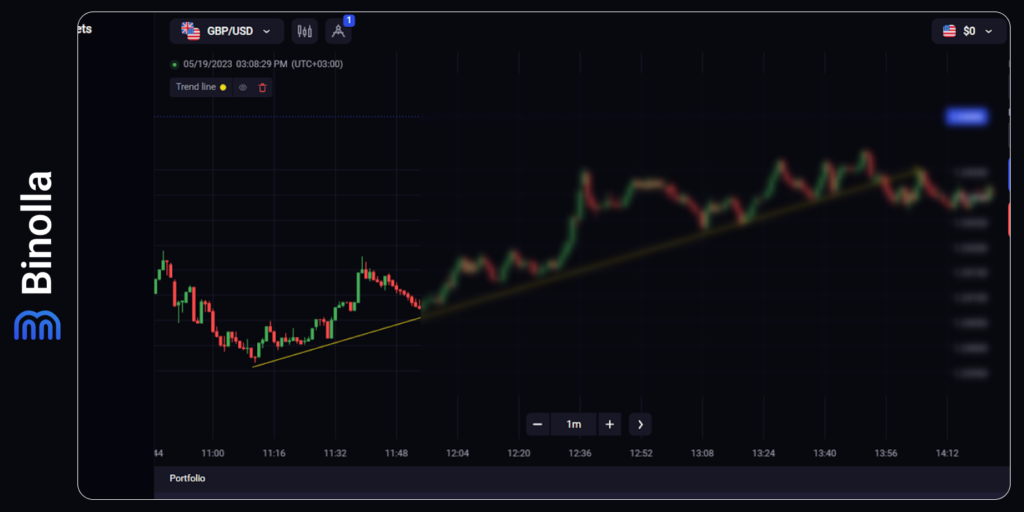
Once the trendline is in place, you will see that the price is going to meet it exactly at this point. Therefore, you can expect it to bounce off the trendline and continue growing. And if you look at what happens next, you will see that the uptrend continues. Therefore, by buying a Lower contract or selling the currency pair, you would lose.
How to Understand a Trendline
The idea behind trendlines is very simple. They connect the consecutive pivot highs and lows. The descending trendline represents a set of consecutive decreasing pivot highs, while the ascending one is drawn through consecutive growing pivot lows.
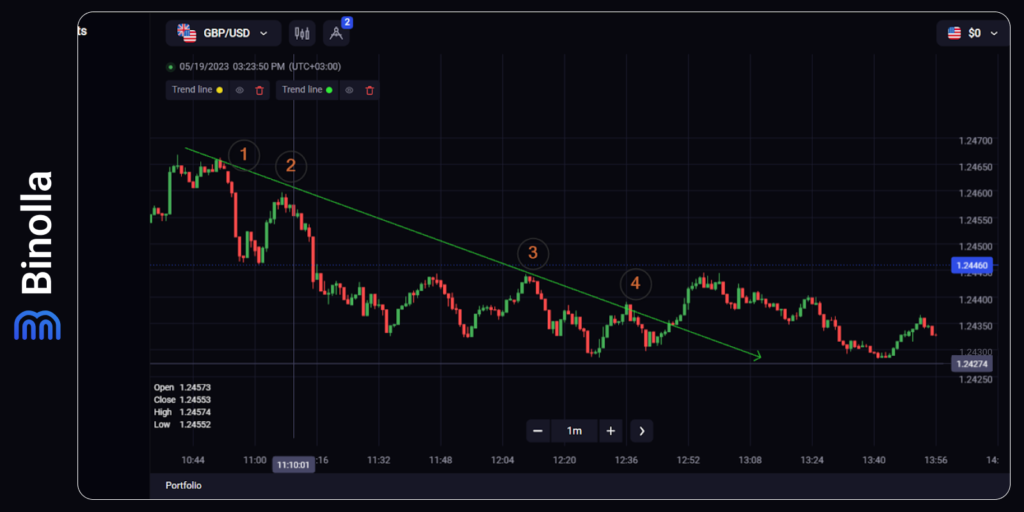
If you take a look at the image above, you will see that the descending trendline connects price peaks that are constantly decreasing. The first peak is higher than the second, the second is higher than the third, and the third is higher than the fourth. This is what a classic descending trendline looks like.
The same is true for the ascending one.
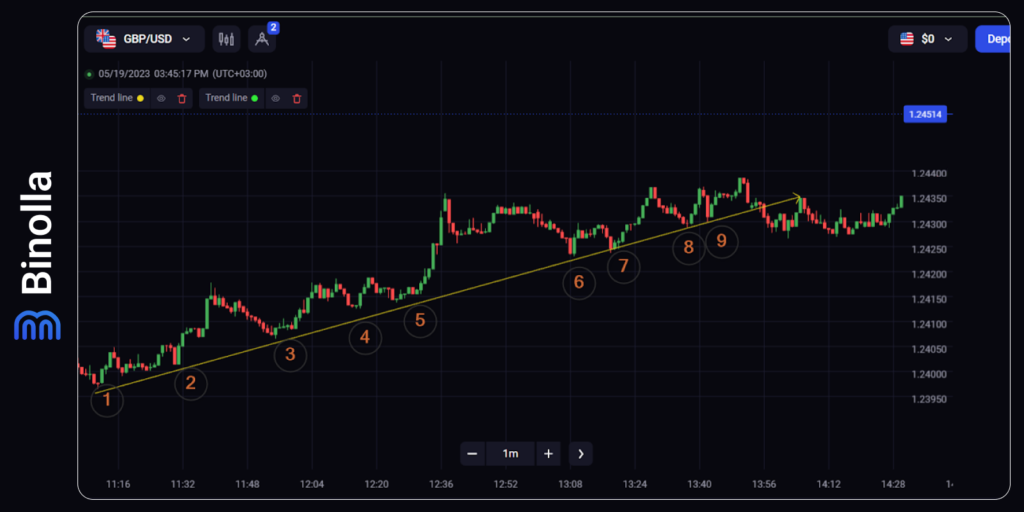
The image above shows consecutive growing lows that allow you to build a proper trendline and, what is even more important, use it to define the current market trend and even find some great entry points.
How to Draw a Trendline Correctly
We have already shown a couple of examples of the trendline above in this article. You may already have an idea of how to draw it. However, there are some important things that should be mentioned in order to build this line correctly.
The first secret of a proper trendline is that it should have two starting points (not one!). When you draw a line through these points, you will see that the price will later go back to this line (and may return to it even many times), offering you several trading opportunities. To learn more about how to draw trendlines on the Binolla platform, you can read this article.
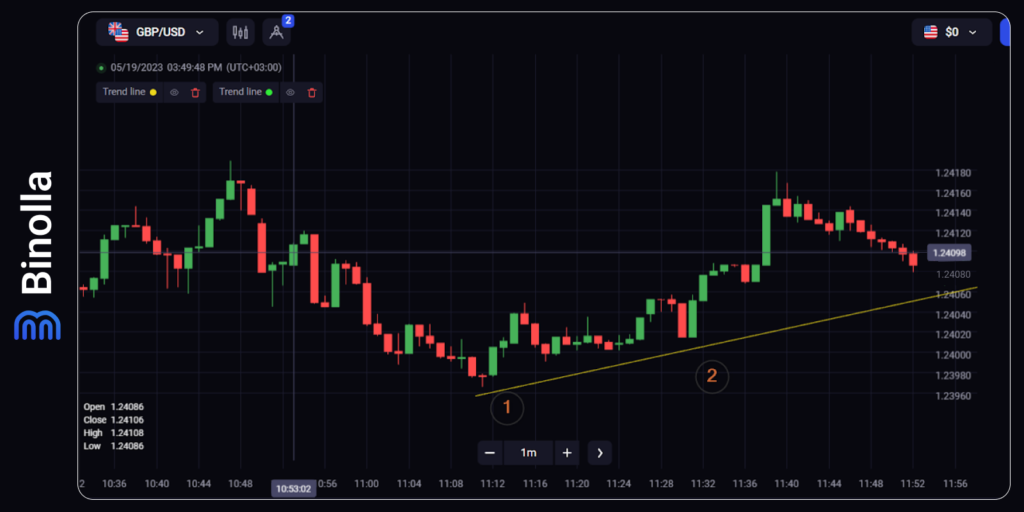
Here is an example of how to draw an ascending trendline. First, you need to find two pivot lows, where the second is higher than the first one. Next, you need to draw a line from the first to the second. Keep in mind that the trendline should go further so that you can see when the price will meet it in the future.
One question that may arise here is how accurate the trendline should be. The truth is that you can’t make it 100% accurate, because even if it goes right through the first two points, there is no guarantee that the price will meet it exactly in the third one. Therefore, when building a trendline, you should be as accurate as possible, but don’t waste too much time on drawing! To find entry points, you will definitely need some more tools. Therefore, the trendline should be illustrative above all.
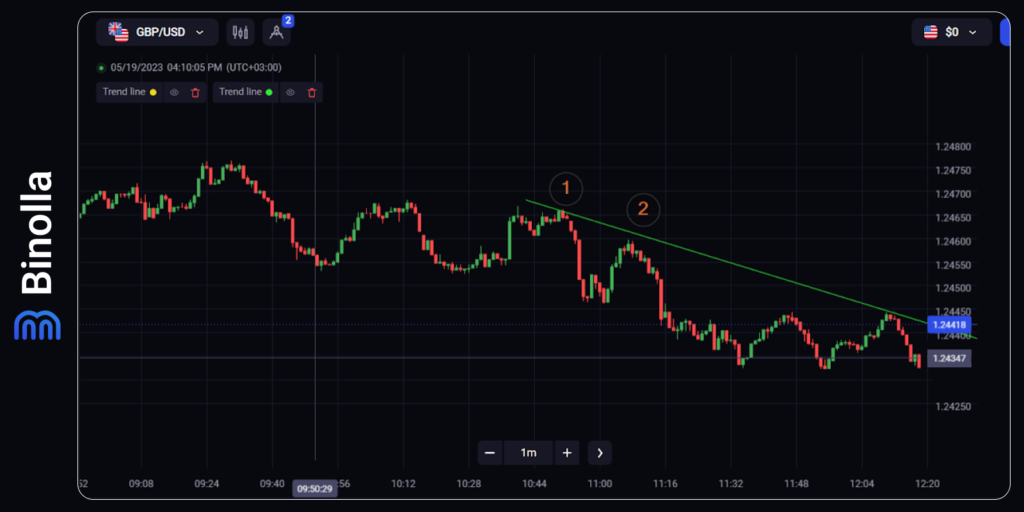
To draw a descending trendline, you should do the opposite of what you did to build the ascending one. Now you need to find the first pivot high, which is above the second pivot high, as demonstrated in the image above. The line starts at the first point and goes through the second. You need to make it long enough to see the next points where the price is going to meet the trendline in the future.
How to Use Trendlines Properly
The idea behind using trendlines properly is that you should keep your eyes on the chart and look for the areas where the price is going to meet the trendline. This is the most important concept of using this kind of technical analysis drawing tool. Once the price meets the trendline and bounces off, traders often make deals.
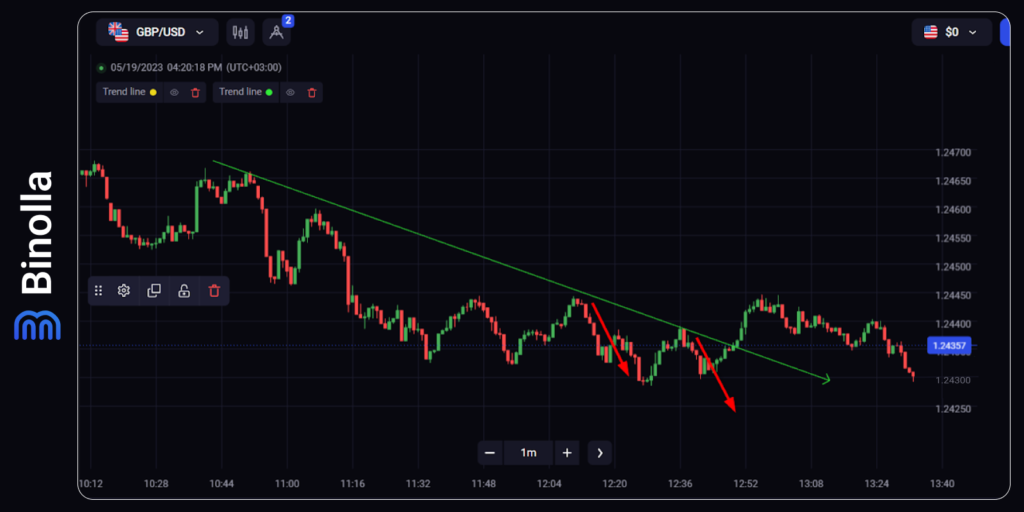
This is how it works for the descending trendline. The price bounces off the line and goes lower, which allows traders to buy Lower contracts or sell a currency pair. It seems very simple so far, but there is one key trick that you should know about trading with trendlines.
If you use the naked line without applying any other methods, you will end up losing a lot of trades.
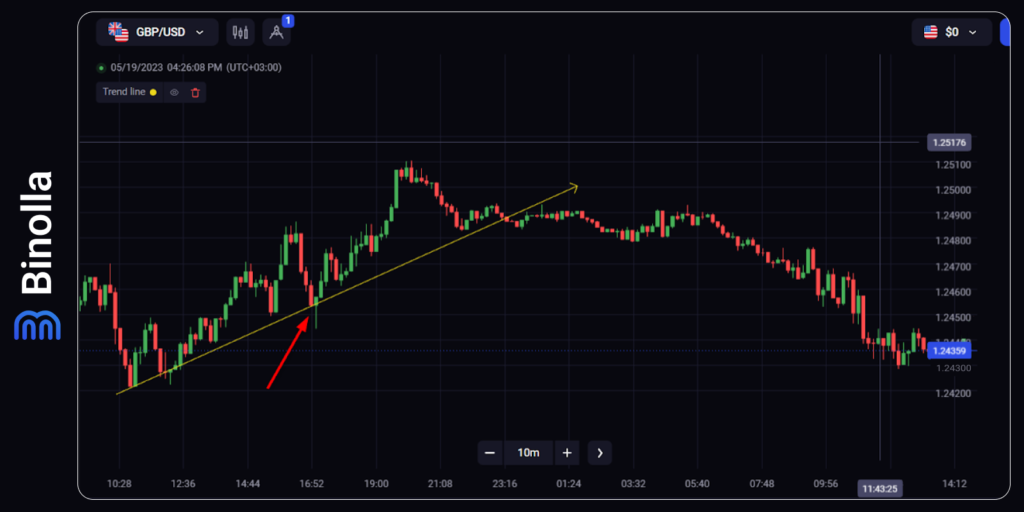
The image above shows an ascending trendline and the situation where the price hits it when another correction to the uptrend ends. You can see that the price pierces the trendline, which is a confusing factor. If you don’t use any other analysis tool, you may think that the trendline is broken.
However, you can notice that the price reverses after piercing the line. We have a classic bullish hammer candlestick pattern here, which is known for being a reversal one. This confluence of the two signals makes the whole opportunity look even more attractive, and the signal becomes stronger!
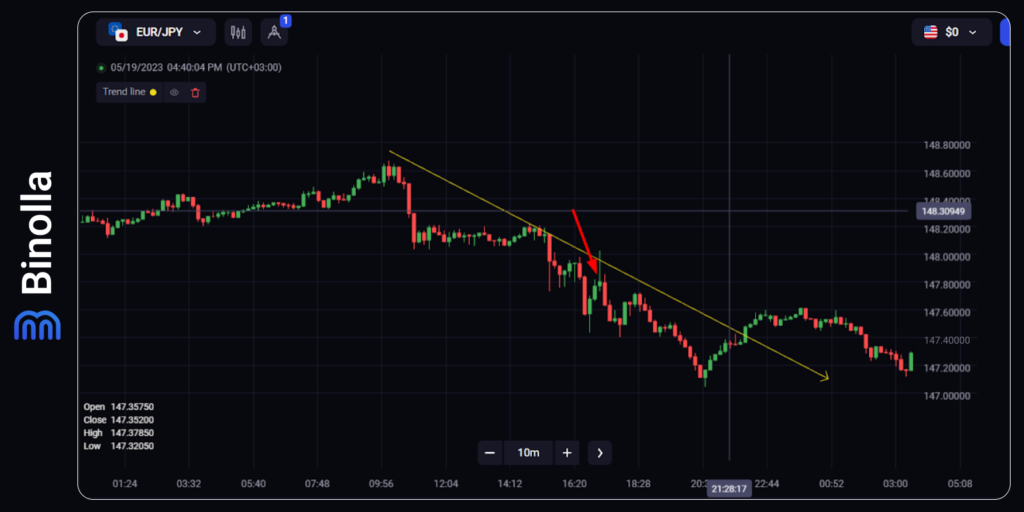
Another example of trading with a trendline can be seen above. Here we have a descending line, which means that we have a downtrend. The point that we have highlighted with the red arrow is where you can buy a Lower contract or sell a currency pair.
As you can see, the price reaches the trendline but steps out of it and forms the Shooting Star pattern. This is a classic Japanese candlestick pattern, which means that the price is going to decline. Therefore, this is a good point to make a trade after the Shooting Star pattern is formed.
Trendline Fake Breakouts
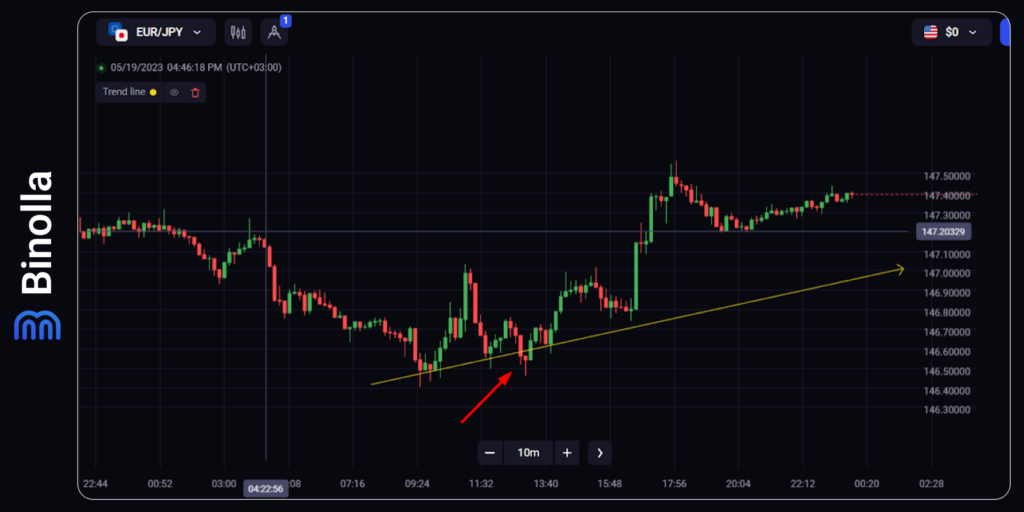
We have already mentioned that trendlines are not 100% accurate. This means that sometimes the price may not reach it to hit the next point or even make fake breakouts. The image above demonstrates how you can benefit from this opportunity if you use both a trendline and a Japanese candlestick pattern.
As you can see, the price not only touches the line but also pierces it for some time. However, in this particular case, we don’t have a clear breakout as the Hammer pattern appears. This pattern is famous for ending the previous downtrend and signaling an approaching uptrend. The image shows how the price moves back above the trendline and develops upside momentum later.
Using Trendlines to Define Market Trends
If you are trying to understand the current trend direction, the best and easiest way to do it is to draw a trendline. When you know how to do it, you can apply it within seconds and have a clear definition of the current direction of price fluctuations.
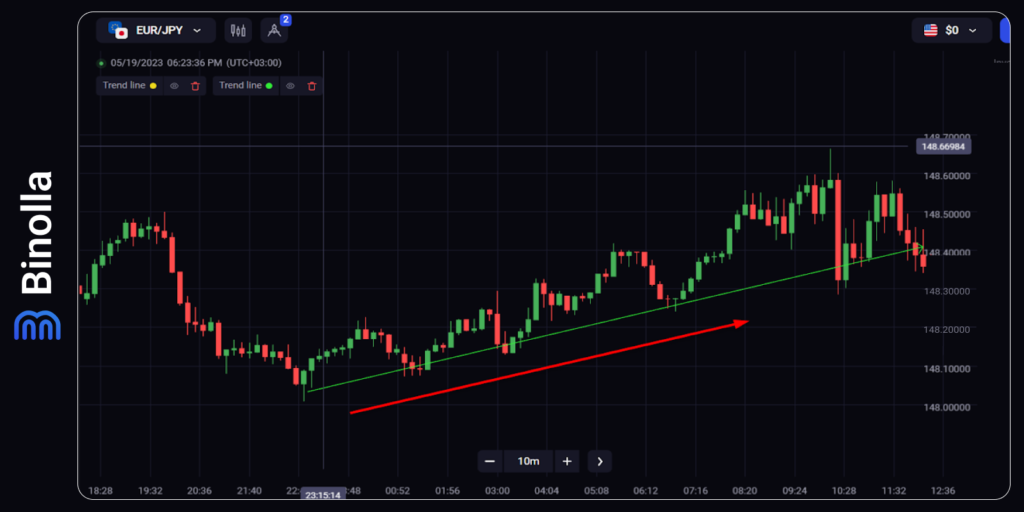
The image above confirms our previous statements. As you can see, once you draw a trendline, you can get a clear picture of what is going on.
Using Trendlines to Define End of Trends
A trendline can be equally useful when you want to know when the current trend ends. This is very important, as you can use this situation to apply some more trading strategies.
The idea behind this method is very simple. Once the trendline is broken by the price, the current trend is over. This method has both advantages and disadvantages. The benefit of using a trendline to define the end of trends is that it is the easiest way without the necessity to apply additional tools. When it comes to misses of this strategy, you can’t rely only on a such breakout to see whether the previous trend is done.
If you trade digital contracts, especially short-term ones like Scalping, you can benefit from this situation by simply buying a fixed-time option once the price makes a breakout. One of the features of those breakouts is that a strong momentum may occur during the breakout.
However, when it comes to Forex CFD, you may be trapped in a false breakout and have a drawdown, which will increase if the price resumes the trend.
Therefore, traders can use trendlines along with some other technical analysis tools that will help them establish the end of the trend.
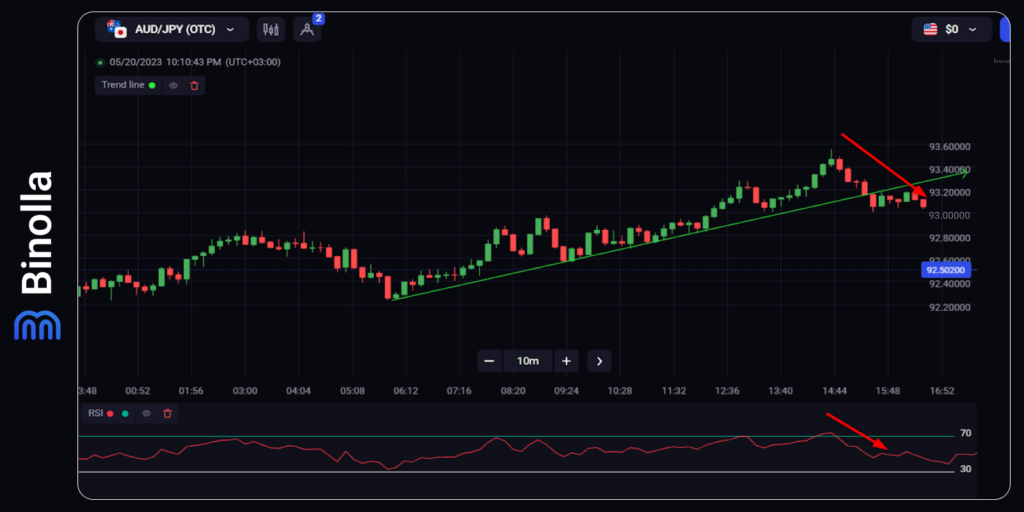
The image above shows the trendline breakout, which is confirmed by the RSI indicator. The indicator’s curve jumped in the overbought area (above 70) for a while and went downwards later. This is a strong signal that the price is going to decrease. The signal confluences with the trendline breakout, which makes it even more evident for traders that the trend is broken.
Trendlines: How to Time Your Entries
One of the most important things in trading is proper timing, especially when it comes to digital options. If you trade Forex CFD and buy any currency pair that is trending and goes up along the trendline, you don’t need proper timing, as you can be sure that if the price remains above the trendline, your efforts will be remunerated.
When it comes to fixed-time contracts, you are to be sure that the expiration price will be strictly above the strike price when you buy a Higher option and below it when you purchase a Lower contract. Therefore, the proper timing of your deals becomes crucial.
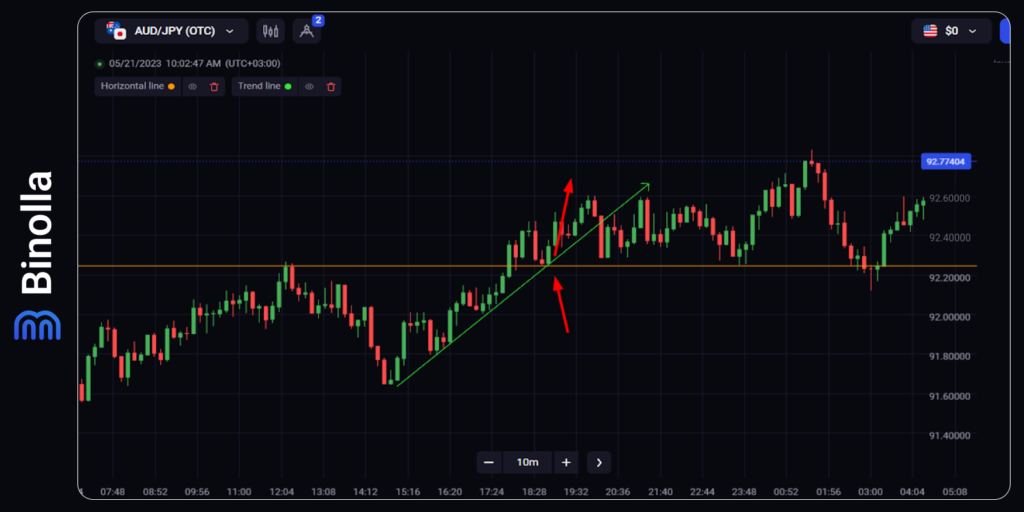
One of the ways to make sure that the signal is strong and that you can buy a digital contract is to use the confluence method. The image above demonstrates three signals that confirm that the uptrend is going to continue, at least for a while. The price rejects the ascending trendline and the support level at one point. Moreover, even if you miss this signal, there is a third one with the bullish engulfing Japanese candlestick pattern.
Trend-Following and Breakout Strategies
First things first. One of the key strategies that traders can use when they apply trendlines is to buy options when the price rejects the trendline.
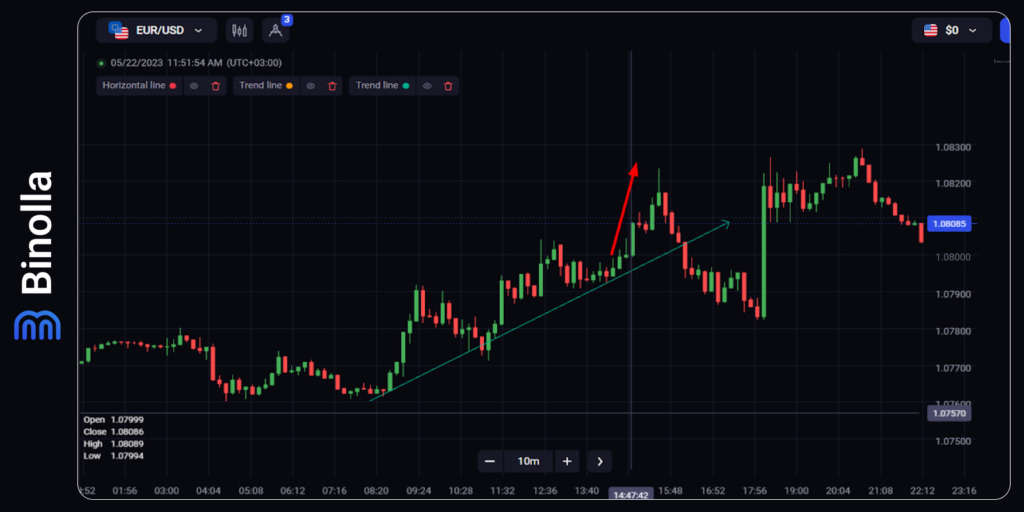
This first strategy is about buying a Higher contract or purchasing a Forex CFD when the price rejects the ascending trendline. We have a classic situation here where the currency bounces off the trendline, with the Japanese candlestick analysis showing that the downside correction is over. As you can see, this strategy works well, and traders can earn on the EUR/USD currency pair to further grow.
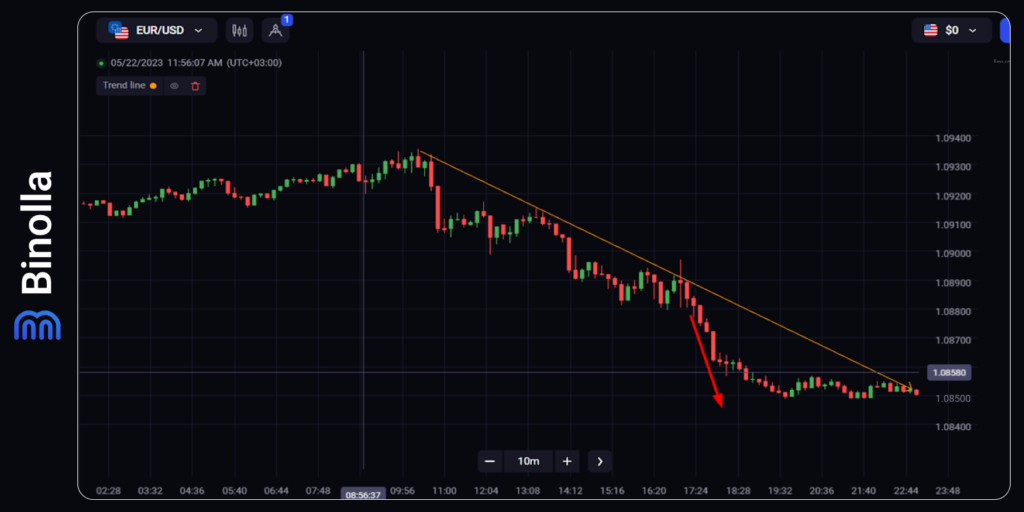
The opposite situation is when there is a descending trendline. As the image shows, there is a great opportunity to buy a Lower contract or to sell the currency pair there. Moreover, there is a confluence of signals as the price rejects the trendline and forms a doji pattern, which, in most cases, can be considered a reversal one.
Trading along the trendline is a very fruitful strategy, but all minor and even major trends come to an end at some point. This is the exact moment when you can benefit from the situation and make some more profits.
We have already mentioned that you can use a trendline not only to define the current price direction but also to see when the trend is over. Therefore, with this information, you can time your counter-trend trades.
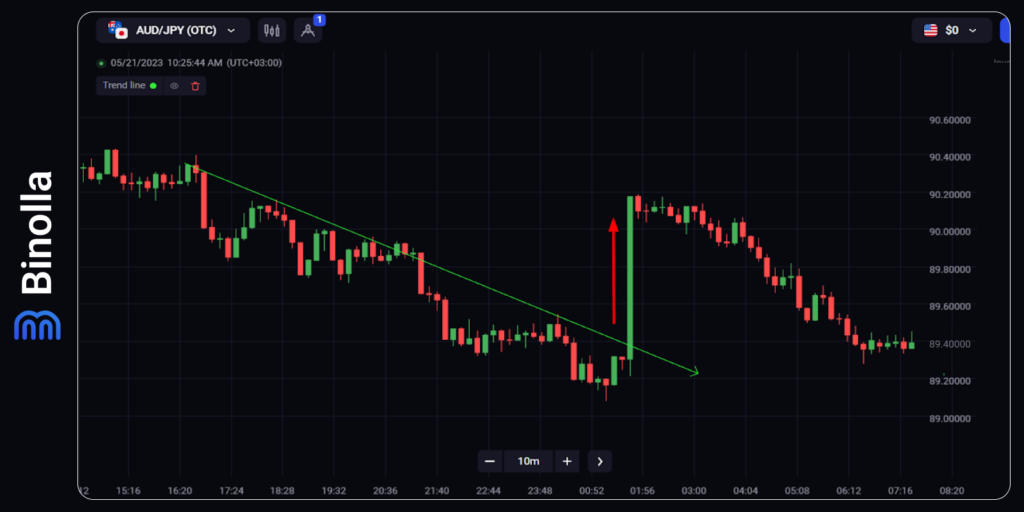
The image above demonstrates a descendant trendline, which keeps the price from getting higher for some time and offers several great opportunities to sell the currency pair or to buy Lower fixed-time contracts. However, as was mentioned above, all good things come to an end at some point, and this is our case.
The basic trendline breakout strategy is to buy contracts when the price breaks the trendline. It sounds evident as it is. With our example above, you can see how it works. Once the price breaks the descending trendline, there is strong momentum that you can benefit from to buy Higher contracts or to buy the currency pair if you are trading Forex CFD.
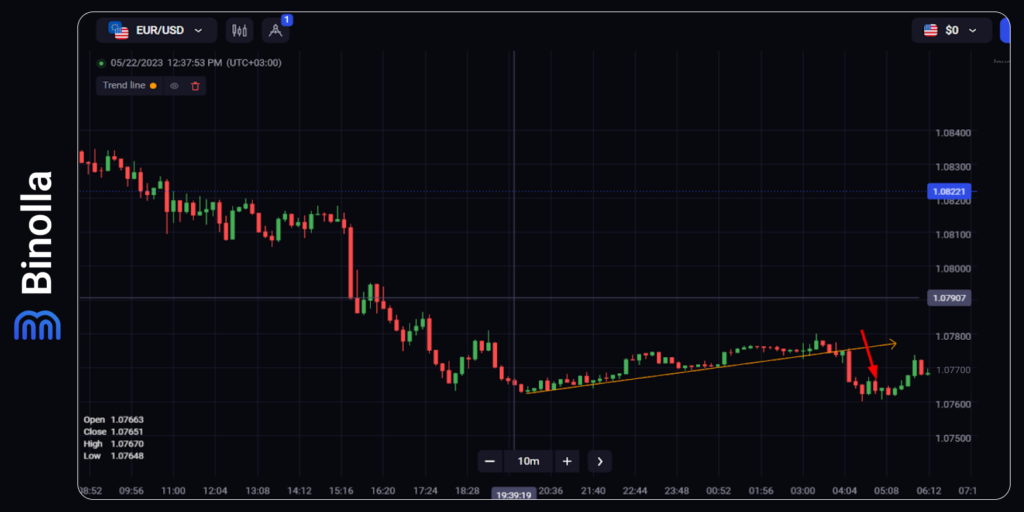
Here is another example of how traders can benefit from breakouts. In this particular situation, the price breaks down an ascending trend line, which means that you can buy Lower contracts at this point or sell the currency pair. A strong downside momentum that forms after the breakout allows traders to benefit from buying digital contracts.
Those are two of many examples of how you can use breakouts in your favor. By reading our next articles, you will learn more about other useful tools and tactics that you can use in your everyday trading routine.
Trendline: Tips and Tricks
While using trend analysis with a trendline may seem simple and evident, there are some tips that may be useful to you when applying this drawing tool to your chart. We have put together some key suggestions that may make your trend analysis more efficient:
- The more connecting points on the chart, the better. This is the first tip that you should learn when trading with trendlines. While you need only two connection points to build the line, it is better to wait for longer to see more connections, which will confirm the strength of the trend;
- Open trades along the current trend. While it may sometimes seem tempting to buy during corrections to a downtrend or sell when the price goes down to the bullish trendline, it is recommended not to use those strategies and trade along the main price movement direction. Keep in mind that the price may reverse at any moment during those corrections and start moving along the trendline again;
- Know how to draw trendlines. One of the key mistakes of newcomers is that they build trendlines randomly where there is no trend at all or try to draw small trendlines that belong to local trends and corrections. Whatever timeframe you trade on, it is better to find major trends there instead of drawing local trendlines;
- Look at trendline angles. If you are looking for stronger market trends, then you should pay attention to the angle. The sharper the trend slope is, the better. Start from 45 degrees and try to find trends with even sharper slopes;
- Use zoom in and zoom out. Sometimes you need to have a better look at the general trend. Then you can zoom out to observe the whole picture;
- Trendline areas. Reversal points are not exact, which means that the price may bounce above or below the trendline. Therefore, instead of trying to catch reversals on the very trendline, it is better to use additional trend analysis or other tools that will provide you with clearer signals;
- Find exit points. If you trade Forex CFD, you can use a trendline to find points where you can close your trade. Once the trendline is broken, it is time to leave the market. However, you should also be aware of those situations with false breakouts. Therefore, it is better to use some additional tools to confirm the breakout.
Drawing Trendlines: Pros and Cons
Trendlines have both advantages and disadvantages. Here are some key pros and cons:
Pros:
- Trendlines allow you to conduct trend analysis and identify major and minor price movement directions easily. You need to connect two rising lows to build a bullish trendline and two falling highs to draw a bearish one;
- Lines of this type can help define the current trend and even find reversal points;
- Using trendlines allows you to build a strategy around them and find market trends even without technical indicators. You can add Janapese candlestick analysis to your strategy to make it even more reliable.
Cons:
- Trend analysis of this type is very subjective. You need to have additional signals in order to find entry points. They can be drawn differently by different traders;
- Trendlines are not 100% accurate. Moreover, future price movements may be unpredictable due to some sudden events. Therefore, when trading with trendlines, you should also keep an eye on other data, including fundamentals.
Final Words
Trendlines are part of trend analysis and are very useful as they allow traders to predict price movement directions at various stages and in various market conditions. Whether you are dealing with currencies, stocks, commodities, or even cryptocurrencies, you can use this instrument to get a better and more comprehensive picture of what is going on in the financial markets.
Trendline stands for a line that connects higher lows during bullish trends and lower highs during bearish trends. Once you master this drawing tool, you can draw it in a matter of seconds. Therefore, even if you are short on time, instead of setting up indicators, you can quickly build a trendline and receive a lot of information about current financial asset price fluctuations.
This drawing tool is among the basic ones that every trader should learn how to build and how to read before even engaging in trading. Along with the picture of the current trend, you can rely on some entry points, especially when you use some additional financial trend analysis tools.
With all the above in mind, trendlines are very strong tools, allowing you to get an idea of the price movement directions as well as find some great opportunities to enter the market at particular moments.
FAQ

What is a Trendline in the Financial Markets Analysis?
A trendline is a line that is drawn on charts to reveal the current price fluctuations direction. Those lines are frequently used by both technical and fundamental analysis traders, as they are very simple yet very informative. This line has a slope that tells traders the direction of the current trend.
How to Build a Trendline on Charts?
To draw a bullish trendline, you need to find two consecutive higher lows on the chart first. Next, you draw a line connecting those points. When it comes to a bearish trendline, to start building it, you need to find consecutive lower highs and connect them with a line.
When Should You Use a Trendline?
A trendline is a universal drawing tool that can be used in many situations. For instance, if you want to define the current trend, you can apply a trendline and reveal the current market price movement direction. Also, by using a trendline, you can find entry points or even understand when the current trend is over.
Does a Trendline Guarantee 100% Results in Trading?
No, it doesn’t. Even if you have drawn a good trendline according to all the rules, there is no guarantee that you can find reliable signals. Pure trendlines are good for understanding the current trend. However, to find entry points or define trend reversal, it is better to use some other trend analysis tools.
Which Technical Indicators Can Be Used Along with a Trendline?
You can use any type of indicator with a trend line. The choice depends on your current strategy. Moreover, apart from technical indicators, you can use candlestick analysis (price action), price patterns, and any other techniques.
How Do You Know that the Trend is Strong?
Several technical indicators allow you to understand the strength of the market at any point. For instance, you can use ADX, which allows you to see the strength of the price movement direction. Moreover, the slope of the trendline is also very informative. Strong trends have a sharper angle.

