Top 8 Price Action Patterns Every Professional Trader Should Know

Price action is among the most popular trading systems so far. By using it, you will deal with the pure price movements, which are essential in analyzing any financial market. Price action in digital options or Forex allows you to capitalize on price movements without recurring to technical indicators (even though this system does not refuse them and you can still enhance your price action strategies with various types of technical indicators). This article will guide you through the top 8 price action patterns that most professional traders use in their trading sessions.
Join Binolla now to start making money using price action and other technical analysis strategies!
Contents
Support and Resistance Levels
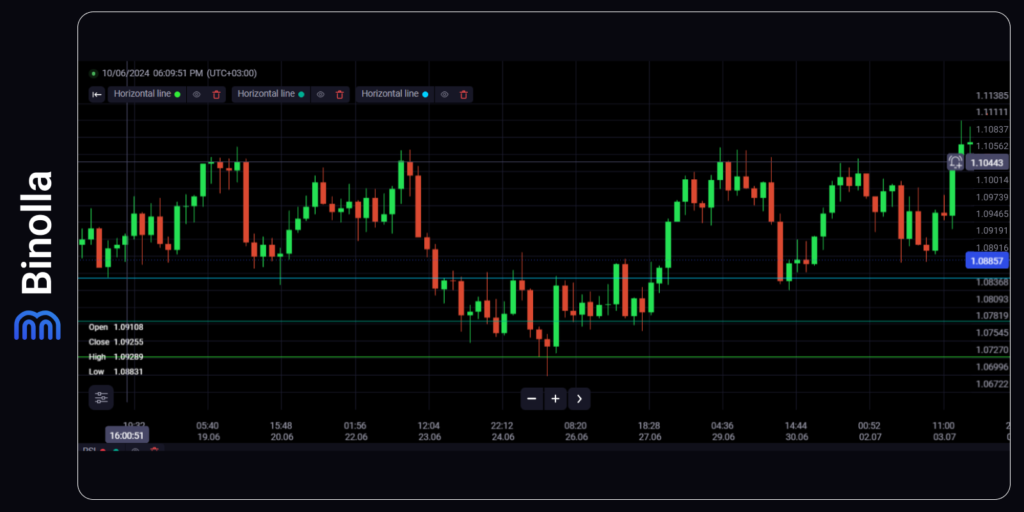
Before delving into the most popular trading patterns, it is worth mentioning support and resistance levels as they are the cornerstone of the whole system. All patterns that are described below should align with support and resistance before you can open a trade.
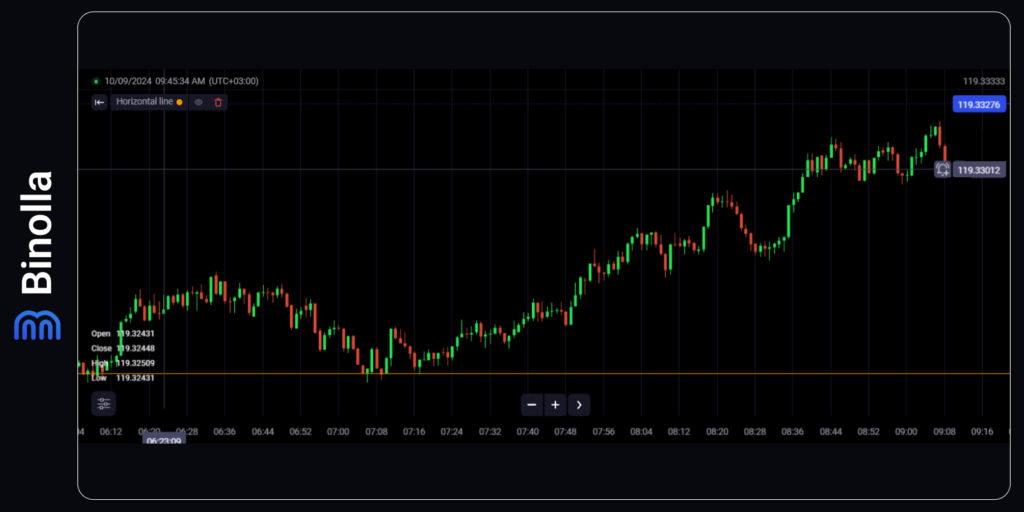
The support level is a horizontal line that connects at least two price lows. This area has a psychological background. Here, sellers can’t push the price lower, which means that the demand in this zone is increasing. The fact that the price reverses in the same area at least twice provides traders with important information about the interest in the asset. So every time you meet this term in the article, you should understand that this level prevents the price from going lower in a particular situation.
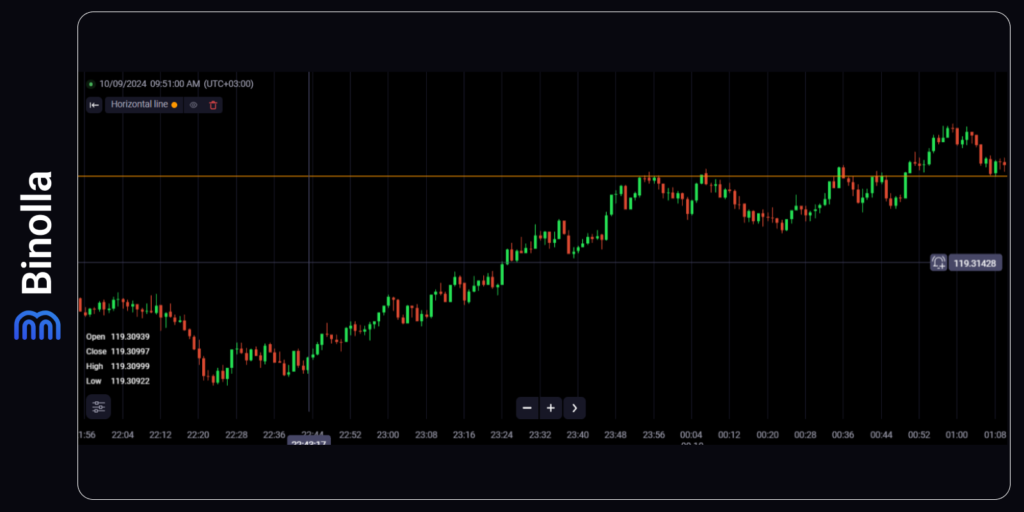
The resistance level, in turn, is a horizontal line that connects two price highs. Unlike the support level, resistance shows the area where sellers gain control over the price. Buyers can’t move it higher, while bears push it below. This is why you can see that after the price reaches the resistance area, it moves downwards. Each time that you read about the resistance level in this article, you should remember that this level prevents the price from going higher.
1: Double Top and Double Bottom
These patterns are among the most frequent and popular ones. Moreover, they are very simple to recognize on charts. The double top pattern appears at the resistance level while the double bottom is formed at the support level. Let’s look closer at both to see how to reveal them and use them in your everyday trading routine.
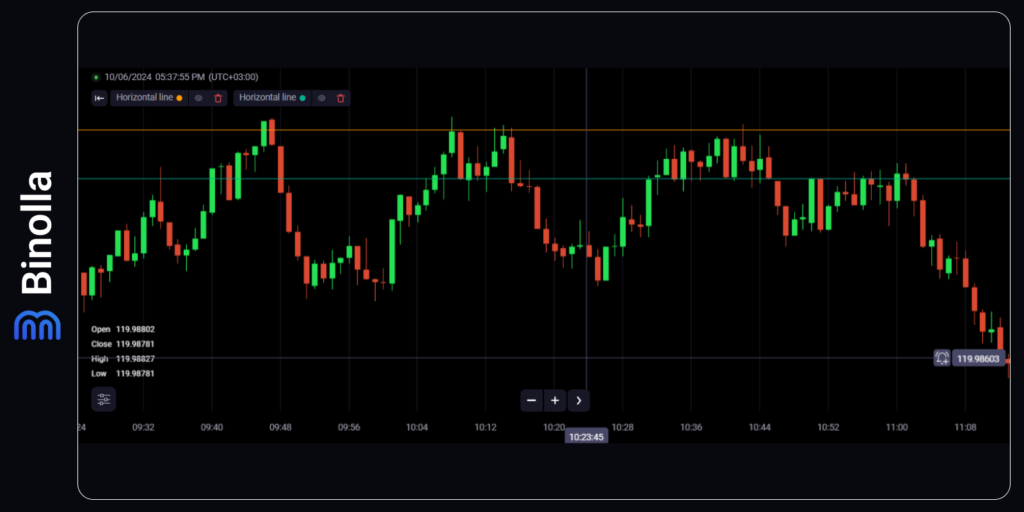
The double top pattern consists of two price peaks that are located at the same resistance level (the yellow line). There is also a bottom between them, which is formed at the local support and is known as the neckline (the green line). After the uptrend, the price forms the first peak as it tests the resistance and fails to break it.
Then it goes to test the local support level from where it moves to retest the resistance level and reverses from there once the line is reached. This second peak confirms that we deal with the double top pattern and once the price breaks the local support level again, a trader can buy a Lower contract.
What is important to know about this formation is that the price has a strong momentum once it breaks the neckline. You can see it in the picture above. However, in some cases, the price may return to the neckline after it breaks below to retest it. This is another great opportunity to buy a Lower contract.
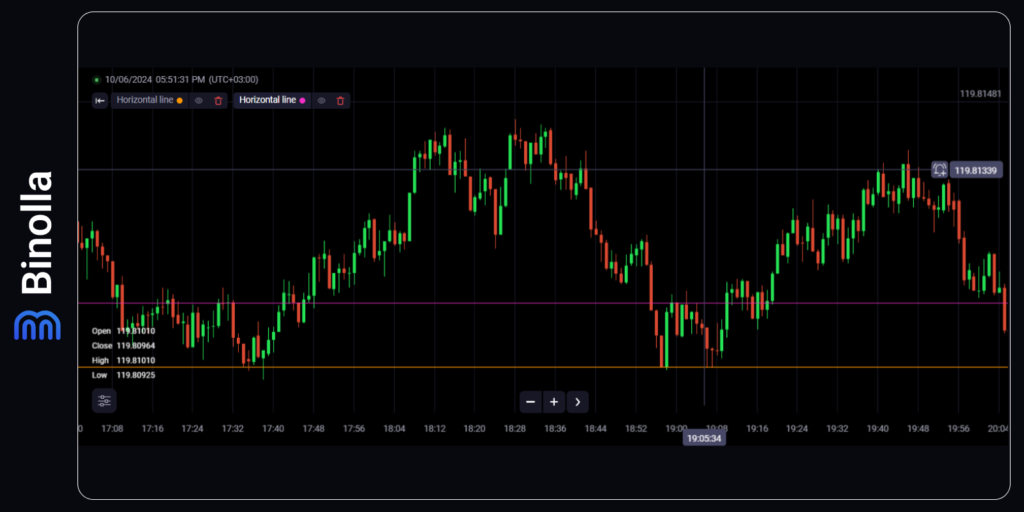
The double bottom pattern is formed at the support level and consists of two lows at the same level and one high between them that is located at the local resistance level. This resistance line is known as the neckline.
The price makes the first low after the downtrend and then, when it fails to break it, there is a correction to the resistance line (the purple one). However, it fails to reverse at once and makes another movement to the support level (the yellow line). The quotes reverse there and break the neckline on their way up. At the moment when the price breaks the neckline, a trader can buy a Higher contract.
Similar to the double top pattern, when you deal with the double bottom formation, you can have an additional signal when the price returns to the neckline after breaking it and retests it. If this happens, you can buy another Higher contract.
2: Head and Shoulders
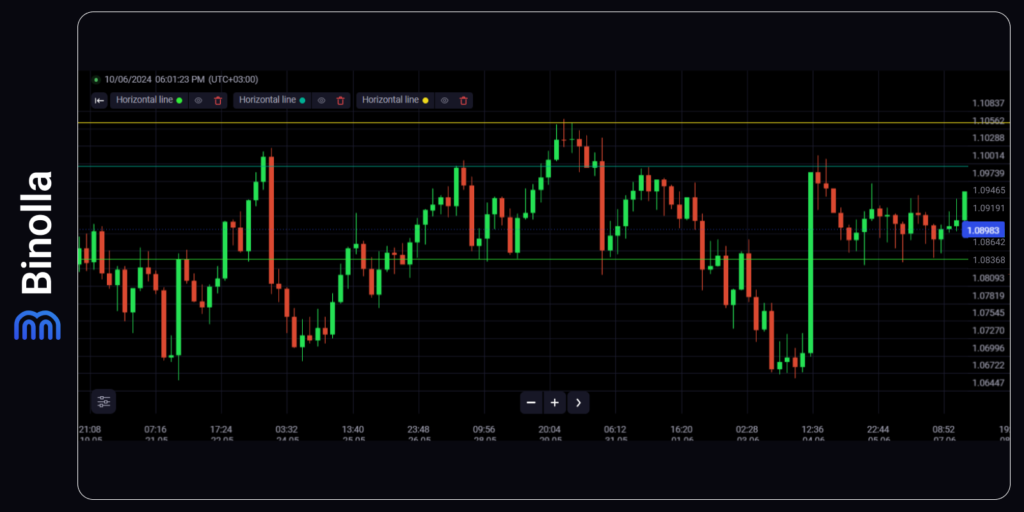
The head and shoulders are a more complex trading pattern that requires some previous trading experience as you need to understand how to find it on charts. It consists of three peaks with the middle one (the head at the yellow level) above those located to the left and to the right.
The pattern appears after the uptrend. The price hits the resistance line (the left shoulder) and then moves to the local support level (the neckline). Then there is another peak, which is even higher than the previous one. Then the price moves to the neckline again and reverses from there.
Finally, it goes to the local resistance level (the right shoulder), which is equal to the level of the left shoulder. After reversing from the third peak, the price breaks the neckline and moves lower. The breakout moment is a signal to buy a Lower contract.
There is a mirror pattern known as inverted head and shoulders. It includes three lows with the middle one lower than those located to the left and right. After the downtrend, the price stops at the support line and reverses to form the first left shoulder.
Then it hits the local resistance level and moves down again to form the head (the lowest point). After hitting it, the price moves to the neckline again and reverses there to form the second shoulder (the right shoulder that is located at the same level as the left one).
Finally, when the price reverses from the right shoulder, it moves to the neckline and breaks it. The idea is to buy a Higher contract at the moment of a breakout. Normally, the price starts to grow quickly from there allowing you to capitalize on it.
Keep in mind that similar to double tops and bottoms, here the price may return to the neckline again. Traders can have an additional opportunity to buy digital options from there.
3: Flags
Flags are trend-continuation patterns that appear in the middle of the price movements. While trends may be long, they normally have corrections before they continue. A flag is a correction that allows you to find an entry point to capitalize on the further trend movement.
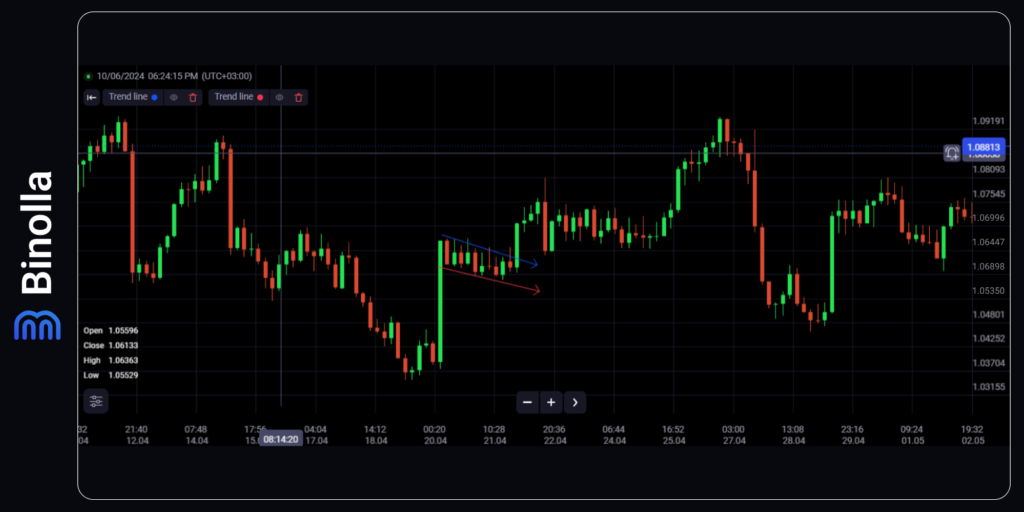
We have already mentioned that trends are often separated by corrections that occur somewhere in the middle of the price movement. It can be compared with a trip on feet where you need to rest before hitting the road again.
A bullish flag appears after an uptrend movement. The price starts to correct in the opposite direction within a narrow channel. The idea is to buy a Higher contract when the price breaks the upper band of the channel.
Keep in mind that trading within the channel is not recommended. Moreover, waiting for the breakout is crucial as the pattern may fail and the price may go in the opposite direction.
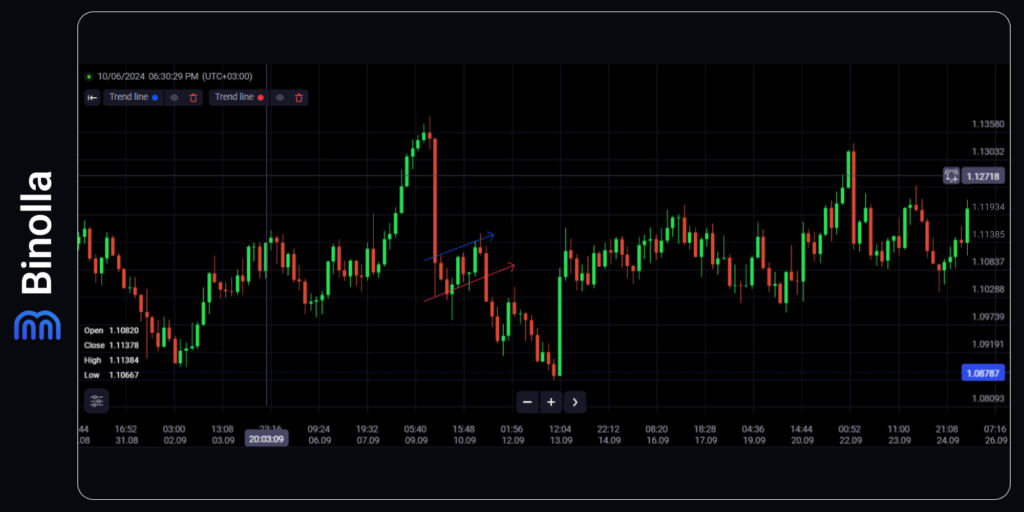
There is a mirror pattern that is formed in the middle of the downtrend and is known as the bearish flag. After a strong downside movement, an upside correction begins. You can canalize it in a rectangle where the price moves between the lower and the upper band.
To open a trade, you need to wait for the price to break the lower line of the flag pattern. Once it happens, you can buy a Lower contract. Remember, that trading within the flag is not recommended as the pattern may fail and the price may go upwards.
Here is our video guide on how to trade flags.
4: The Hammer Pattern
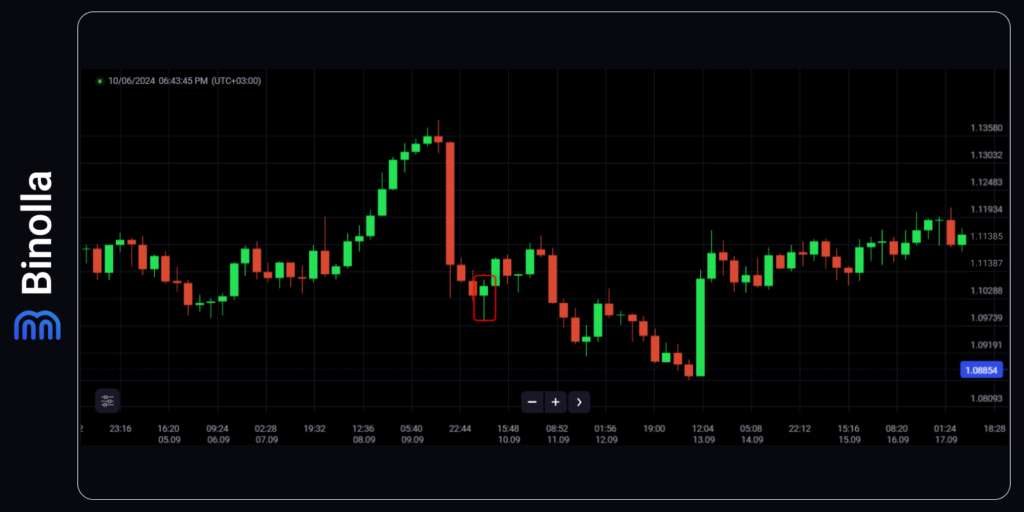
Apart from patterns that may include several candlesticks, there are some models based on a single candlestick. The hammer pattern is a bright example of such formations. It appears at the local or key support levels and tells traders that the market is going to reverse or a correction may occur.
The hammer pattern consists of a single candlestick with a small body at the top and a long shadow at the bottom. Psychologically, this pattern shows that the bears are no longer controlling the market, while bulls become more active and take the initiative by the end of the period.
To trade the hammer pattern, you need to wait until the hammer candlestick closes. Once it happens, you can buy a Higher contract. There is another less aggressive strategy of buying a Higher contract when the price breaks the upper point of the hammer pattern.
Which strategy to use? It is up to you to choose. Keep in mind that the price may test the lower point of the hammer or even go lower. Therefore, if you want to avoid risks, you can choose the second one. However, you will lose the part of the movement in this case.
5: Shooting Star
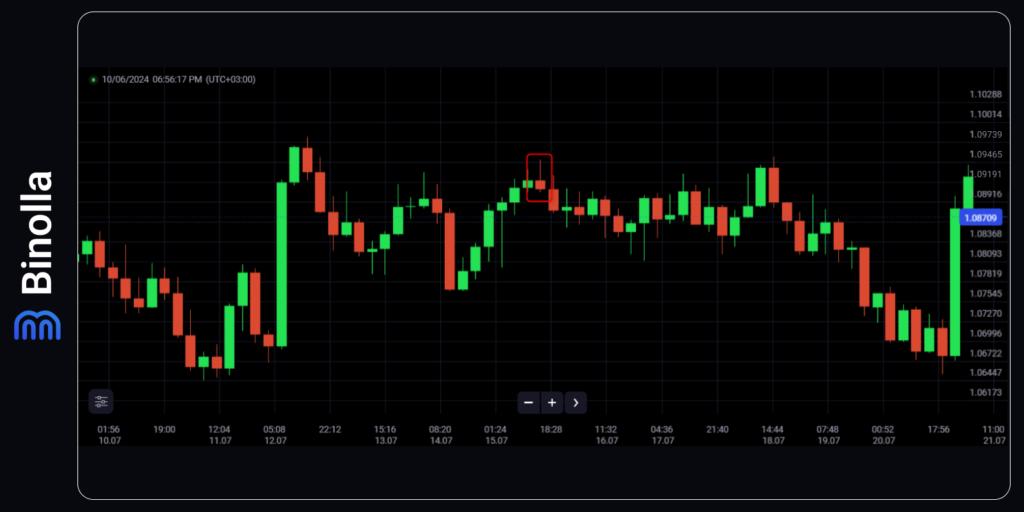
Another single candlestick pattern that is worth your attention is the shooting star. It is formed at the top of the market after an uptrend. The candlestick has a small body at the bottom and a long shadow at the top. The pattern tells traders and investors that the bulls can’t control the situation anymore and the bears begin to sell more aggressively.
To trade with this pattern, you need to wait for the shooting star candlestick to close. There is also another strategy allowing you to buy a Lower contract when trading with the shooting star candlestick pattern. You should wait for the price to break below the lowest point of the shooting star candlestick.
6: Bearish Engulfing
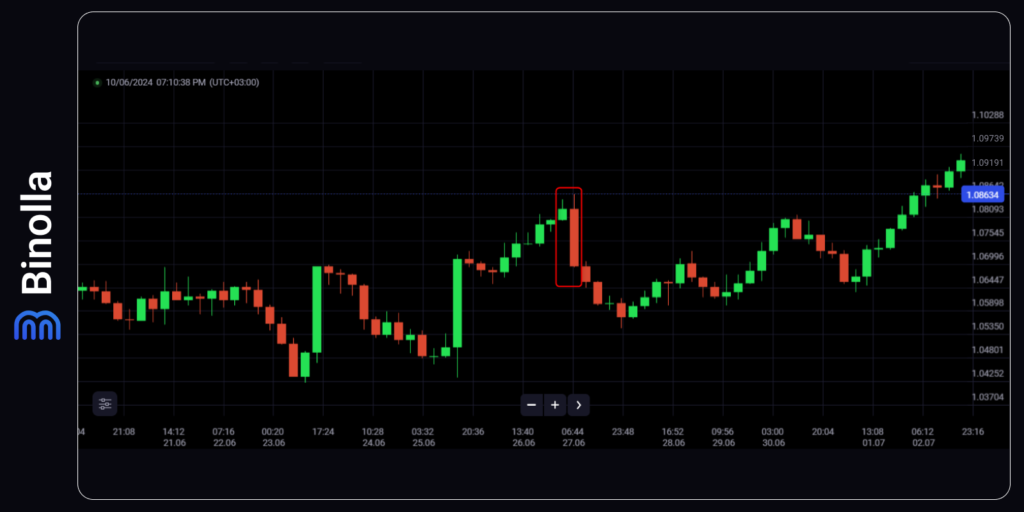
This pattern comprises two candlesticks and is formed at the resistance level. The first candlestick should be bullish, while the second one is bearish. The engulfing means that the body of the second candlestick covers the body of the first one.
The classic engulfing can be found mostly in stocks, where gaps occur more frequently. The opening price of the bullish candlestick should be above the closing price of the bearish, while the closing price of the bullish candlestick should be below the opening price of the bearish one.
When it comes to Forex currencies, where gaps are rare, the opening price of the bearish candlestick is normally at the same level as the closing price of the bullish candlestick. However, the opening price of the bullish one is above the closing price of the bearish.
The psychology behind this pattern is very simple. Bears take full control of the market by pushing the price below the previous bullish candlestick’s open. Moreover, this reversal happens at the resistance level, where bulls lose their power. Once the bearish candlestick closes, a trader can buy a Lower contract.
7: Bullish Engulfing
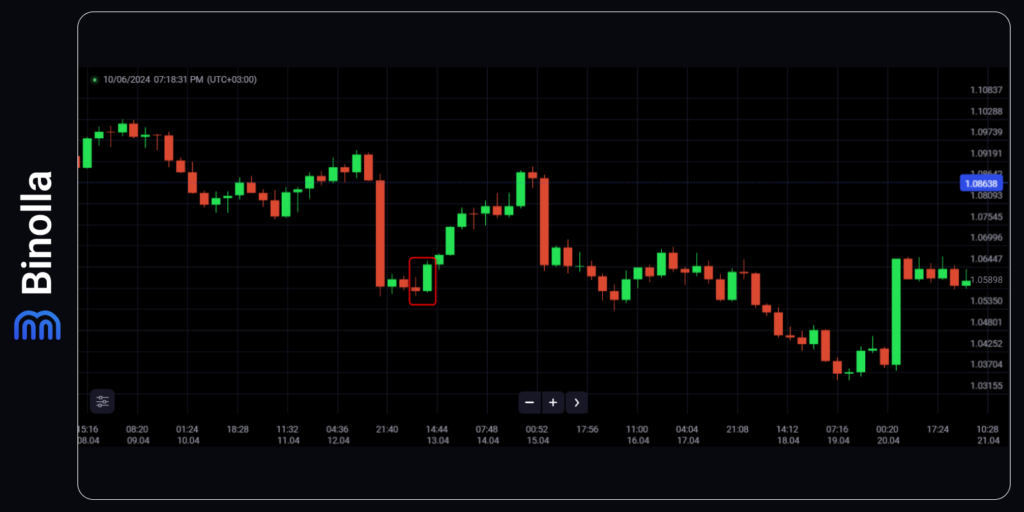
Another interesting pattern in our top 8 price action patterns that professional traders should know is a bullish engulfing. It occurs at the bottom of the market after a downtrend. The idea is that the bullish candlestick should engulf the bearish one, after which the price moves higher.
The psychology behind this model is the following: bears are no longer controlling the price as bulls show growing interest in the asset. The second candlestick closes above the first one, which means that the market sentiment has already shifted. Traders can buy a Higher contract when the bullish candlestick closes.
8: Rectangle
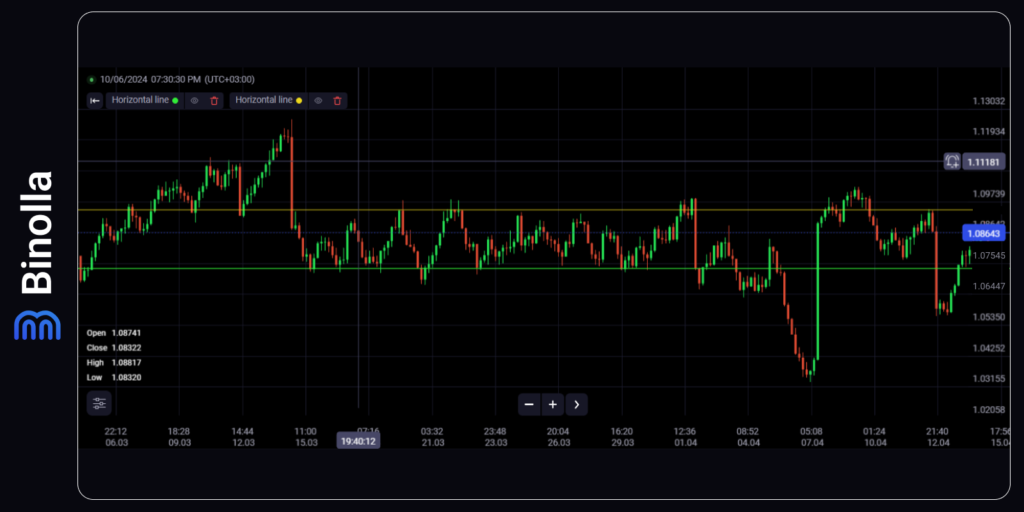
This pattern looks very complex, but it can be easily found on charts. The idea is that the price moves downwards and then starts a consolidation that may last for a while. Rectangle canalizes the price, which fluctuates between the support and resistance levels. At the end of the pattern, the price breaks below the support level, which is a signal to buy a Lower contract.
Keep in mind that you can trade within the rectangle as well. Simply wait for the price to test the resistance level and buy a Lower contract once it reverses there. The same is relevant for the situation when the price reverses from the support level. You can buy a Higher contract in this case.
FAQ

Which Pattern is the Best for Trading?
There is no best pattern to trade digital options. Each one can be useful in a particular situation. For instance, when a hammer appears at the support level, you can use this model. If there are two lows at the same level that are separated by a high at the local resistance, then you can expect the price to grow in the near term.
Can Beginner Traders Use Price Action?
Yes, they can. However, they should master at least one pattern to start using this system. To master means to be able to recognize the pattern on the chart and to know when to engage if the pattern is confirmed.
Can I Use These Patterns in Different Timeframes?
Yes, you can. These patterns can be applied to various timeframes as they are universal. For instance, they work well for scalping strategies as well as they can be used by traders who prefer long-term and position trading.
Why Do Price Action Patterns Work?
Price action is the system that analyzes the naked price. The price itself reflects the market psychology and sentiment. Each pattern has its own psychological basis. For instance, the hammer candlestick tells traders that bears can’t push the price lower, while bulls show more interest in an asset.
Can I Use Indicators When Trading with Price Action?
Yes, sure. You can use any indicator to augment your trading strategies. Price action can be traded without such technical analysis tools but does not contradict them. If you want to enhance your strategy, you can apply technical indicators.
