The US Dollar Loses Ground as Market Expectations about the Cut Rates Become More Optimistic

EUR/USD aims at new targets on Tuesday, June 25 as the US dollar loses ground. The additional pressure on the USD is due to the expectations of the first rate cut by the Fed which is likely to be done in September. Moreover, the European currency is supported by the upcoming French presidential elections that will take place on Sunday.
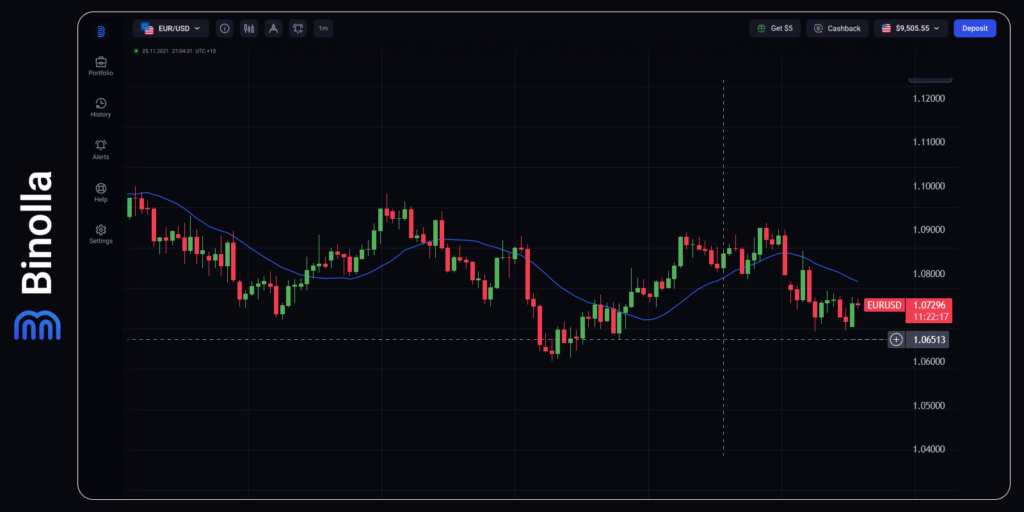
The daily EUR/USD chart demonstrates that the further uptrend for EUR/USD is restricted by the 20 SMA as the price stays below it. On the other hand, momentum indicators show recovery from strong oversold levels. When it comes to lower timeframes, risks turn downside. While EUR/USD stays above 20 SMA, a bearish slope is still relevant. While SMAs with higher periods are still above the price, they move south, hinting at the possibility of a reversal.
There was a little action on Monday as the price fluctuated in a tight 50-pip range. While the currency pair bottomed at the beginning of Monday’s session, it recovered and managed to advance towards 1.0745, where it found strong resistance from sellers. In the absence of important macroeconomic data releases, currency pairs followed stock markets on Monday. Today, the economic calendar has still little to offer to market participants, except the US CB Consumer Confidence index, which may bring a little volatility to the financial markets.
Contents
- 1 GBP/USD Recovers as the US Dollar is Under the Pressure
- 2 Your Strategy Starts with Market Knowledge!
- 3 Australian Dollar Makes New Gains Against the US Dollar
- 4 USD/CAD retreats from Its Current Positions
- 5 WTI Tests $82.00 Amid Hopes for Higher Demand in Summer
- 6 Gold Is Traded Within a Range As Market Participants Wait for New Fundamentals
GBP/USD Recovers as the US Dollar is Under the Pressure
Similar to EUR/USD, GBP/USD extends its gains on Tuesday and tests 1.2700. The improved market mood brings the US dollar down and opens new opportunities for GBP/USD bulls. Traders focus on sentiment data and the Fed’s commentaries to find some clues that will help them forecast the FOMC decisions in September. When it comes to the UK calendar, it is still data quiet.
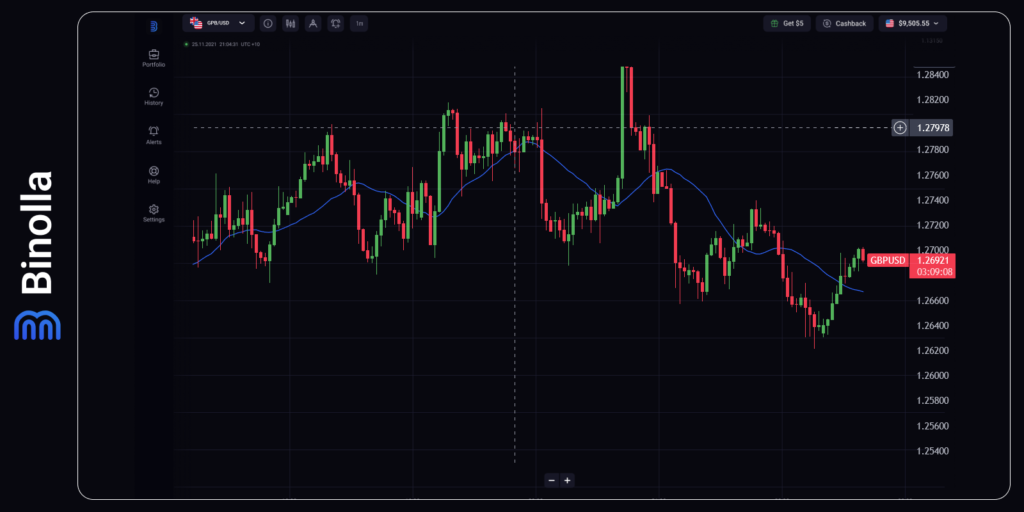
GBP/USD is trading right above the 20 SMA. The currency pair failed to break the 1.2700 resistance level, which means that seller pressure may increase in the coming hours. However, breaking this level may be difficult for 200-period SMA confluences with this resistance area.
On the downside, if GBP/USD manages to break below 1.2640, the next support level will be at 1.2600. Should this line fail to prevent the price from further decline, we can see GBP/USD at 1.2580, which is a 50% Fibonacci retracement line.
GBP/USD suffered a sharp decline on Thursday and even managed to touch the weakest level since mid-May at 1.2620 on Friday. However, after closing the week in negative territory, GBP/USD corrected on Monday and reached 1.2650. Similar to EUR/USD, GBP/USD benefits from a weaker US dollar, which helps the currency pair to hold its ground.
Australian Dollar Makes New Gains Against the US Dollar
The improved market sentiment allowed the Australian dollar to keep inching higher against its American counterpart. Revised forecasts for Australian yearly CPI show that the inflation is likely to accelerate to 3.8% against the 3.6% established during the previous data release. This may stimulate traders to buy AUD/USD as the RBA is unlikely to undertake any dovish steps in case of higher inflation rates. The Fed, on the other hand, may cut rates in September that, in turn, pushes USD lower currently.
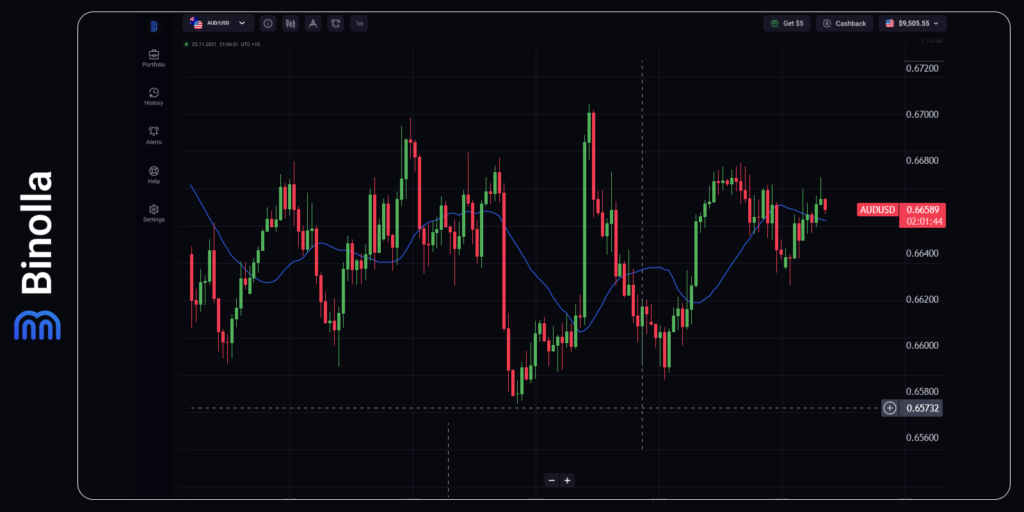
The current situation on the 4-hour AUD/USD chart shows indecision from both sides. No clear trend can be detected. Bulls and bears replace each other from time to time once the price nears significant levels. However, keeping in mind the upcoming fundamentals, the Australian dollar may break this wide range and even more above 0.6700 in the near term.
USD/CAD retreats from Its Current Positions
While USD/CAD extends its losses ahead of the set of Canadian CPI data, the potential for further CAD growth is limited due to oil price correction. Lower WTI price may push the Canadian dollar lower against the US Dollar even though the latter can’t find ground as the rumors about the Fed rate cut in September stimulate market participants to sell the US dollar.
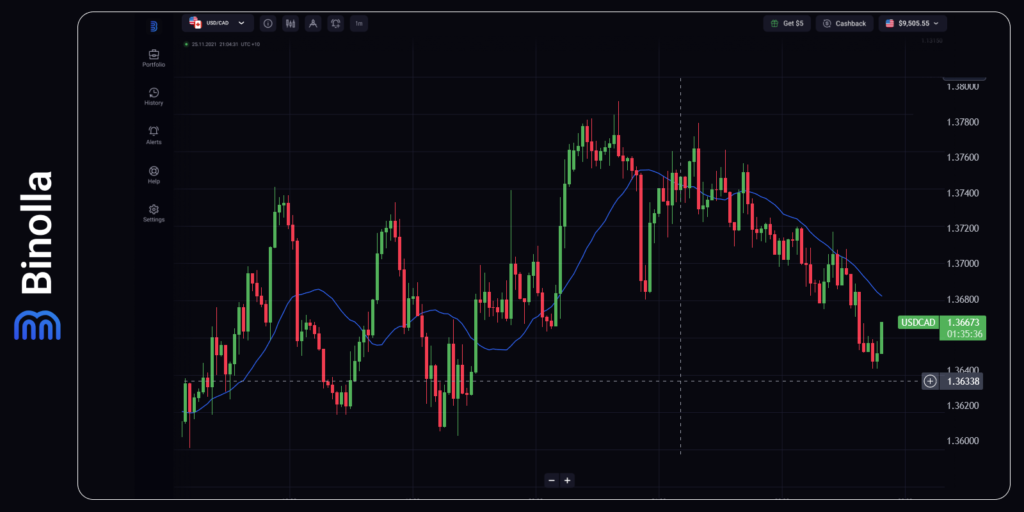
The 4-hour USD/CAD chart still indicates on the mid-term downtrend as the price resides below the 20 SMA. The closest target for bears is at 1.3600, which is a round psychological level providing strong support to the currency pair. If USD/CAD manages to break the descending trend and jump over the 20 SMA, then the currency pair is likely to test 1.3700, which is also a round level preventing USD/CAD from getting to 1.3720 and 1.3760.
WTI Tests $82.00 Amid Hopes for Higher Demand in Summer
The US Crude Oil benchmark is trading around $82.00 amid expectations of higher demand for this commodity during the summer months. Moreover, the price is constantly supported by geopolitical tensions in the Middle East. While they are not playing the key role currently, any news from the region that may cut the supply will bolster the price further.
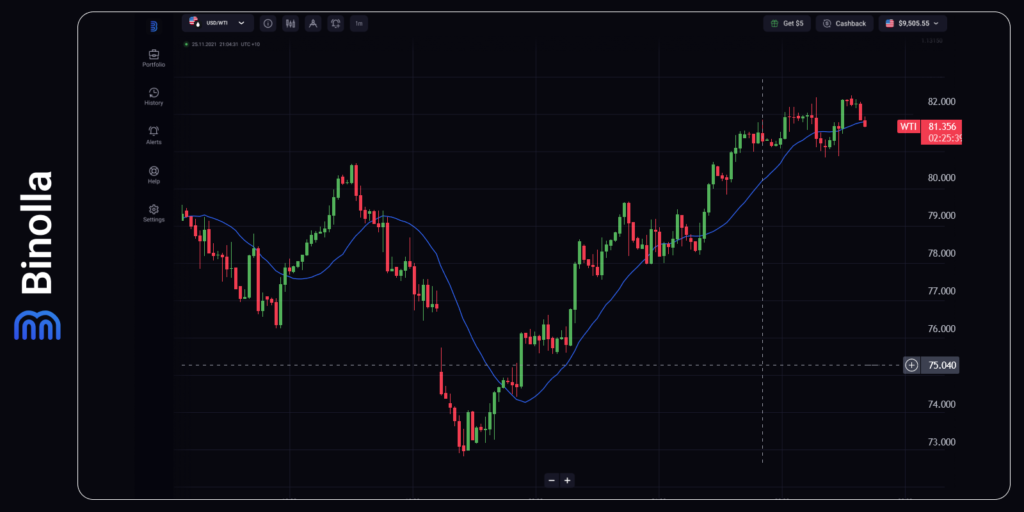
While the WTI price reiterated from the local highs at $82,00, the asset is likely to make another attempt to climb higher in the near future. The 20 SMA stays below the price highlighting the uptrend and acting as a dynamic support.
The next key resistance level can be found at almost $84,00, which is another round psychological figure. However, if the WTI price fails to get above $82,00, we will see it testing $80,20, which is the closest support area.
Gold Is Traded Within a Range As Market Participants Wait for New Fundamentals
XAU/USD experiences no significant movements currently due to the lack of fundamentals. The next data release that may bring some volatility and push gold out of the range may by Thursday’s US GDP data and Friday’s US Core PCE data.
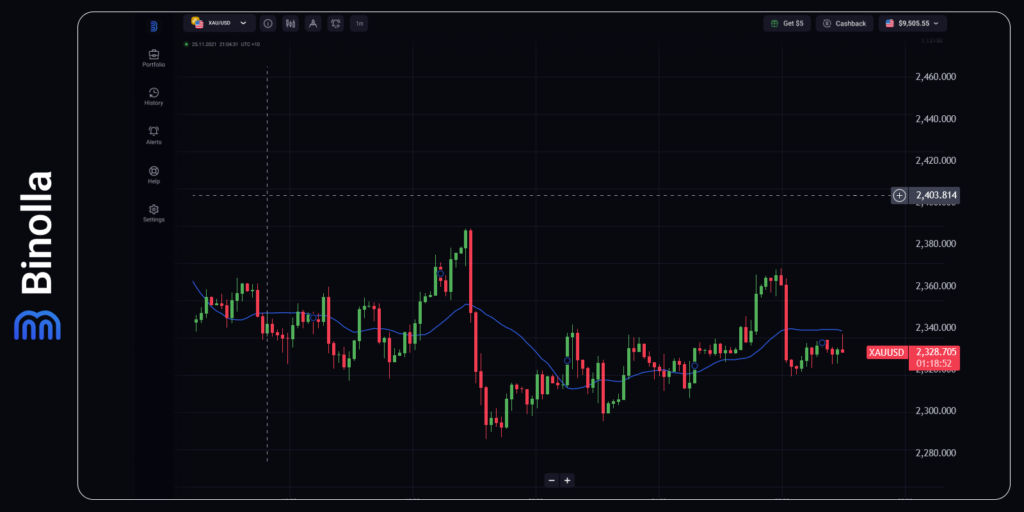
While XAU/USD remains below the 20 SMA, the moving average indicates no direction currently, which means that nor bulls neither bears can change the situation. The Thursday’s and Friday’s releases may bring more volatility and help XAU/USD define its near-term direction. The closest resistance level on the 4-hour chart is at 2,370. If the price moves there and manages to break this level, we can see gold to test the 2,390 area, where the price can make a brief stop after jumping above 2,400, which is a psychological level.


