The Keltner Channel Indicator: Basics, Strategies, How to Use

Keltner Channel is a famous technical indicator designed by Chester Keltner in the 1960s and upgraded by Linda Raschke in the 1980s. Nowadays, traders use the latest version of this technical analysis tool, which was updated by a famous trader. While it looks similar to Bollinger Bands and Envelopes, it is a totally different technical indicator with its own formula and calculations. By reading this article, you will learn more about the basics of this technical analysis tool as well as some interesting strategies that you can apply by using it. Start trading with the Keltner Channels indicator on the Binolla platform.
Contents
- 1 Keltner Channel Explained
- 2 How to Add the Keltner Channel to the Binolla Platform
- 3 Keltner Channel Indicator Strategies
- 4 Check out the Keltner Channel indicator!
- 5 Keltner Channels vs. Bollinger Bands
- 6 Keltner Channels in Trading: Video Guide
- 7 Key Recommendations for Keltner Channel Interpretation
- 8 Conclusion
- 9 FAQ
Keltner Channel Explained
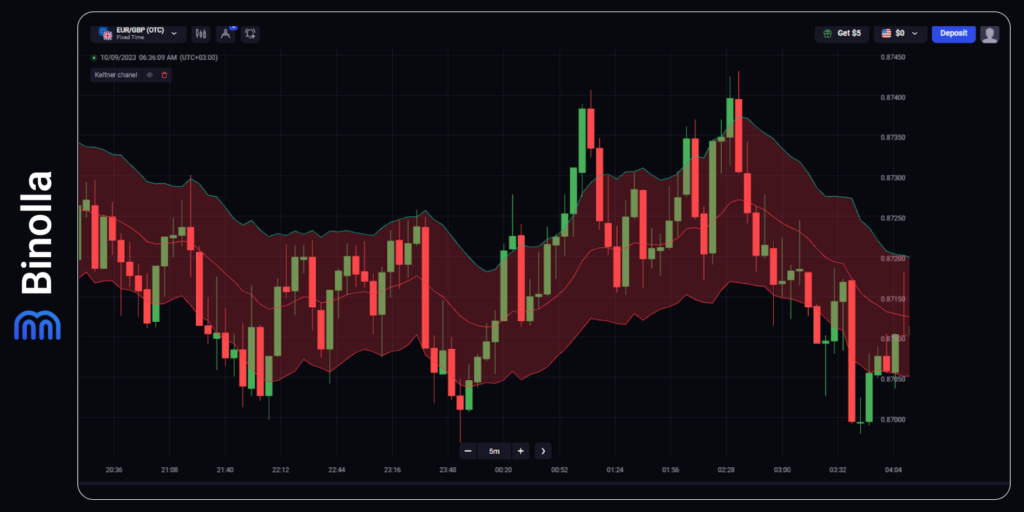
Keltner Channel is a combination of two technical indicators: Exponential Moving Average and Average True Range. The first averages the price for a certain number of candlesticks and gives weight to the most recent prices.
When it comes to the ATR indicator, it was created by Welles Wilder, who described its concept in his book “New Concepts in Technical Trading Systems”.
Keltner Channel calculations are made the following way:
- The upper band is equal to the EMA+ATR x multiplier;
- The middle line is a pure Exponential Moving Average;
- The lower band is equal to the EMA – ATR x multiplier.
Traders can set the EMA period on their own. However, you should keep in mind that the range between 15 and 40 is the best for day trading (the line reflects all trend changes and is flexible enough). When it comes to the multiplier, the common one is equal to two, which means that ATR is multiplied by this figure for the upper band calculations and multiplied by two for the lower band calculations.
Traders can adjust the multiplier on their own depending on the asset they are using in their trading practices. For instance, for more volatile currencies, such as AUD/JPY, NZD/JPY, GBP/EUR, CAD/JPY, and others, you can increase the multiplier, while trading with less volatile stocks, such as PG, MRK, VZ, and others, you can set it below two.
How to Add the Keltner Channel to the Binolla Platform
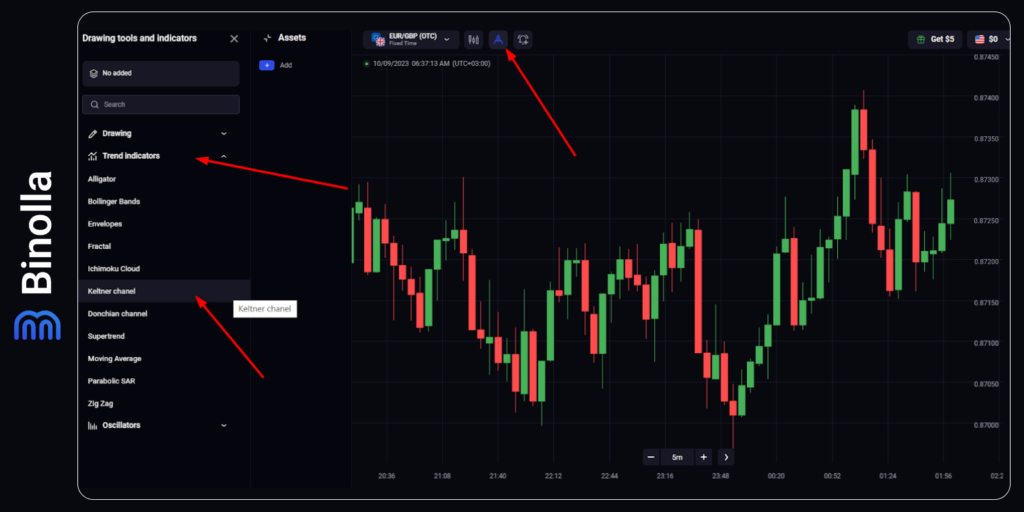
With the Binolla platform, you can easily add the Keltner Channel in several simple and straightforward steps:
- Go to the platform and log in to your account.
- Click the icon with tools at the top of the platform.
- Choose Trend Indicators in the menu at the left of the platform.
- Click Keltner Channel in the dropdown menu.
Now you will see the indicator applied to your chart.
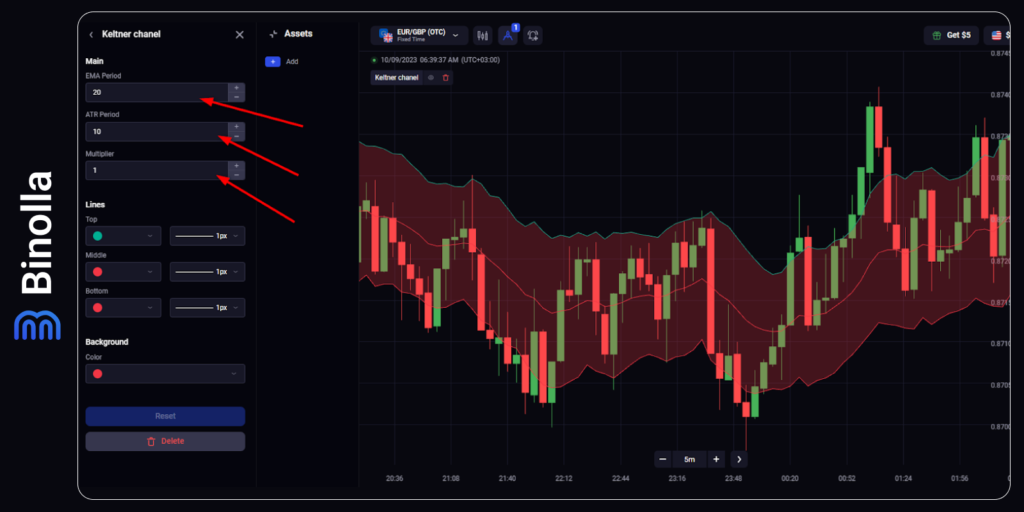
The indicator allows you to change the periods of the moving average and ATR and adjust multipliers. As we have already mentioned, for day trading, the best period ranges between 15 and 40, and the multiplier should be adjusted according to the asset and its volatility.
Below the settings, you will see some additional features, such as the color of the bands and the background. These are cosmetic customizations that do not influence the work of the indicator, but if you don’t feel comfortable with some basic colors, you can change them at any time. After you are done with Keltner Channel settings, you can start using this technical analysis tool to the fullest. Now that you know how to use the Keltner Channel indicator, let’s go down to business and look at some strategies that may be useful to you.
Keltner Channel Indicator Strategies
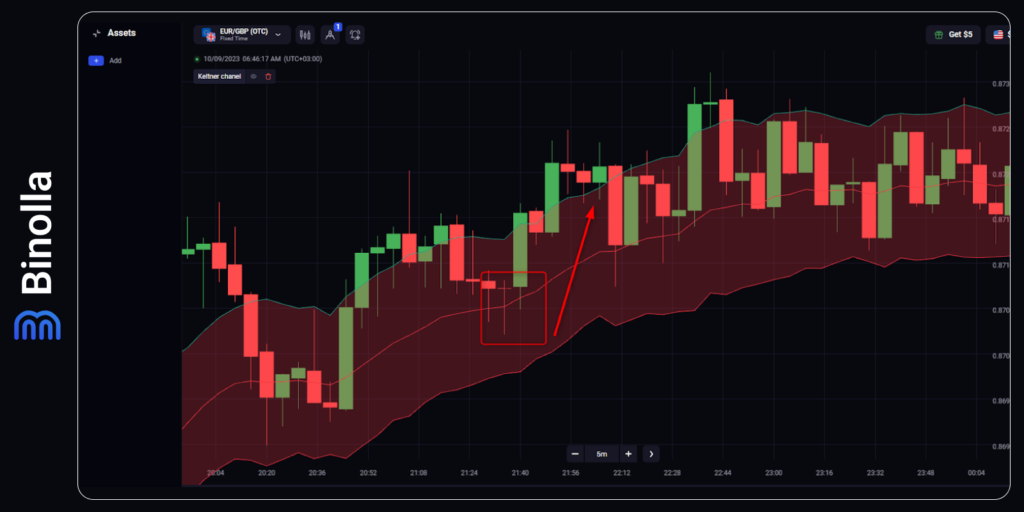
One of the simplest strategies for those who use the Keltner Channel is buying Higher contracts or buying FX/stocks when the price pulls back from the middle line. If you disassemble this indicator, you will see that the middle stripe is a moving average (exponential in our case, but it doesn’t matter as the idea is the same). When the trend goes upwards, the middle line acts as a support level or a trendline. Therefore, if the price hits this middle line and reverses upwards, you can open the trades.
If you are trading digital options, after placing a trade, you should simply wait for the expiration time to occur. However, when trading Forex or stocks, you can additionally protect your trades by stop losses. In this particular case, you can place one somewhere in the middle between the middle and the lower band. When it comes to profits, you can hold the position until the price breaks the middle line.
If you are using Japanese candlesticks, you can augment this strategy and find signals of confluence in order to improve its performance. In the example above, you can see that a bullish hammer appears close to the middle line, which is a reversal signal. The price goes up later. Therefore, using candlestick patterns is of great use.
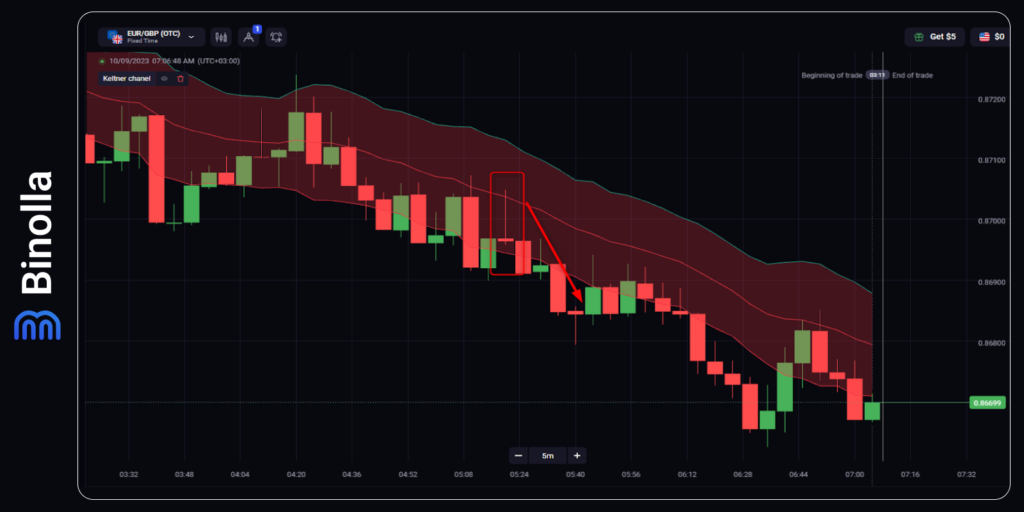
Now that you know how to apply this strategy for the uptrend, let’s have a look at the same situation, but when the price is in the downtrend. After it hits the middle line from below, you can buy a Lower contract or sell a currency pair or a stock.
The stop loss can be placed somewhere in the middle between the middle line and the upper band. As for potential profits, you can hold your position until the price makes a breakout of the middle line and moves towards the upper band. Keep in mind that if you are trading digital options, you don’t need to place stop losses or think about your profits as the contract closes upon expiration. Therefore, your risks are predetermined.
To make this strategy even better, let’s upgrade it again with candlestick patterns. If you find a confluence of signals, then you can buy a Lower contract or sell a currency pair or a stock. In our case, we have a shooting star pattern, which means that the price is likely to reverse downward again. Therefore, with this confluence of signals, you have a better understanding of what is going on on charts.
Breakout Strategies
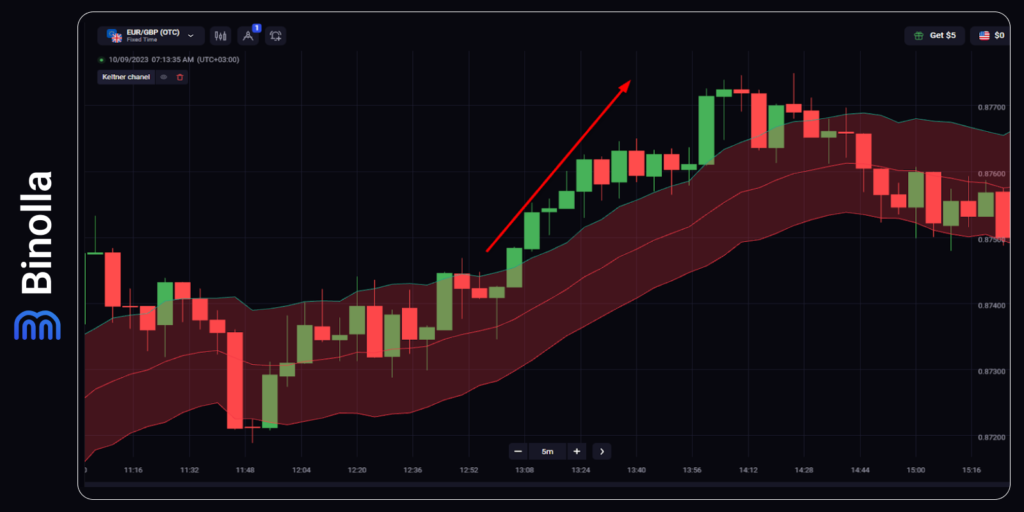
Similar to many other indicators of this type, Keltner Channel allows you to find and trade breakouts. When they appear, the price leaves the channel and stays above or below it for a while. In our first example, we are going to consider the situation when the price makes an upper breakout and stays above the channel for a while.
If this happens, you can buy a Higher contract or simply buy a currency pair or a stock. As you can see, the price stays above the channel for a while, establishing new highs and lows, which allows you to hold your position for a while, at least until the price hits the middle line.
The stop losses can be placed somewhere near the middle line in this case. As for the profit expectations, you can hold your positions until the price hits the middle line. Keep in mind that when trading digital options, you don’t need to place stop losses and take profits.
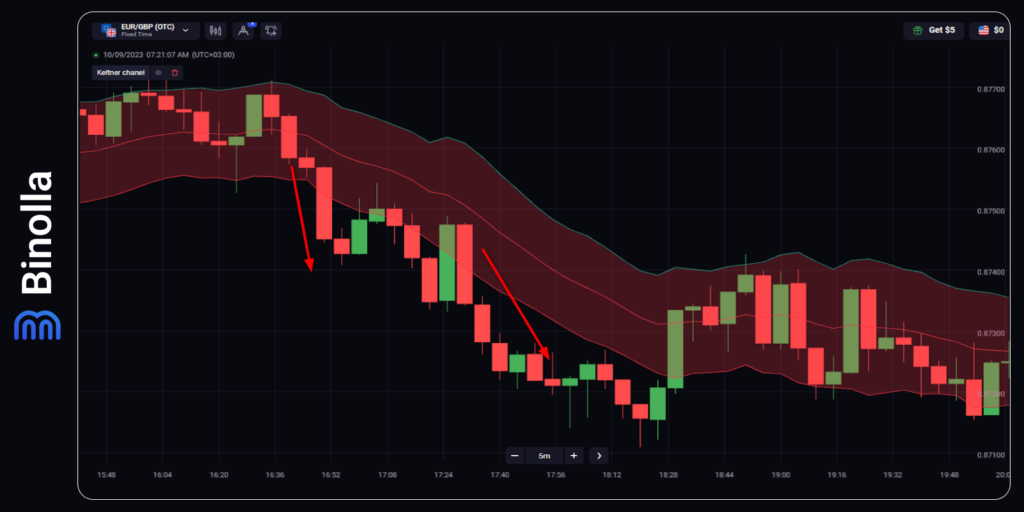
Now let’s have a look at a mirror situation when the price makes a breakout of the lower band during the downtrend. If it happens, you can buy a Lower contract or sell a currency pair/stock. Moreover, in our case, if you have lost one opportunity, you can open a trade later during another breakout that takes place with a huge bearish candlestick.
Stop losses can be placed somewhere on the way between the lower band and the middle line. As for profits, you can hold your trades until the price hits the middle line.
Strategy Combination
Both strategies are very interesting and may help you start earning money in financial markets if you apply them in the correct way. However, what makes this indicator even more productive is the possibility of squeezing all the juice out of the situation.
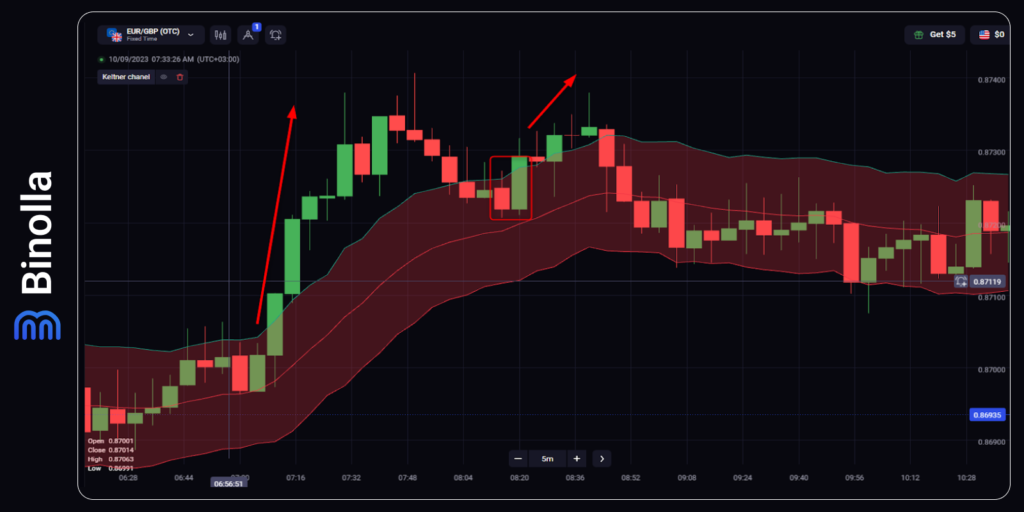
In the example above, you can see two signals that come from this indicator. Moreover, both strategies, trend-following, and breakout, can be applied here. First, after the price makes a breakout of the upper band, you can buy a Higher contract or buy a currency pair/stock and hold the latter.
After a while, the price goes to test the middle line and forms a bullish engulfing pattern there, which is another signal to buy a Higher contract or to buy a currency pair/stock.
In this particular case, you have a clear signal when to exit your Forex or stock trades as the shooting star candlestick pattern appears later.
Keltner Channels vs. Bollinger Bands
The two indicators look very similar, and even some strategies that you can apply when using them also look very similar. However, you should keep in mind that, while they may look like twins, there are some things that make them different.
Keltner Channel uses ATR, while the Bollinger Bands indicator is based on the standard deviation parameter. While the interpretation of signals in both may look similar, the way they are produced may have twists, which, in turn, may lead to situations where these signals will look different.
Keltner Channels in Trading: Video Guide
Key Recommendations for Keltner Channel Interpretation
Like many other technical indicators, the Keltner Channel is very illustrative. However, its simplicity may lead you to the wrong path. Therefore, we have put together some tips that you can read and adjust your trading strategies when using this tool:
- The effectiveness of the indicator depends on the settings. The strategies that we have provided in this article use standard settings (EMA 20, ATR 10, and Multiplier 1). If you adjust them, these strategies may work improperly;
- While Keltner Channel is more of a trend-following indicator, you can configure it to work in a flat;
- Keltner Channel is a standalone indicator, and you can use it as a ready-made trading system. However, to improve your strategies, you can add Japanese candlestick analysis or any other system;
- In some cases, you can see that the price goes beyond lines and makes moves that may make you think that the indicator is not working. In most cases, this happens due to strong fundamentals. Therefore, we recommend following the upcoming data releases in order to know that huge momentum price movements may occur.
Conclusion
Keltner Channel is a trend-following indicator. Therefore, by using it, you can reveal the current market trends and better understand the situation. Moreover, the ATR part of this technical analysis tool allows you to take advantage of situations when the price movement is accelerating.
Being a standalone technical indicator, Keltner Channel allows you to place trades based on its signals. However, it is recommended to use other trading systems to find signal confluences and better react to market changes.
When trading during range markets, you can use the upper band as a resistance level and the lower one as a support one.
Keltner Channel is a great solution for both professionals and beginners. It is very illustrative and requires almost no preparations before you can start using it at full pace.
FAQ

What Does the Keltner Channel Tell You?
The indicator is mostly used to define trends and market volatility.
Is the Keltner Channel Indicator Better than Bollinger Bands?
We can’t say that one of these is better than the other. Both are productive enough and have demonstrated great performance over time.
Is Keltner Channel Leading or Lagging?
The indicator is lagging as it is based on the moving average, which is a lagging indicator as well.
How Do You Use the Keltner Channel?
You can use this technical analysis tool to both reveal the current market trend and find entry points.

