Technical Analysis Introduction: Everything You Should Know About It

Technical analysis is a set of rules that were developed by Charles Dow, a journalist and investor from the US. Those principles describe price behavior and allow traders to find various basic patterns that they can use to predict future price fluctuations. While technical analysis is more about technologies, Dow has elaborated on the basics that are still in use and are unlikely to go out of fashion in the future. To apply your knowledge and start trading, create an account at Binolla.
Contents
Key Postulates of Technical Analysis
When speaking of the basics, it should be mentioned that the following postulates were defined by Charles Dow:
- All the information is included in the price. This assumption can be deciphered, as there is no need to look through market data and fundamental indicators in order to forecast price fluctuations.
- All market movements have trends. According to Charles Dow, everything that happens on the chart can be defined as a trend. A famous journalist distinguished three types of market tendencies:
- primary or major trends that can develop for years;
- secondary market reaction that can last for days and even months;
- minor trends that are limited by days.
- History repeats itself. Those who use technical analysis in trading believe that all the movements, or most of them, that took place in the past will repeat themselves in the future. This postulate was the beginning of pattern analysis, which is one of the most popular ways to predict market prices nowadays.
Technical Analysis: The Main Types
Modern technical analysis comprises two major parts: indicators and chart patterns. Technical indicators are based on math calculations and formulas that allow traders to reveal trends and even forecast how long they will be in place and when a new trend may arise.
Technical indicators, in turn, can be divided into two main sections: trend following and momentum. As it comes from their names, trend following indicators demonstrate the direction of the current price movement, while momentum indicators may help find the end of a trend or the beginnings of a correction.
The most popular technical indicators include the moving average (MA), the relative strength index (RSI), the moving average convergence divergence (MACD), the Bollinger Bands (BB), and others.
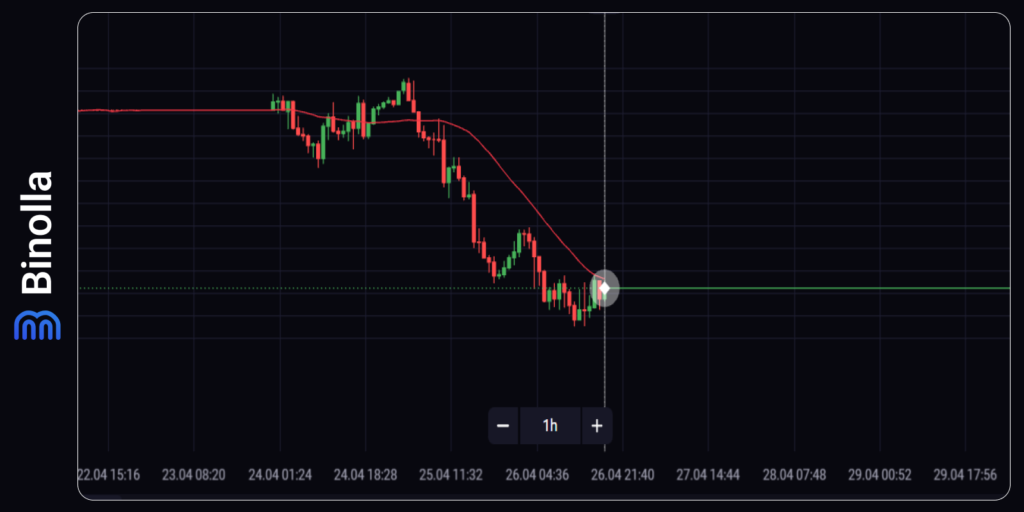
Here is an example of a moving average and its application in trading. As you can see, the red line follows the trend, indicating that there is a downtrend on this part of the chart.
It should be mentioned that a lot of strategies are based on this part of technical analysis. Some indicators are used separately, and some strategies are based on several technical tools of this type.
Chart patterns, on the other hand, are based on a subjective view of the market. Those who use it tend to find so-called patterns to identify special signals or market reverse points. The basic tools of this type of technical analysis are support and resistance lines, trend lines, price channels, etc.
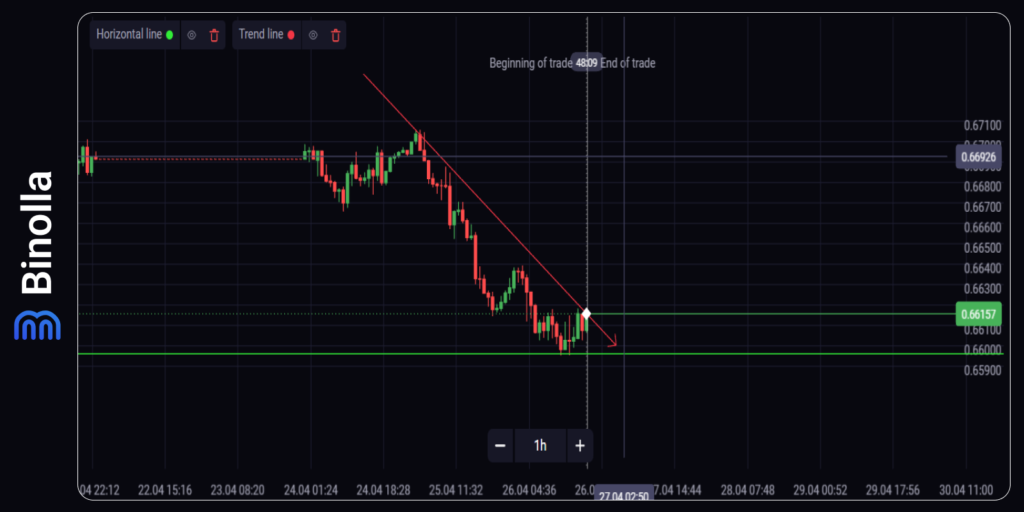
The example above shows a green support line and a red trend line. According to those two technical analysis tools, we can say that the green line prevents the price from going lower, while the red line indicates that the market is still bearish.
Technical Analysis Basic Strategies
There are plenty of strategies that you can apply when trading with technical analysis. Some of them are simple and straightforward, while others may seem a bit complicated. We are going to provide several examples of trading strategies that you can use when working with technical analysis.
Range Strategies
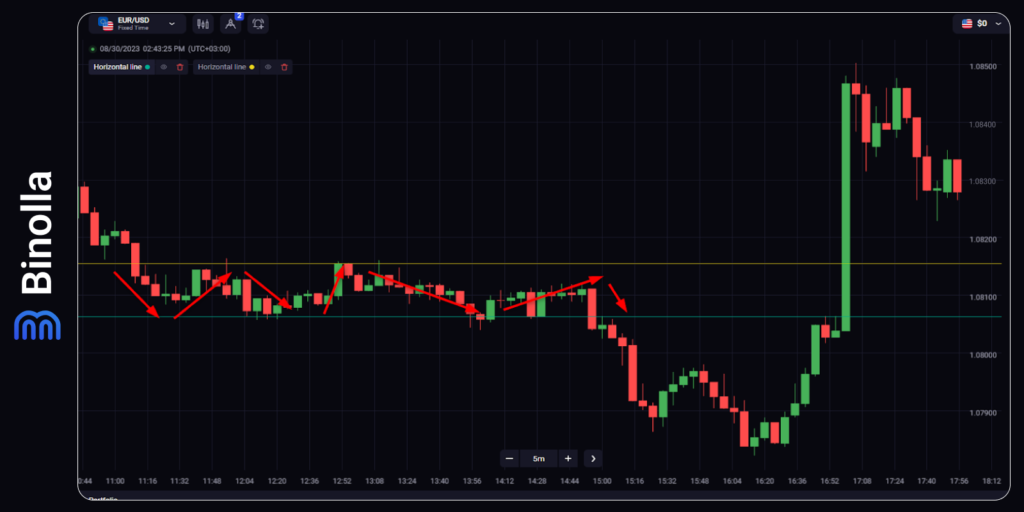
This first and one of the most popular strategies, be it digital options, Forex, or stock trading, is one where you trade inside the range. While FX and stock traders sometimes avoid it as they prefer to catch bigger trends and make more money on a single price movement, digital options traders use this strategy as it allows them to make up to 95% of their investment amounts on relatively small price fluctuations.
The idea behind this strategy is to catch the moment when the price rejects a support or assistance level. If it bounces off the resistance level, you buy a Lower contract or simply sell an asset, while when it reverses close to the support level, you buy a Higher contract or buy an asset.
As you can see, the strategy is very straightforward. When the price is cloaked inside a range that is built by the support and resistance levels, you can try to make money there. However, you shouldn’t forget about a couple of things:
- Fake breakouts are possible. Sometimes you can see that the price goes above the resistance level or below the support line, and then it returns back to the range. Therefore, it is better to buy digital options or CFDs when the reversal is confirmed;
- Ranges do not last forever. At some point, the price leaves the range, providing you with another trading opportunity.
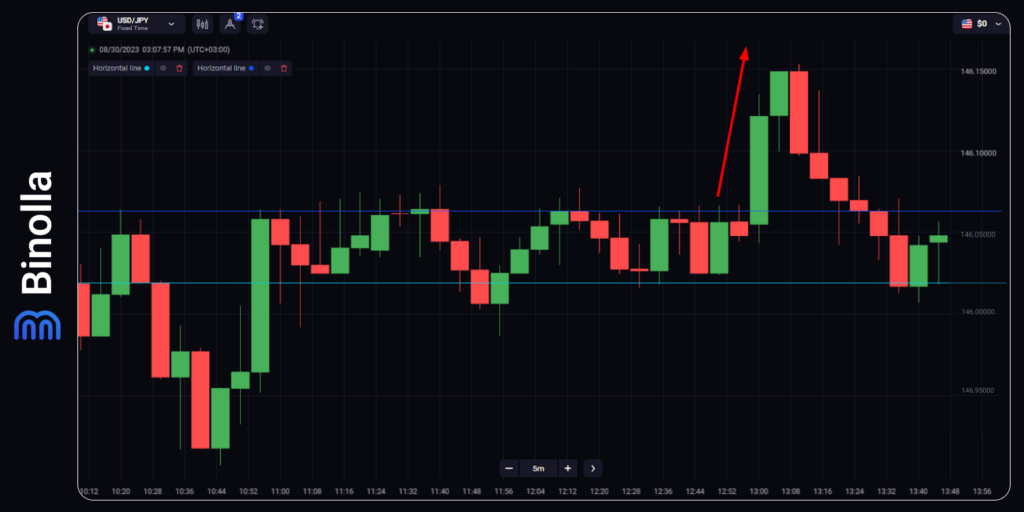
The example above illustrates the situation when the price leaves the range. It may happen in both directions, but here the price breaks the upper boundary. As you can see, the price accelerates once it leaves the range, which is a great trading opportunity for digital options and FX CFD traders. The breakout of this type allows you to buy a Higher contract or simply buy a currency pair or a stock, expecting them to develop their growth.
Indicator Strategies
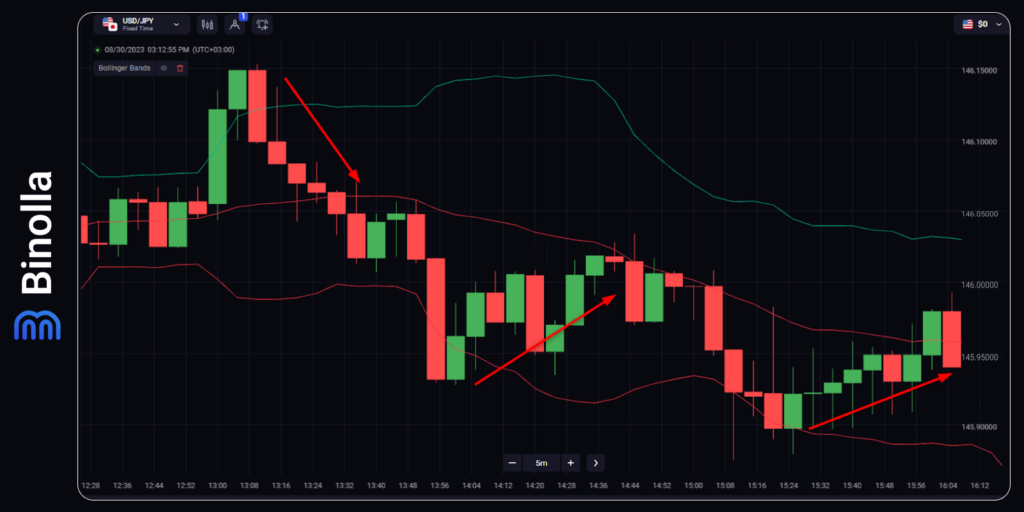
Indicators are very popular among traders for providing them with useful information about the current price and its possible behavior in the future. One of the indicators that you can use to trade digital options or FX CFDs is Bollinger Bands.
There are plenty of strategies that you can use when applying Bollinger Bands, but we are going to provide you with one that is very popular and effective. To use it, you need to apply the BB indicator and watch for the moments when the price tests its boundaries. The idea is to trade when the boundaries are rejected by the price.
If the price reverses close to the upper band, then you should buy a Lower contract or sell. On the other hand, if this happens close to the lower band, you should buy a Higher contract or simply buy.
There are many other strategies that you can use when applying a single or even a combination of technical analysis tools.
Technical Analysis vs. Fundamental Analysis
Both types of analysis are two major tools that allow traders to make rational market decisions based on price and fundamental data. While technical analysis relies on trends and revolves around price movements, fundamental analysts look at macroeconomic data and balance sheets.
When speaking about the difference between the two, it should be mentioned that:
- Technical analysis requires no knowledge of economics. Therefore, you don’t need to have a special education in order to engage in trading;
- When using technical analysis, you don’t need to spend a lot of time looking through key macroeconomic data or arrays of companies’ statistics in order to find out whether a particular asset is attractive enough to be bought. The idea is to find all the answers to the main questions on the chart;
- Technical analysis is about visualization. When you use indicators or chart patterns, they indicate the price direction or show clear reverse signals that can be read by traders with even basic experience in trading;
- Technical analysis can be applied to all timeframes. Whatever your trading style is, you can use technical analysis to find entry points and even limit your trading risks. From digital options with a 15-second expiration to long-term trades, technical analysis allows traders to forecast future price movements in every timeframe.
Technical Analysis Limitations
While technical analysis offers enough benefits to traders, there are some things that you should consider on the other side:
- Technical analysis is subjective. While the indicators show the same signals, they may be interpreted in different ways. Moreover, when it comes to trading patterns, they are even more subjective, as some traders will find those patterns where others will see nothing on the chart.
- Technical analysis ignores the fundamentals. As it was already mentioned, the price includes all the data. This is true, but in some cases, when fundamentals are above or below expectations, this may result in unpredictable price fluctuations that will break even evident patterns or indicator signals.
Final Provisions
Technical analysis is a great opportunity for traders to start their careers in the financial markets. While it is not 100% accurate and requires knowledge, it is still one of the easiest ways to make the first steps in trading.
FAQ

What is Technical Analysis?
This is one of the methods used to analyze market prices using charts and various technical analysis tools. Unlike fundamental analysis, in technical analysis, you rely only on the price and its fluctuations without paying attention to the fundamentals.
How Do I Do Technical Analysis?
First, you should choose your type of chart. Then you need to pick one of the technical analysis methods. Keep in mind that you can combine drawing tools with indicators to make it even more effective.
Is Technical Analysis Hard to Learn?
No, it is not. You don’t need any knowledge of economics or finances to predict price fluctuations. All you need to do is understand how technical analysis tools work and apply them.
Is Technical Analysis Always Correct?
No, it isn’t. Technical analysis may fail in some cases. This is why you need to have a good money and risk management plan to avoid critical mistakes in trading.


