Indicators for Trading: Recommendations

Trading indicators are among the most popular analysis tools that digital options, FX CFD, and stock traders often use in their strategies. Trading with indicators allows market participants to rely on math formulas and find more precise entry points. However, one of the biggest problems that traders often face is that they do not know how to use those indicators for trading properly. Moreover, sometimes beginner traders start using those tools without even trying to look under the hood. By reading this article, you will learn more about the secrets of indicators for trading and how to properly use them in your strategies. Use trading indicators on the Binolla platform and create an account now.
Contents
Indicators for Trading Basics
Trading indicators are considered the alpha and omega of technical analysis. They are used by millions of traders worldwide. The popularity of these tools owes much to their simplicity and obviousness. When you look at charts that are augmented with indicators, you can quickly find the current trend or find the moments when the price is overbought or oversold.
One of the greatest advantages of trading indicators is that they provide you with a clear picture of the current market situation. For instance, if you take the basic moving average, you can see the direction of the price movement without drawing a trendline or applying any other graphic tools.
Trading indicators have two main features. They are based on math formulas, which conduct all the necessary calculations, and they draw lines and curves automatically on charts.
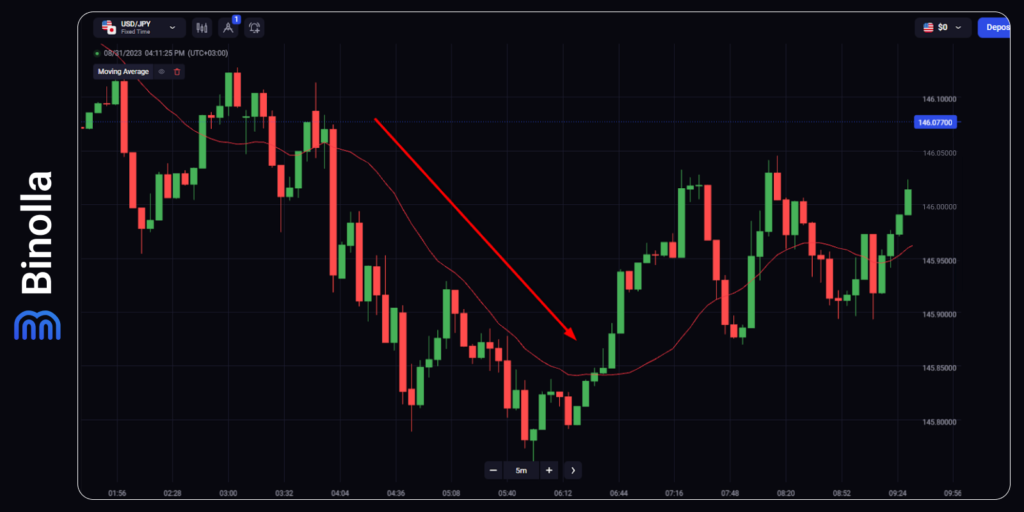
Let’s have a look at the chart above. We have added a simple moving average with a period of 20. Now we can see the downtrend, which has developed for some time. After the downtrend is done, the indicator crosses the price and the uptrend dominates for some time.
The key benefit here is that you don’t need to do anything after you apply the indicator and set a period that you find appropriate for this particular technical analysis tool. The indicator will be drawn automatically after new calculations are done. Keep in mind that there is no magic behind any of these tools. They are based solely on formulas, and you can even create your own indicator after you become a more experienced trader.
Technical Indicators: Tips and Tricks
While technical indicators may seem very simple when it comes to what they show, using them may be tricky, especially if you don’t know the basics of the tool that you are going to apply. Therefore, we would like to provide you with some recommendations that will be helpful to all those who are at their starting point in learning technical indicators for trading.
Learn More about the Indicator First
The first thing that you should do before applying any indicator is to learn more about the basics of the technical analysis tool. This will allow you to use it in a more precise manner and better understand when to rely on its signals and when to skip them.
Play with the Settings
All indicators have settings that you can adjust according to your preferences. Such tools as moving averages and the indicators that are based on them allow you to set the period. Briefly, the period is the number of candlesticks that will be included in the calculations.
Keep in mind that there is no golden rule for setting the period. If you add fewer candlesticks, you will see the indicator closer to the price. However, there will be a lot of false signals as the indicator will be more flexible.
When it comes to higher periods, the line is more straight, but the signals are less frequent, and they come with a higher latency. Therefore, when setting the indicator, you should keep these rules in mind and think about your priorities when trading with indicators.
Don’t Add a Lot of Indicators
“The more, the better” rule doesn’t work when it comes to technical analysis indicators. Sometimes even one tool of this type can provide you with outstanding entry points, while if you use a lot of them simultaneously, you may have contradictory signals and miss some interesting entry points.
Each time you add an indicator to the chart, you should understand its purpose. For instance, if you apply a moving average along with Bollinger Bands, this combination gives you nothing, as both are great at defining trends. Moreover, the BB indicator has its moving average already, which means that adding another moving average is useless.
Adapt to Market Conditions
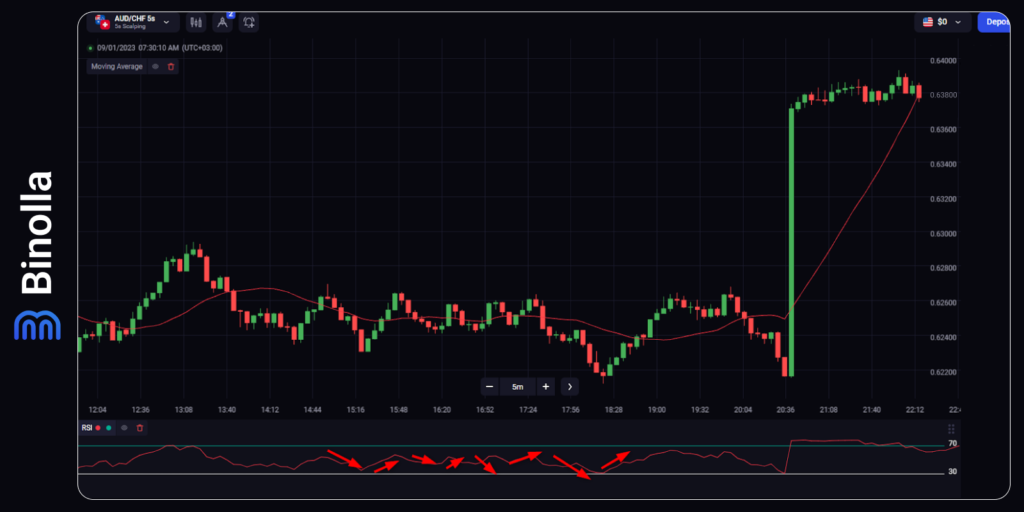
Adapting to market conditions is a very important point that every trader should take into consideration. The example above shows the range situation when the price has no clear direction. As you can see, the moving average is useless at this moment as it goes straight. However, once you apply a momentum indicator like RSI or any other, you will have a lot of trading opportunities.
This is how to adapt to market conditions. If the price is in the range, trend-following indicators like the moving average can be completely useless, while momentum oscillators like Stochastic or RSI can be of great value as they allow traders to find entry points or to confirm that the price is not going to move to the overbought/oversold areas.
Overreliance on Indicators for Trading
This is one of the most common mistakes that most beginner traders make when they start using technical indicators. They rely on them completely without doubting their power and being sure of their absolute accuracy. However, the truth is that these indicators for trading are not 100% reliable.
You should analyze each particular case and make data-driven decisions instead of blindly following what a technical analysis tool shows you. Keep in mind that most trend-following indicators are lagging, which means that you will receive signals a bit later. Moreover, depending on your settings, you may receive a portion of fake entry points.
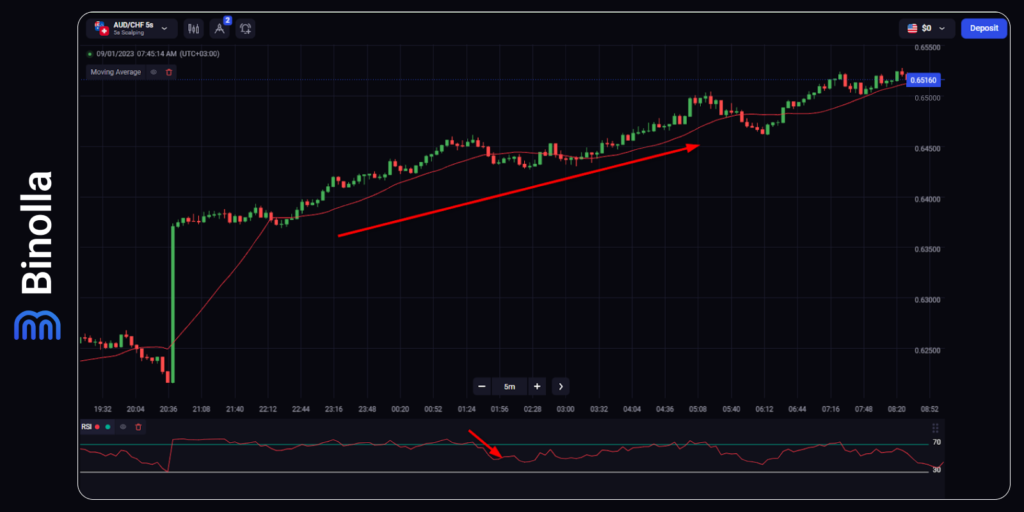
The example above shows the uptrend, which is confirmed by the moving average. However, RSI leaves the overbought area at some point, which gives a signal to sell or buy a Lower digital options contract.
If you trade digital options, those counter-trend signals may be useful, as you can be rewarded with up to 95% of your investment amount even on the slightest movements. When it comes to stock trading or Forex CFDs, making money on even the faintest movements is almost impossible. Moreover, you will have to put a lot of money at risk in order to make any significant profits. Therefore, for such traders, overreliance on indicators may end in failure.
Use Technical Indicators to Place Stop Losses and Take Profits
Money and risk management are crucial in trading. You can’t build a strategy that will provide you with 100% reliable trading signals all the time. Therefore, risk management comes into play here.
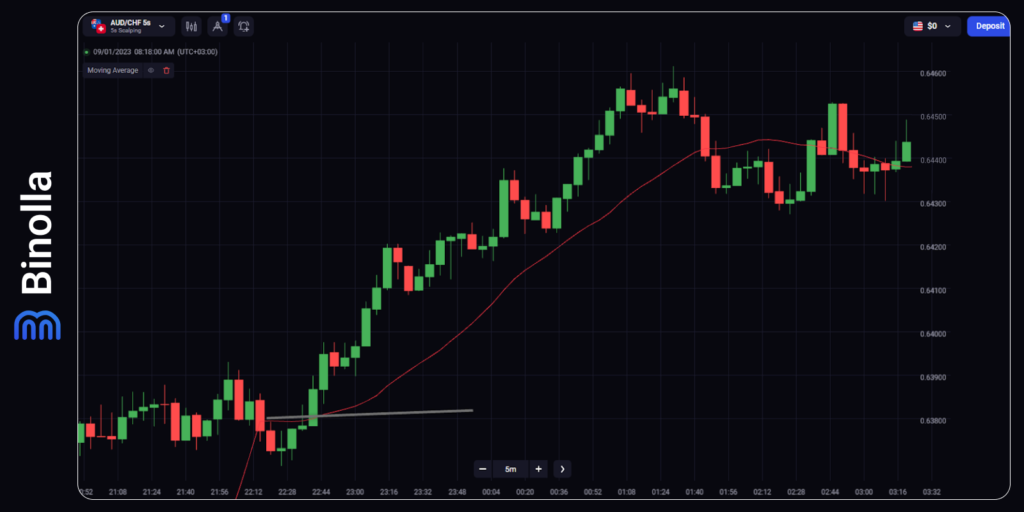
If you trade digital options, you don’t need to manage your risks due to the nature of these contracts. You can’t lose more than your single investment. However, for Forex or stock traders, who can lose significant amounts even in a single trade, managing risks is very important. The first thing that you should think about when placing a trade is putting a stop loss. When using moving averages, for instance, you can do it by simply placing a stop loss order below the moving average when it comes to the uptrend.
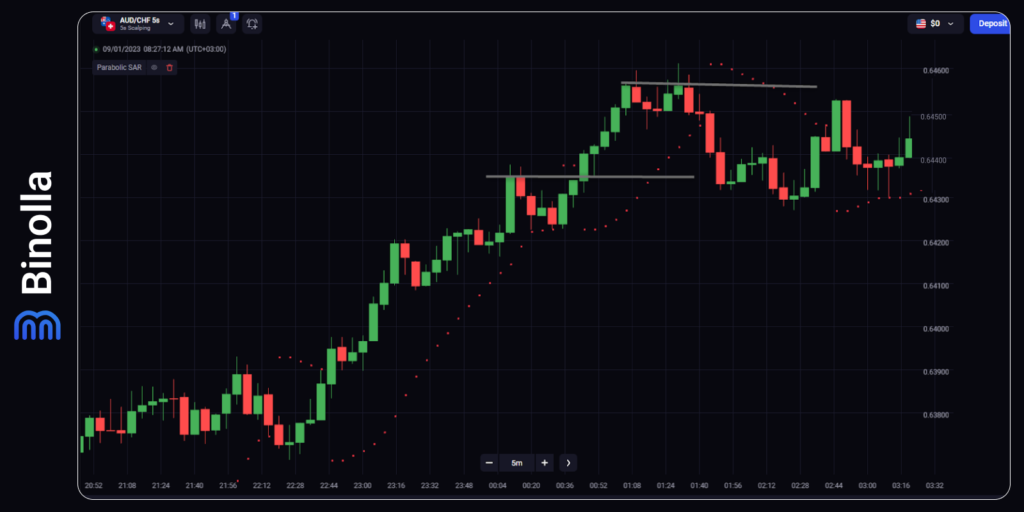
When it comes to setting goals, using indicators is almost impossible if you want to place a take-profit order. However, you can use such tools as Parabolic SAR, for instance, and define where to leave the market manually.
In the example above, we have drawn two horizontal grey lines. Once the uptrend stops for a while, you can leave the market as the Parabolic SAR points appear above the price.
Once the indicator dives below the price again, you can reopen your trade and wait for the dots to jump over the price one more time.
Final words
Indicators for trading are very important as they allow you to have a clear picture of the price movement direction as well as help traders find precise entry points even without drawing a single line on charts. However, it is important to know how these indicators work and how to adjust them to various market conditions.
While using indicators may seem pretty simple and obvious, there are some things that should be considered before you apply them to your chart. The recommendations that we gave in this article will allow you to make your trading system even more reliable and effective.
FAQ

What is the Best Trading Indicator?
There is no best trading indicator at all. Each of them may be very helpful in a particular situation, depending on the level of your awareness about such a tool and its performance. For instance, when using a trend-following indicator, you can expect it to show you the current market trend, while when using an oscillator, you can find entry points for price reversals and market corrections.
What Are Professional Indicators for Trading?
All indicators that are available on the Binolla platform can be considered professional. Moreover, you will be able to create your own one over time and if it has meaning, you will apply it and build a strategy around your own indicator.
How Many Indicators Should I Apply to Build a Great Strategy?
There is no golden rule when it comes to the number of indicators to use. The only thing that you should think about is their effectiveness. Sometimes it is enough to apply a single indicator and build a strategy around it. Some traders use a couple of technical analysis tools of this type to create their own trading systems.
What Is the Difference Between Technical and Economic Indicators?
Economic indicators are numbers that illustrate inflation, economic growth, and various important indexes. When it comes to technical indicators, are formulas that draw lines and dots on charts, helping traders to predict future price fluctuations based on the asset’s history.


