How to Add Drawing Tools to the MetaTrader 5 Platform: A Detailed Guide

The MetaTrader 5 trading platform offers a lot of technical analysis tools allowing traders to make informed trading decisions. The trading terminal offers a variety of drawing tools from the simplest ones that include only one line to more sophisticated ones, such as Fibonacci retracement, Andrews pitchfork, Gann, and many others. By reading this guide, you will learn more about how to add drawing tools to the MT5 platform. Traders will find some useful recommendations on how to use some of the most popular drawing tools.
Join Binolla now and use a variety of drawing tools to capitalize on price fluctuations!
Contents
- 1 How to Add Your First Horizontal Line on the MetaTrader 5 Platform
- 2 Adding Two Drawing Tools to Pinpoint a Range
- 3 How to Set Up Drawing Tools on the MetaTrader 5 Platform
- 4 Try various drawing tools on the MT5 platform!
- 5 How to Delete a Drawing Tool from the Chart
- 6 The Most Popular Drawing Tools on the MetaTrader 5 Platform
- 7 FAQ
How to Add Your First Horizontal Line on the MetaTrader 5 Platform
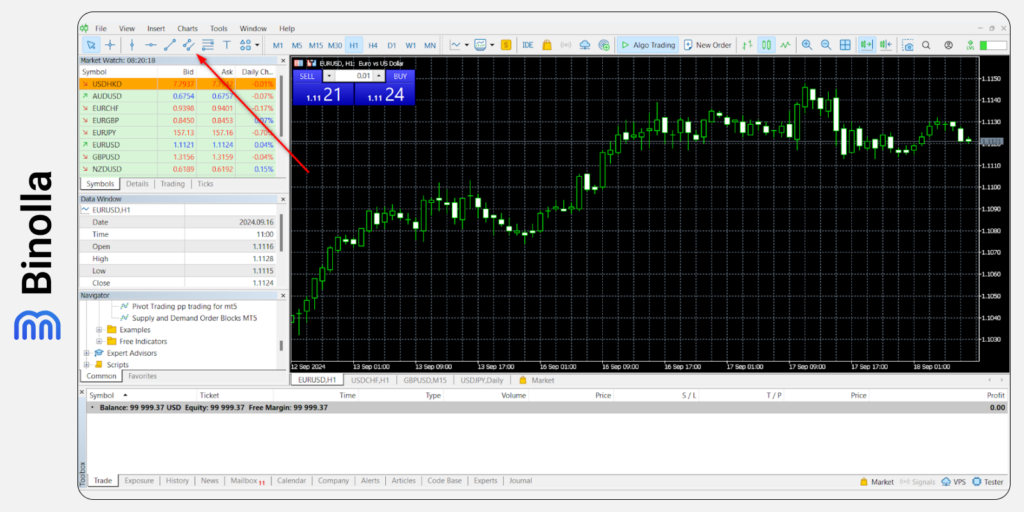
Before adding your first drawing tool, it is worth checking where you can find all of them. The quickest way to add some of the most popular drawing tools is to use the menu right above the Market Watch tab. By clicking on any icon there, you can quickly draw support, resistance, or even a trend line. Let’s see how to do it in the trading terminal.
1: Click on the Horizontal Icon in the Menu
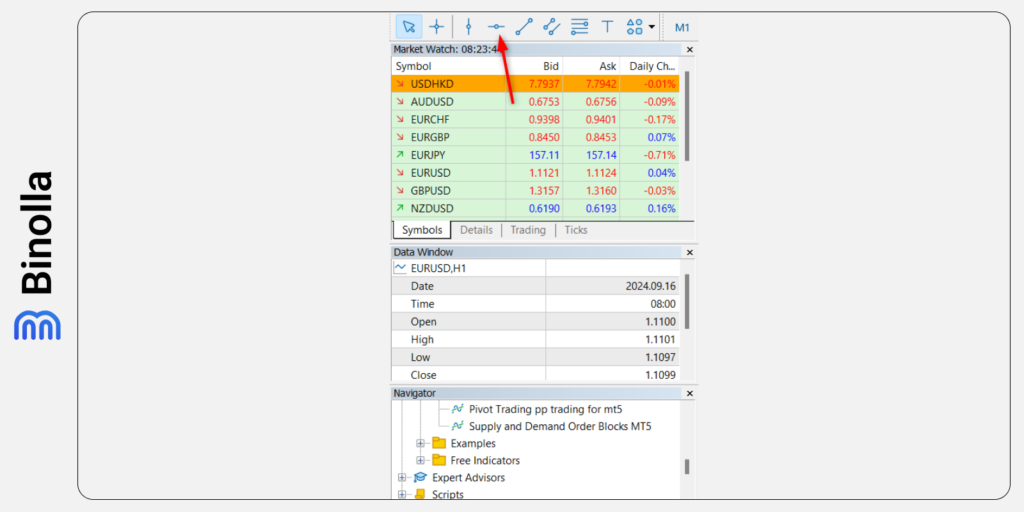
First, you need to move the cursor to the menu above the Market Watch tab and click the Horizontal line there.
2: Click on Any Point on the Chart
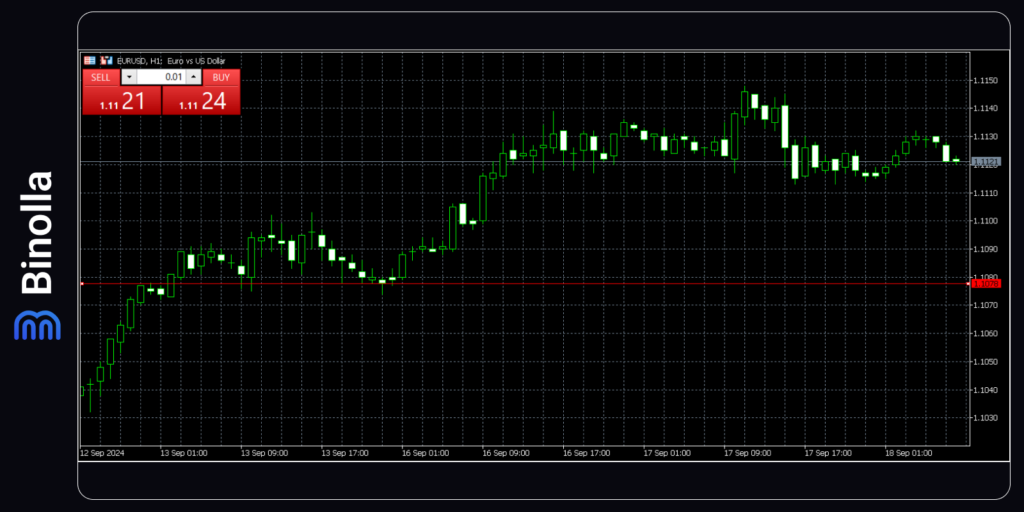
Now that you have selected the Horizontal line tool from the menu, you need to click on any point of the chart. The line will appear there.
3: Adjust the Line
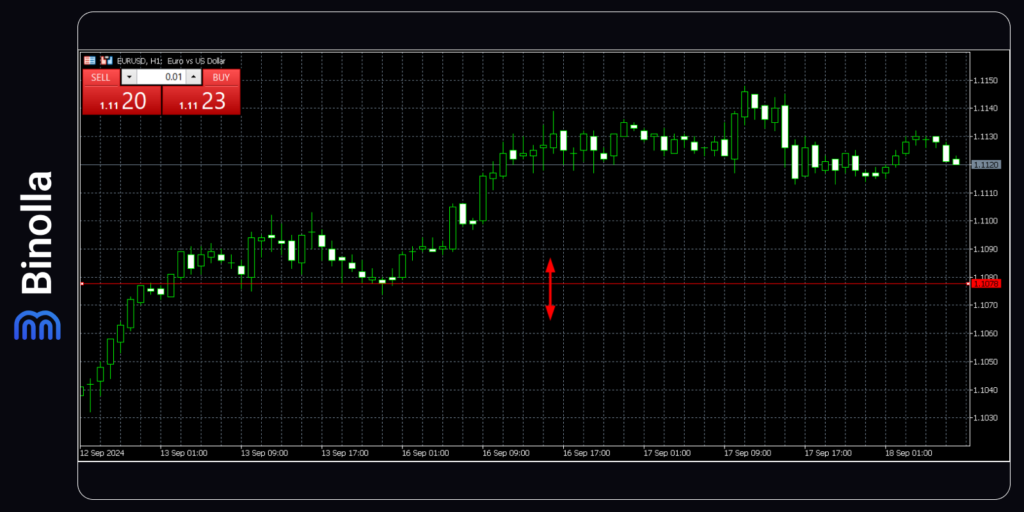
After you have added the Horizontal line to the chart, you can adjust it. Simply click and hold and move the mouse up or down to pinpoint support or resistance.
Binolla Tip
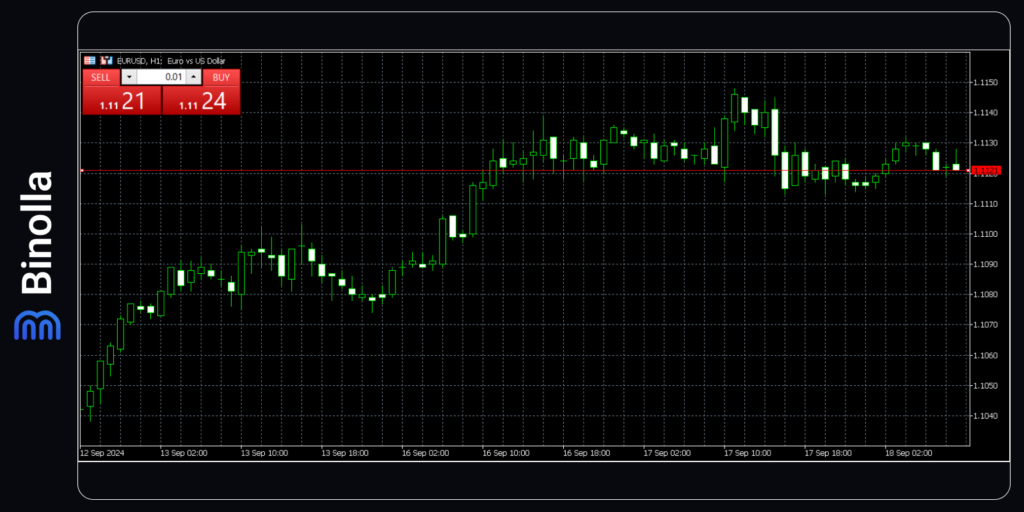
To draw a support line, you need to find at least two consecutive lows. The more points this line includes, the better. The support line in trading helps traders identify where buyers have a higher interest in going long. Keep in mind that while support is a line, it is better to use a support zone or area as the price may reverse there slightly above or below the previous low.
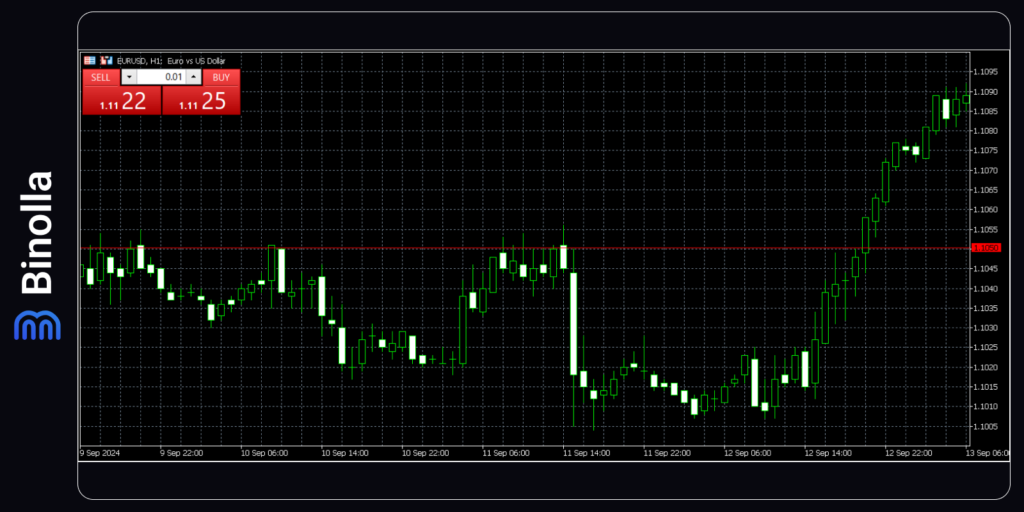
When it comes to resistance, to draw it, you need to find at least two highs that are located on a single horizontal line. As you can see, we have drawn a resistance level in the picture above. Keep in mind that similar to support, resistance is named level, but in reality, it is an area. You can see that some candlestick shadows go beyond the line.
Adding Two Drawing Tools to Pinpoint a Range
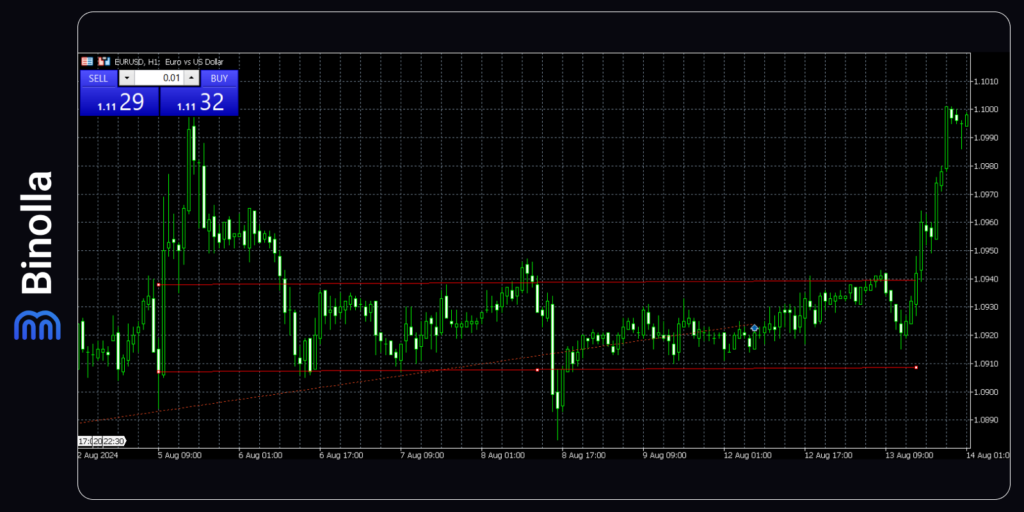
Traders often add two horizontal lines instead of one in order to see where the price ranges. Such ranges allow traders to outline areas where the price may fluctuate from one line to another allowing market participants to buy and sell.
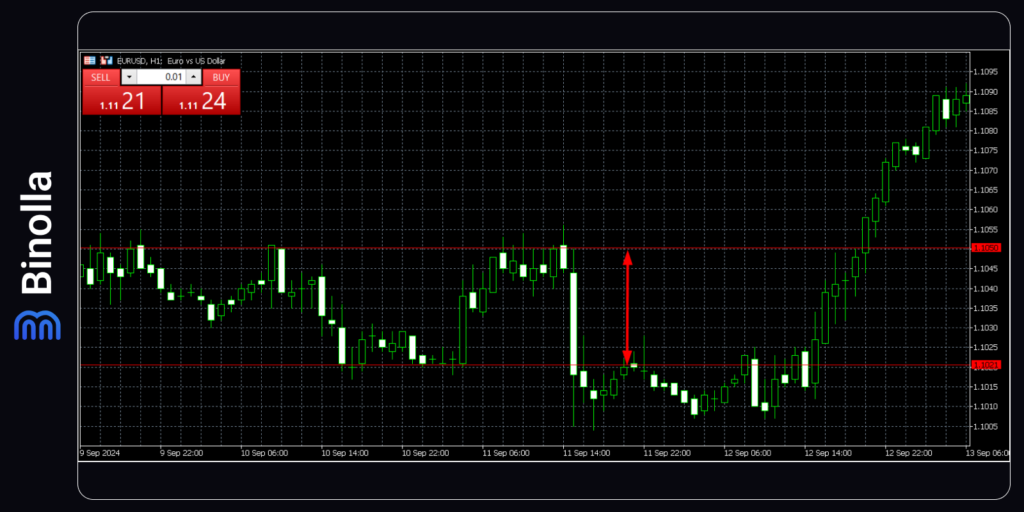
To draw a range, let’s look at the alternative way of adding drawing tools on the MT5 platform. Here is how you can do it.
1: Go to the Main Menu
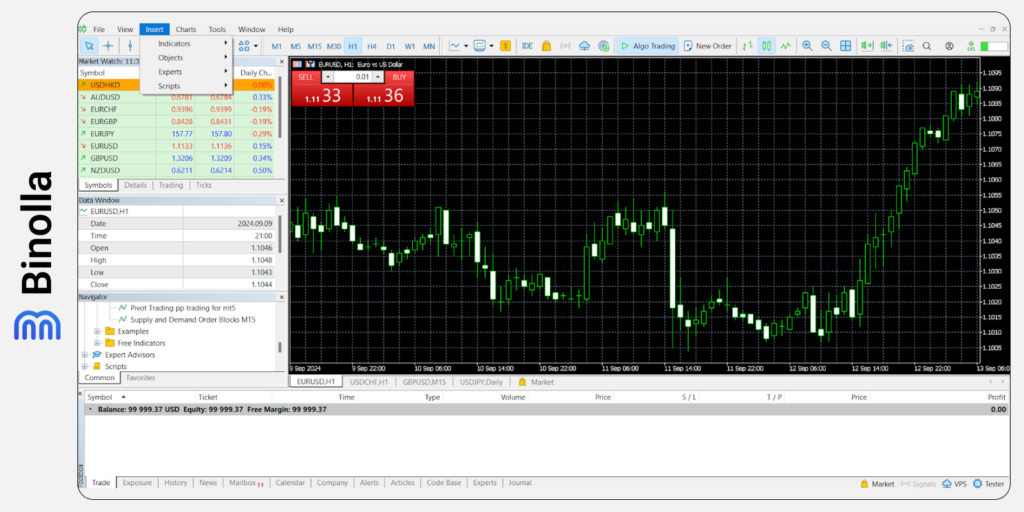
Move the cursor towards the main menu of the platform. Choose Insert there. Select Objects.
2: Choose Your Preferred Drawing Tool
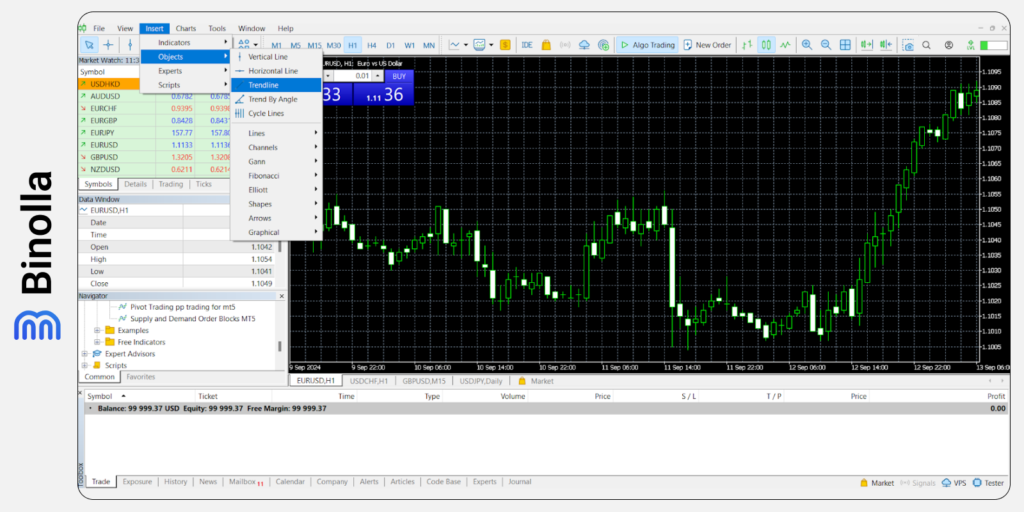
Now you will see a list with drawing tools that are available on the MetaTrader 5 platform. Simple move the cursor and click on one you want to add.
3: Adjust the Drawing Tool
Similar to what we have already done, after a drawing tool is added to the platform, you can adjust it. Simply click and drag the line to any point on the chart.
Adding the Second Drawing Tool
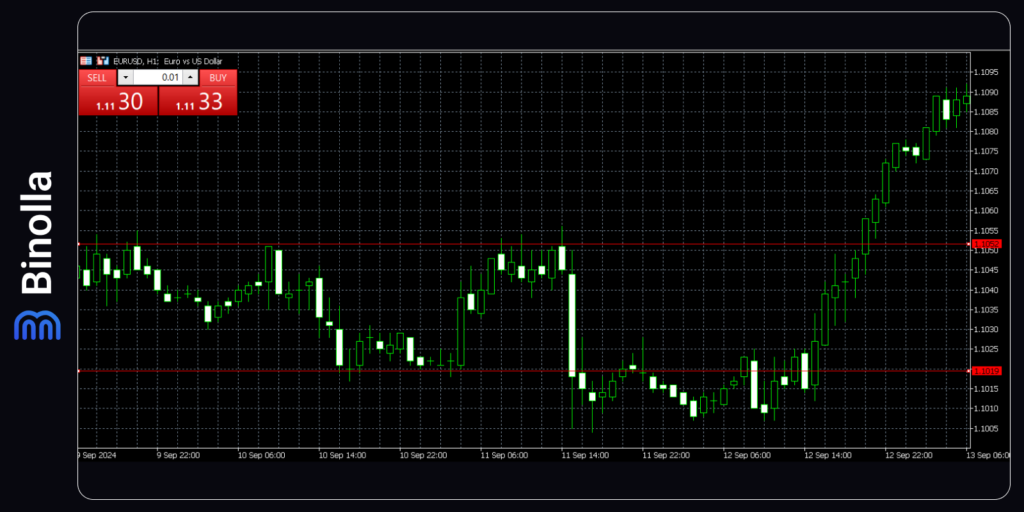
Now that you have added one line, you can repeat the steps to add the second one. Use the upper or the main menu to add the Horizontal line to the chart. As you can see, now we have a range with the price fluctuating within it.
Binolla Tip
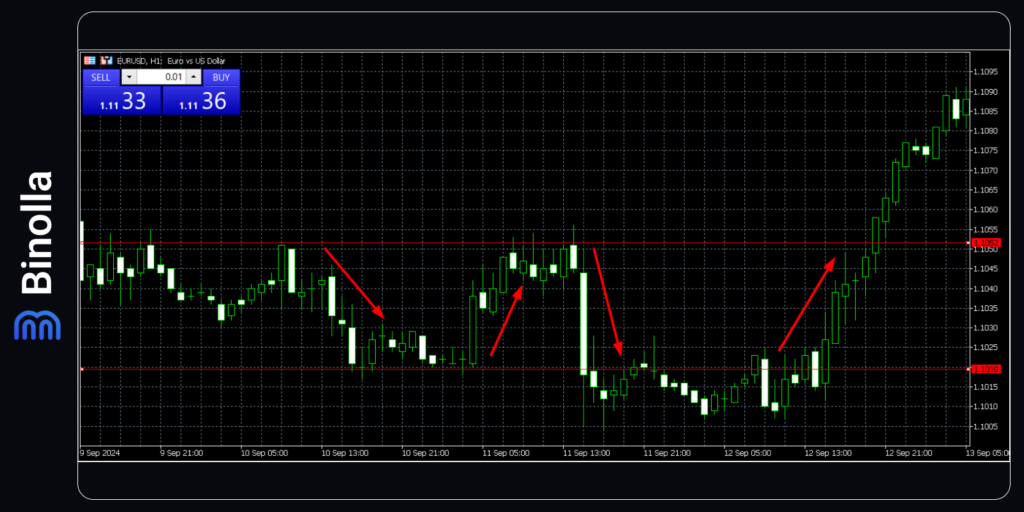
After drawing a range, you can find some trading opportunities there. When the price tests the support level, you can buy, while when it rebounds from the resistance, you can sell. This is one of the easiest strategies that most traders use. However, keep in mind that it works better with price action or technical indicators.
How to Set Up Drawing Tools on the MetaTrader 5 Platform
Traders can also set up drawing tools when using the MetaTrader 5 platform. This will change some visuals to make it more comfortable to use such tools. Find out more about how to do it in the following lines.
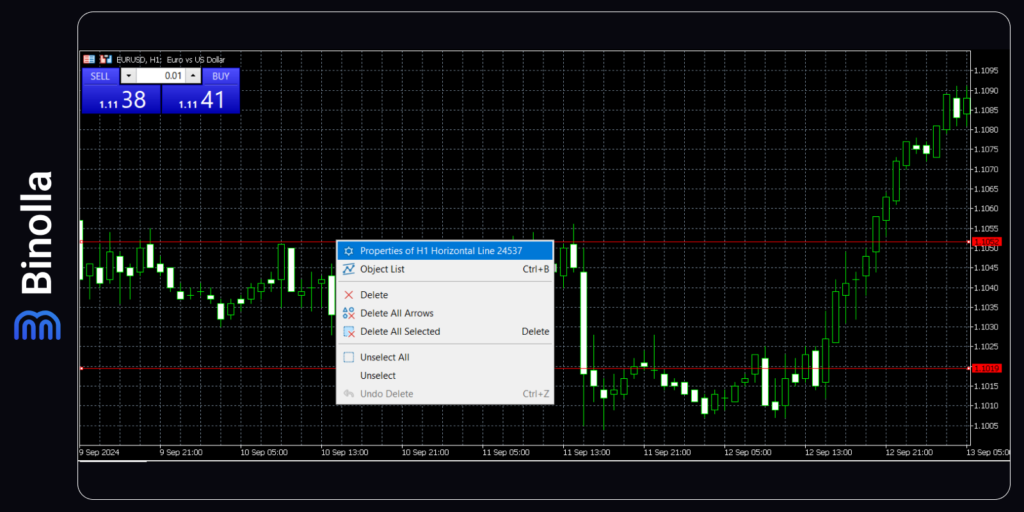
To start setting up a drawing tool, you need to right-click on it when it is on the chart. You will see a popup menu. Click on Properties to launch the setup menu.
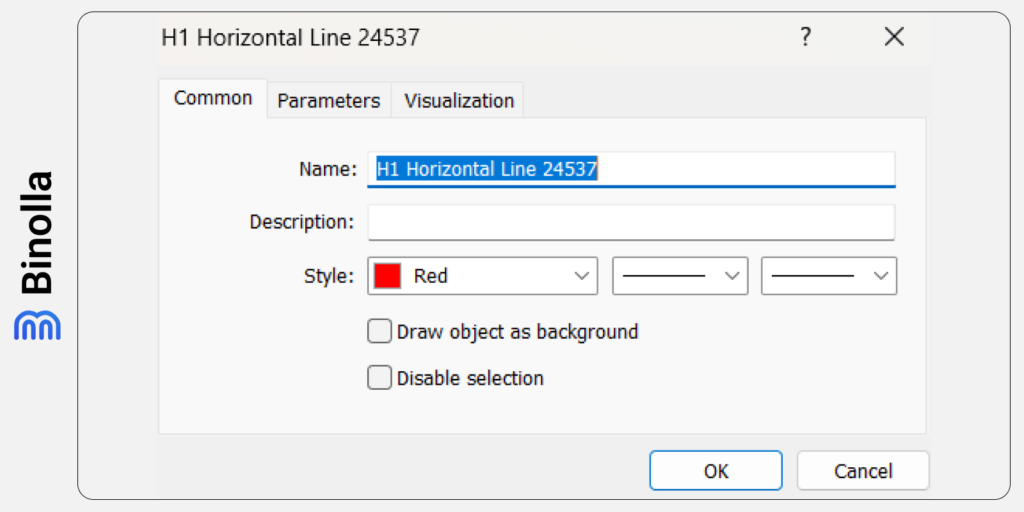
Once you have opened the setup menu, you will see all the available settings. In particular, here you can find the following options:
- Name. Here you can change the name of the drawing tool;
- Description. Add a description that will be demonstrated on the chart;
- Style. Here you can change the color of the line, as well as to change its thickness.
You can also change the parameters of the Horizontal line. The only one is the price level, which is known as Value on the platform. Here you can adjust the position of the line according to a particular level. For instance, if you want the line to be at 1.0900 when trading EUR/USD, you can do it here.
How to Delete a Drawing Tool from the Chart
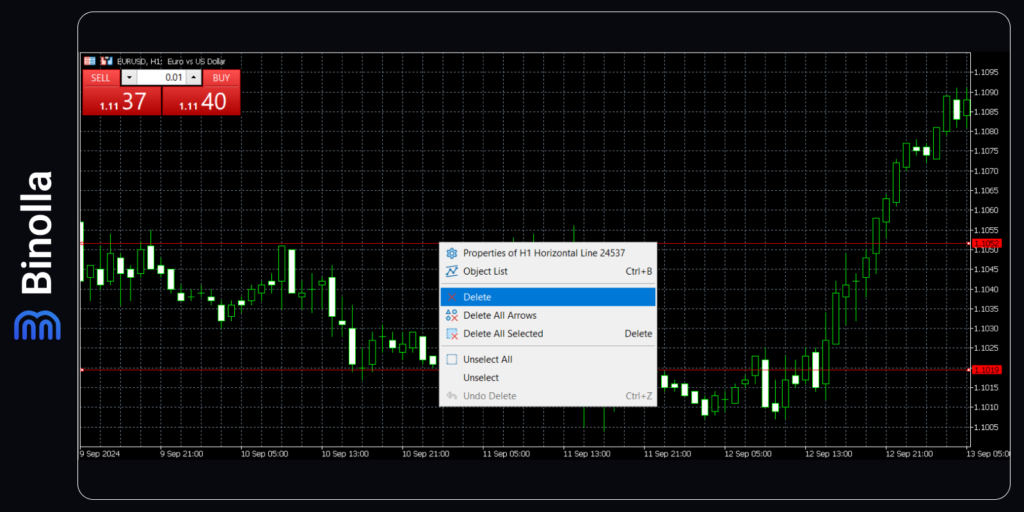
If you don’t need a drawing tool anymore, you can remove it from chart. To do that, follow there steps:
- Right-click on the line.
- Choose Delete in the popup window.
- Click Delete to remove the line.
The Most Popular Drawing Tools on the MetaTrader 5 Platform
Horizontal line is not the only tool that you can use on the MT5 platform. There are plenty of others that are very useful. Find out more about them in the following paragraphs.
Trendline
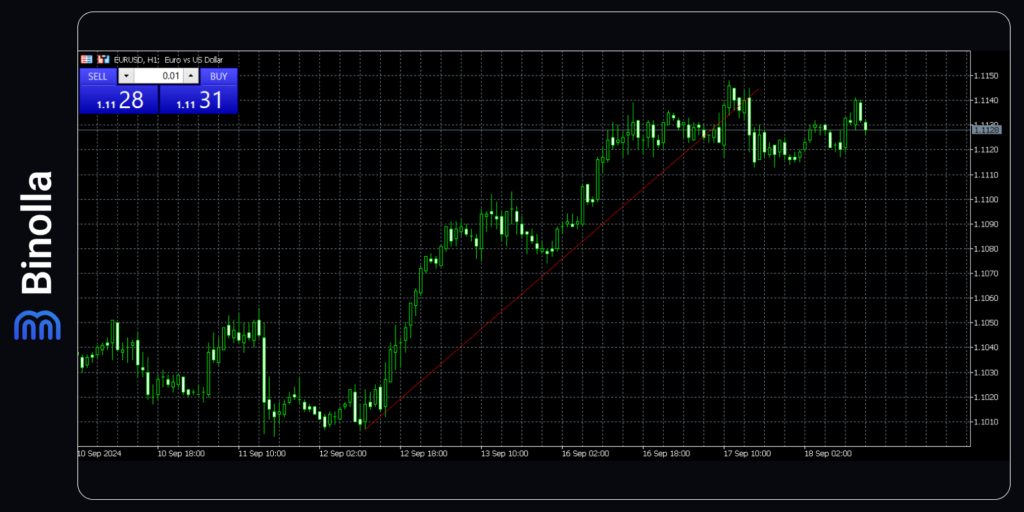
To pinpoint trends, traders do not need to add a moving average to the chart. They can use a trendline that is available on the platform. To add one, you need to go to the menu with drawing tools and click on the icon with a trendline there.
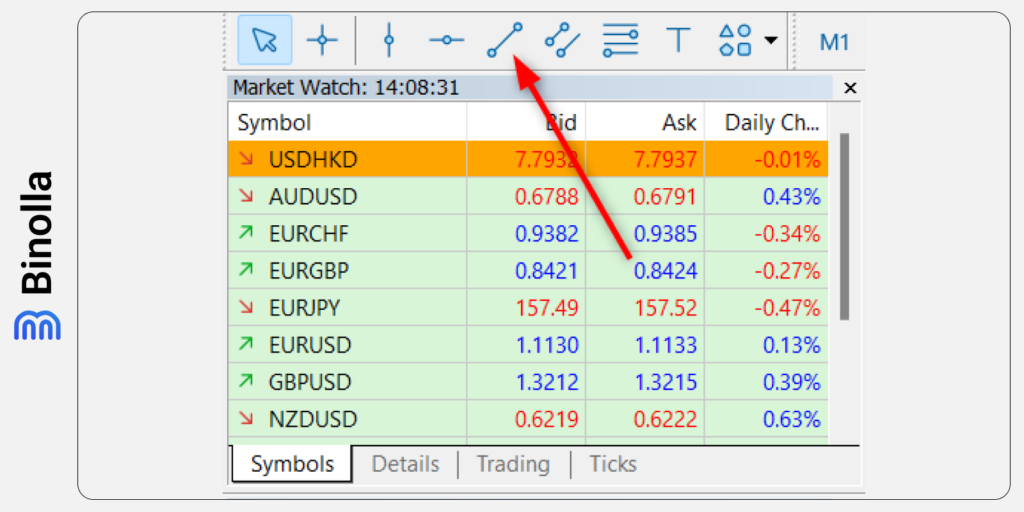
Once you click on the icon, you need to click on the chart and then drag the trendline along the trend. To draw an ascending trendline, you need to find a situation when lows become higher. A descending trendline is drawn through lower highs.
A trendline can be used not only to identify market trends. This is a very useful tool for finding entry points. One of the easiest ways to trade using the trendline is to find points when the price rebounds.
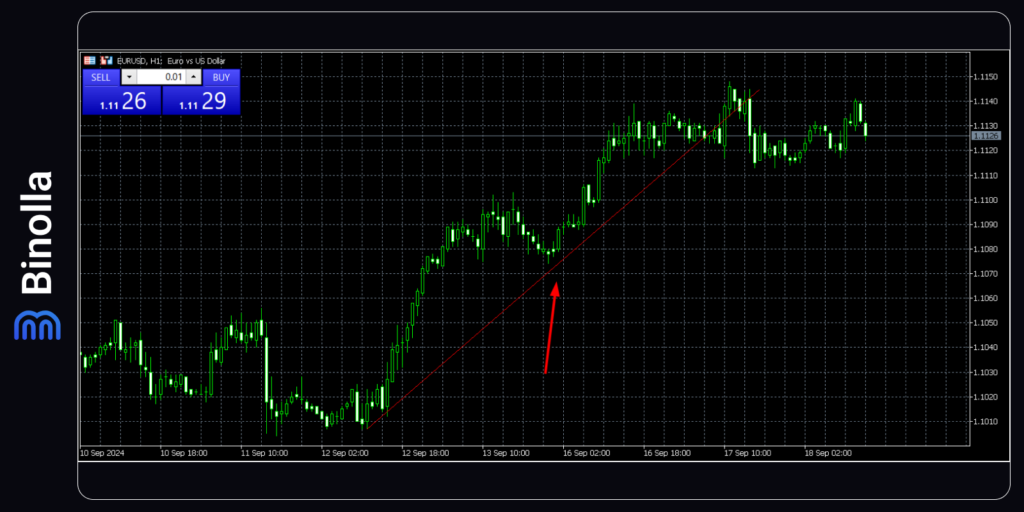
In this particular example, you can see that the price goes back to the trendline before moving higher. Traders can buy once the price rebounds from the trendline. This strategy can be enhanced by adding price action or some technical indicators like moving averages, RSI, Stochastic, and others.
Equidistant Channels
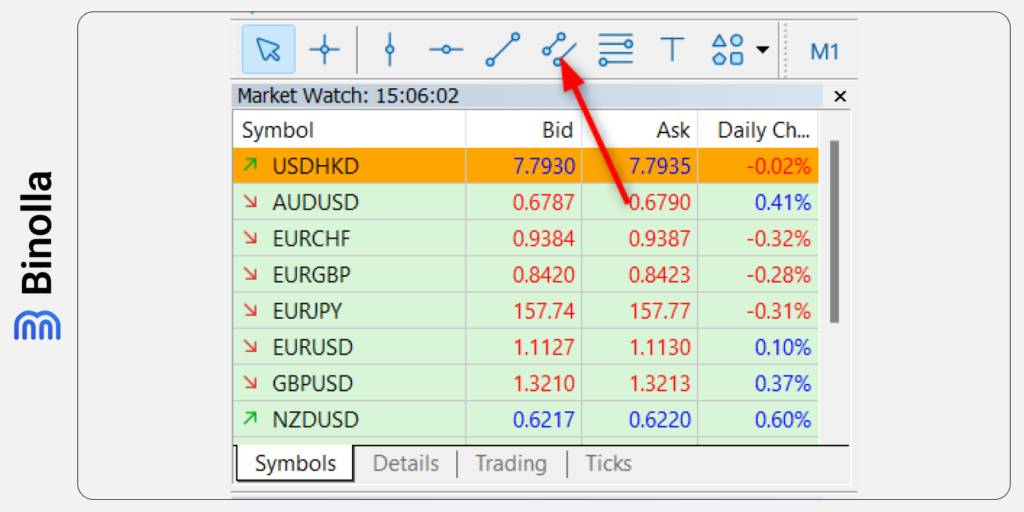
Another popular tool that is widely used by traders is an equidistant channel. It is based on the support and resistance concept, but you can draw it when the price is trending. This channel allows you to pinpoint trends and know exactly when a correction to the main price movement can begin.
To add an equidistant channel, you need to click on the icon in the tool’s menu above Market Watch. Then, you need to click on the beginning of the tendency on the chart and drag it along the trend.
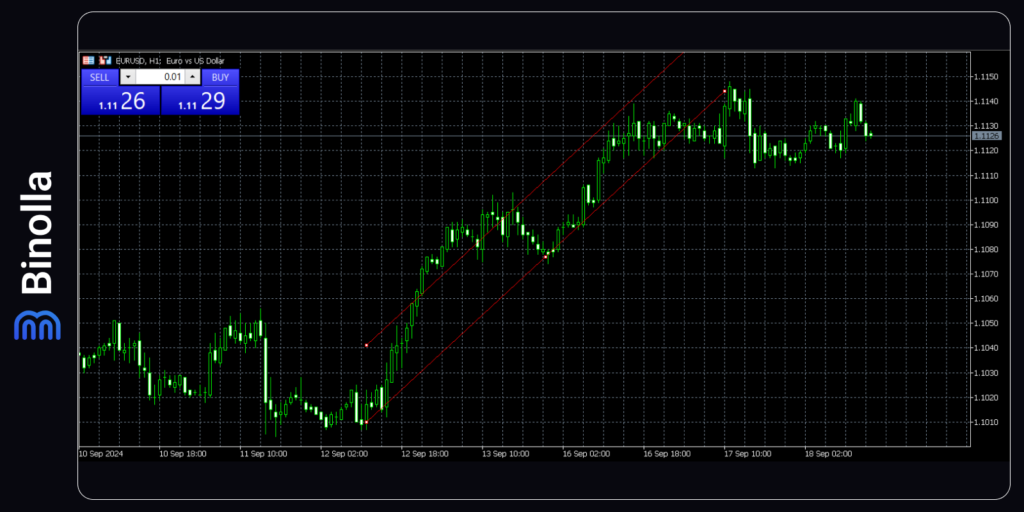
Now you see that the price is channeled. You can adjust both lines to make it even more comfortable to use this tool. Keep in mind that the price may go beyond the channel for some time, but return within it in most cases.
Price channels allow traders to trade along the trade and find moments when a correction can occur. This will help you prepare for opening trades along the trend if you use swing strategies in your trading sessions.
As you can see, you can use this tool to outline support and resistance levels as well. After drawing an equidistant channel and pinpointing the support level, you can adjust the upper band to identify the resistance level.
Fibonacci Retracement
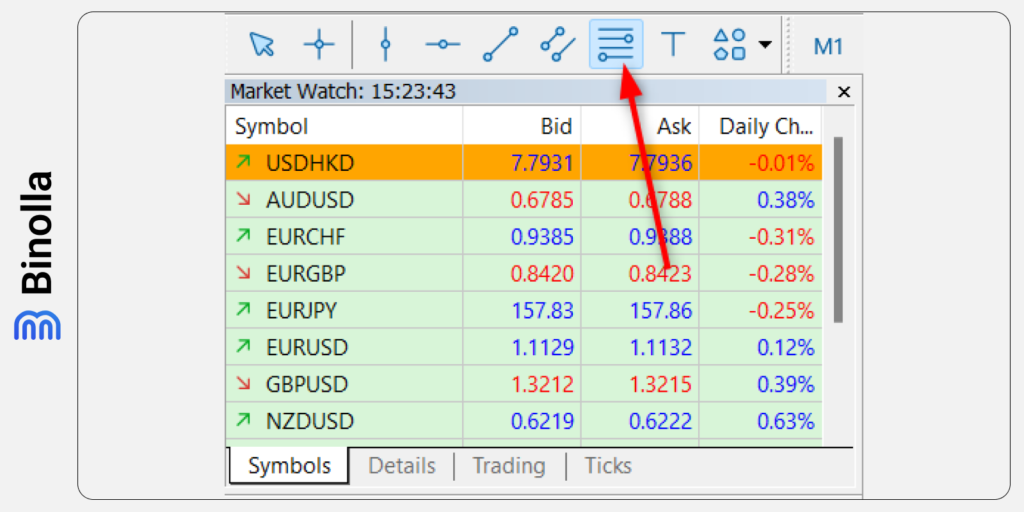
To add the Fibonacci retracement tool to your chart, you need to click on the icon in the tool menu above Market Watch. Once you do it, you need to find the lowest point and drag it to the highest point for uptrends and from the highest point to the lowest point for downtrends.
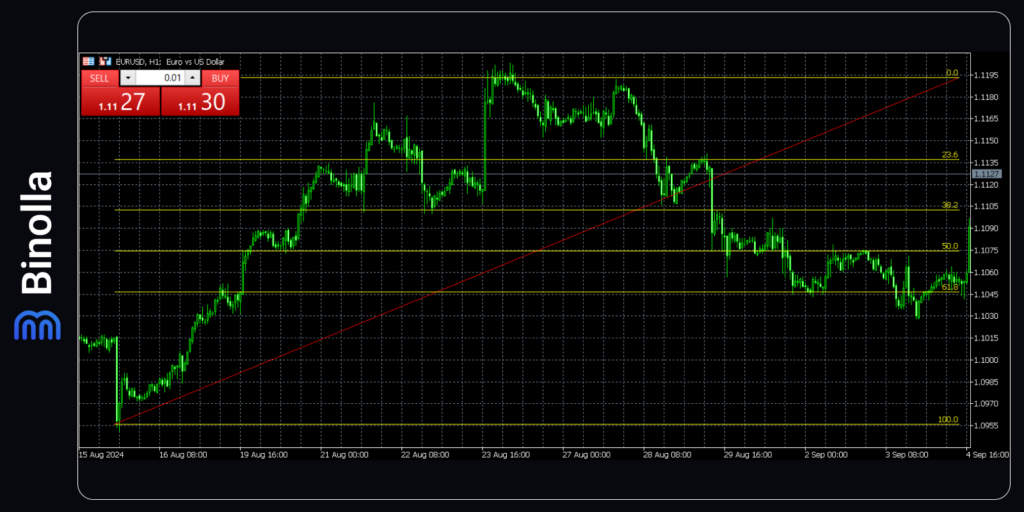
An example of a Fibonacci retracement can be found above. The idea of using it is to be able to find corrections when the main trend movement stops. For instance, in the example above, you can see that Fibonacci retracement was drawn for the uptrend and then all corrections rebound from Fibonacci levels when the price goes down.
Text Tool
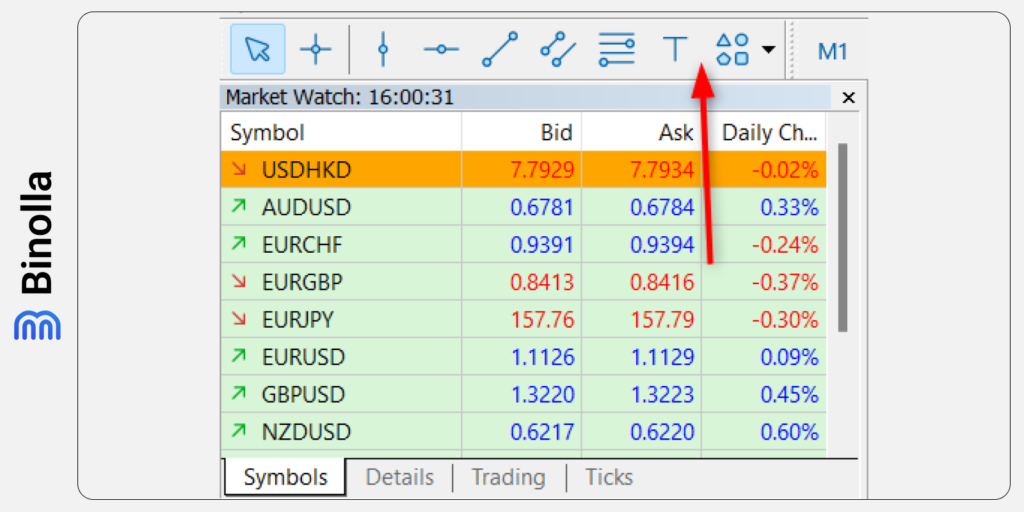
Apart from drawing tools, traders can add text to the chart. To do that, you need to click on the T icon. This feature is useful for adding various commentaries to the chart so that you can review your trades later. For instance, you can type the reasons for opening a trade in a particular situation. Something like “I’ve bought there as there was a reversal price action signal at the support line”.
Adding text commentaries to the chart may also be useful for those providing trading signals to others. You can chart your chart with comments and the followers will see the ins and outs of your trading method.
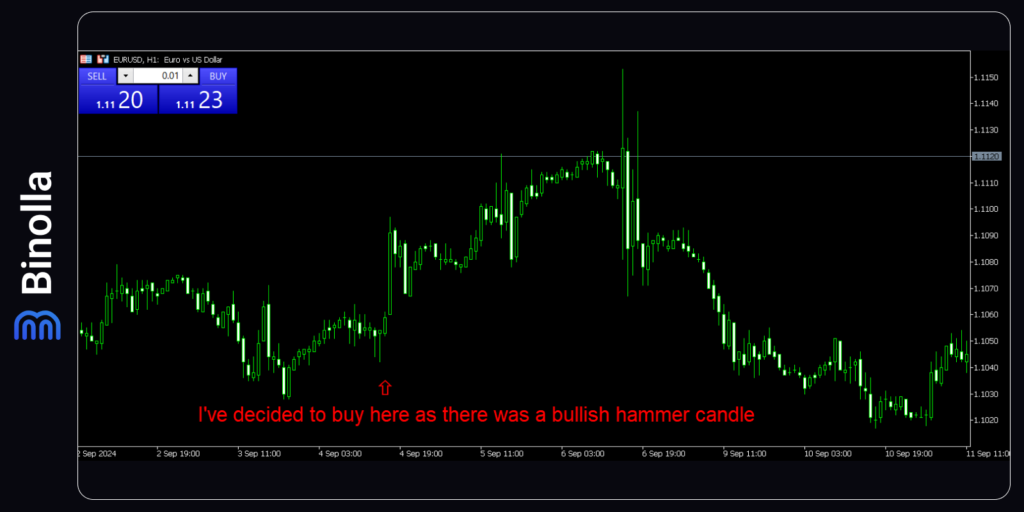
We have added some text to the chart. You can also adjust it on your own. In particular, you can change the color and the size. To remove the text or the icon, simply double-click on them and press Delete.
Shapes
Another option that you can use is shapes that allow you to make notes on the chart by using arrows and even price marks.
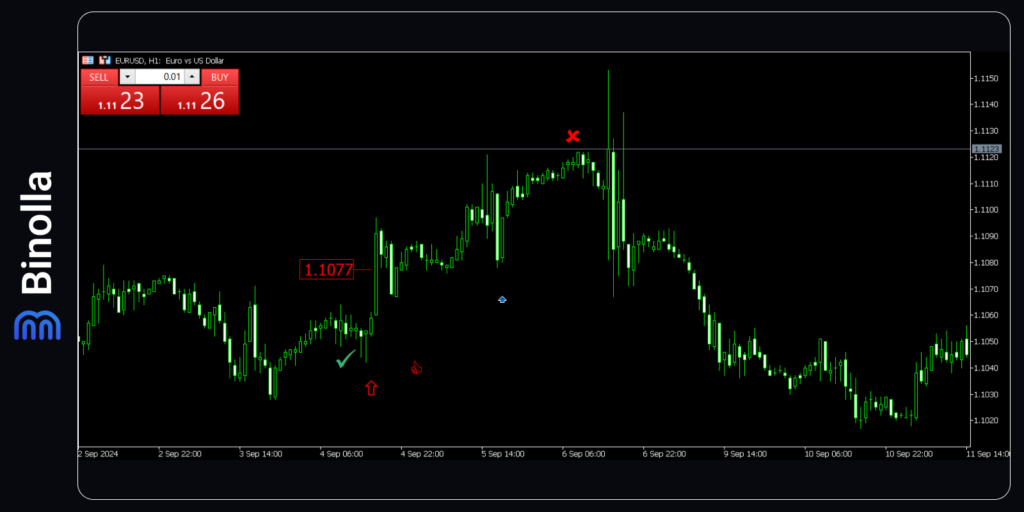
As you can see, using shapes can also be useful. You can mark points where you have bought or sold the asset, as well as where the stop-loss was triggered or where you have left the market on your own. Also, you can make price marks to see the exact level at a particular moment. This can be useful if you make a review of your trades on your own or you provide signals and want others to see your strategy.
FAQ

Can I Use Drawing Tools to Analyze Markets?
Yes, you can. Drawing tools are designed to conduct graphic analysis. You can use them to predict price fluctuations based on the current situation on charts.
What is an Equidistant Channel Tool on the MetaTrader 5 Platform?
This tool allows you to canalize the price and find the moments when it can reverse to improve your trading results and make informative decisions.
Can I Set Up Drawing Tools on the MT5 Platform?
Yes, you can. By right-clicking on a particular line, you can have access to the setup menu to adjust it.
What is the Best Drawing Tool on the MT5 Platform?
Every drawing tool that you can find on the MetaTrader 5 platform can be useful in a particular situation. When choosing one, you should clearly understand its purpose and how will you integrate it into your strategy.


