Heikin Ashi: How to Use This Type of Chart

There are several types of charts that traders can use to follow the price as well as to analyze markets. While Japanese candlesticks are of enormous popularity, the Heikin Ashi chart is also worth your attention. By reading this article, you will find out more about this type of chart as well as how to apply it and even discover some interesting trading tactics. Use Heikin Ashi charts when trading on the Binolla platform.
Contents
- 1 What is Heikin Ashi?
- 2 How to Use Heikin Ashi
- 3 Heikin Ashi Main Trading Patterns
- 4 Start using heikin ashi on the Binolla platform
- 5 The difference in Interpretation of Classic Japanese Candlestick and Heikin Ashi
- 6 Heikin Ashi Pros and Cons
- 7 Some Useful Tips for Using Heikin Ashi Charts
- 8 Conclusion
- 9 FAQ
What is Heikin Ashi?
Heikin Ashi is a Japanese word that means “average bar.” This type of chart is based on classic Japanese candlesticks and even looks like the latter with one key twist. Heikin Ashi averages all price movements to show market trends and reversals in a more clear and comprehensive way.
Heikin Ashi is a universal tool that can be applied to all existing financial instruments and assets. Moreover, it is suitable for scalpers, short-, mid-, and even long-term position traders. By using this chart, you will be able to identify market trends and even find entry points.
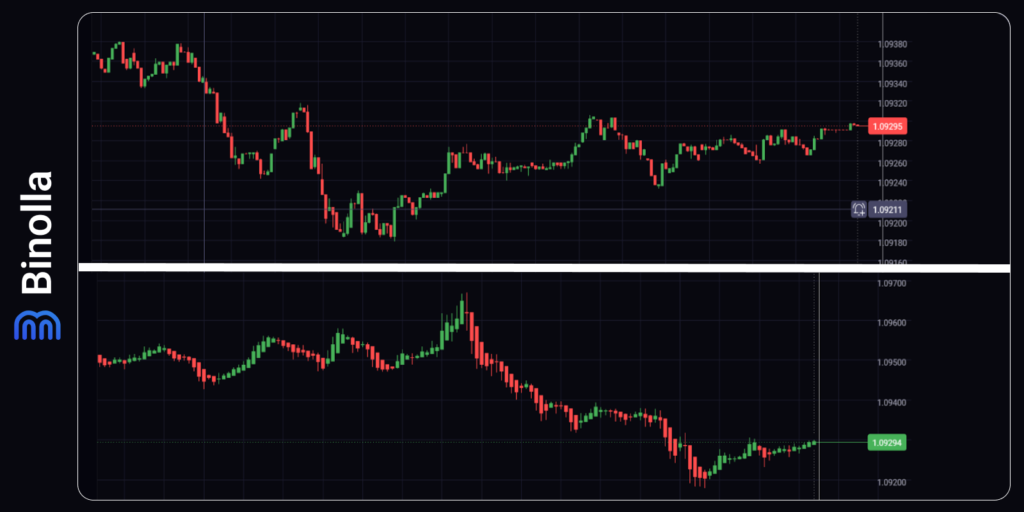
The example above shows both Japanese candlestick and Heikin Ashi charts for the same time interval. As you can see, they look completely different. This is due to the fact that both are based on different formulas. While Japanese candlestick is a pure open, close, high, and low price, Heikin Ashi is a more complex solution.
Formula Behind Heikin Ashi
Before going any further, we are going to provide you with information about how each Heikin Ashi (HA) candlestick is calculated. It has four different formulas:
- HA close. It is calculated as the average of the current high, low, open, and close of the price for a particular period: HA=(H+L+O+C)/4;
- HA open. To calculate the open price of a Heikin Ashi candlestick, you should use the average of the prior HA candle open, and close: (Prior HA Open + Prior HA Close)/2;
- HA high. The calculations are based on the highest price of the three price levels – the high price of the current interval, HA open, and HA close;
- HA Low. To calculate this parameter, you need to take the lowest price of the three levels – current low, HA open, and HA close.
How to Use Heikin Ashi
Heikin Ashi is not only a chart but also a kind of indicator. It allows you to watch the current trend as well as to see weaknesses and join the next trend after the reversal.
As was already mentioned, Heikin Ashi’s price varies from that of Japanese candlesticks. The latter represents high, low, and open a close for a particular period, while HA is calculated differently reflecting the HA close price.
Heikin Ashi is normally used by traders to smooth price data. However, this is not the only way to receive information from this type of chart. Traders can also see trading patterns (even though they are not as numerous as when they deal with Japanese candlesticks), define trends, and find reversals. However, what you see in the HA chart is not the current asset price, which may make it complex, especially for beginners using this indicator.
Therefore, even professional traders use both HA and Japanese candlesticks. While the latter allows them to stay connected to the real-world price, Heikin Ashi can be used to define trends, understand their strength, and find trading signal confluences.
Heikin Ashi Main Trading Patterns
We have already mentioned that HA is normally used to define trends or find reversal signals. Therefore, there are three main types of patterns that you can find in this chart.
Trend Continuation
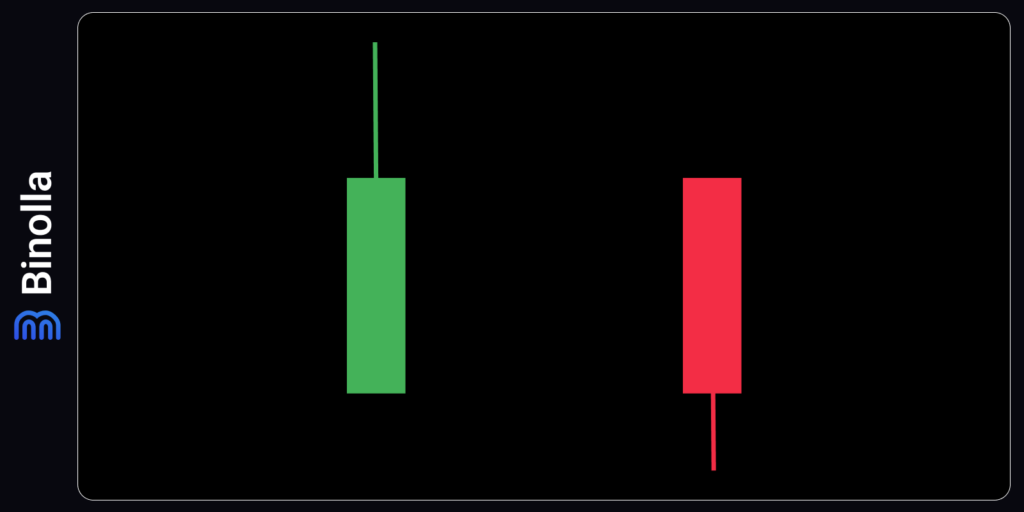
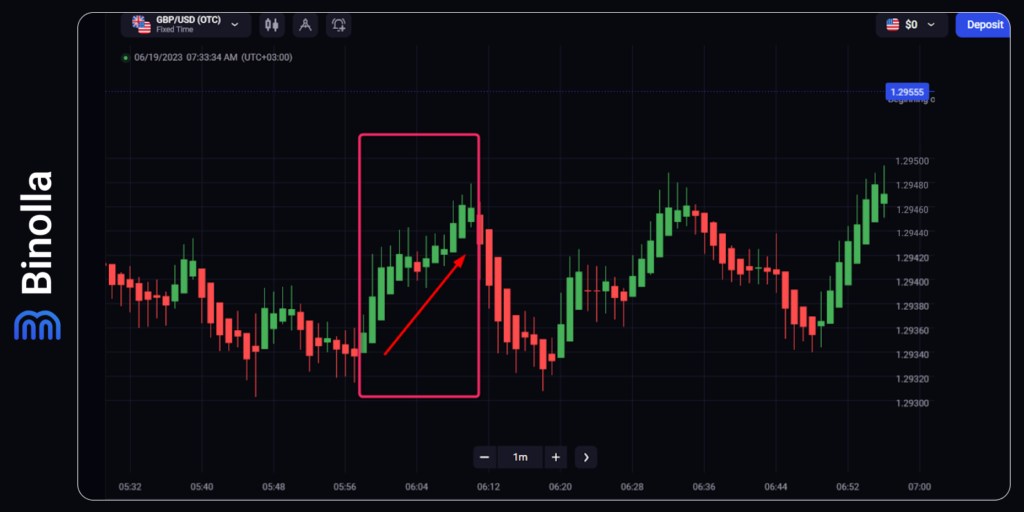
This is one of the easiest ways to understand whether the current market trend is going to develop. The trend continuation pattern has a long body and only one wick. For a bullish candlestick, the wick is above the body, while for a bearish one, the wick is below the body.
What does it mean? If you look at the bullish candlestick, the lack of a lower wick means that bulls have total control of the market and they do not leave any chances for bears to break below HA open.
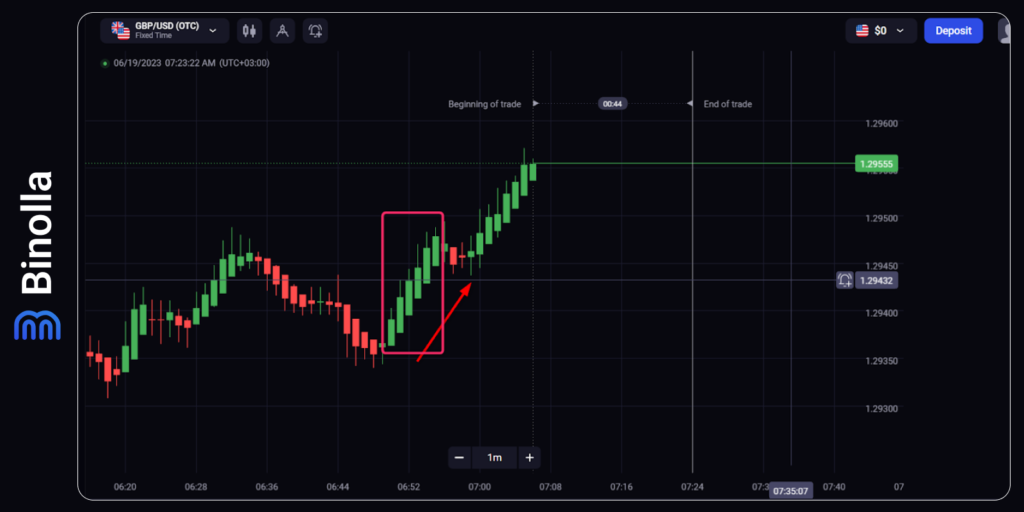
The example above shows how it works. We have several bullish green candlesticks without lower shadows. They indicate a strong uptrend. This pattern is useful for Forex traders as they can buy a currency pair at some point and hold it until the first candlestick with a lower wick. When it comes to digital options, traders can try to buy a Higher contract once the previous candlestick is closed.
Weakness patterns
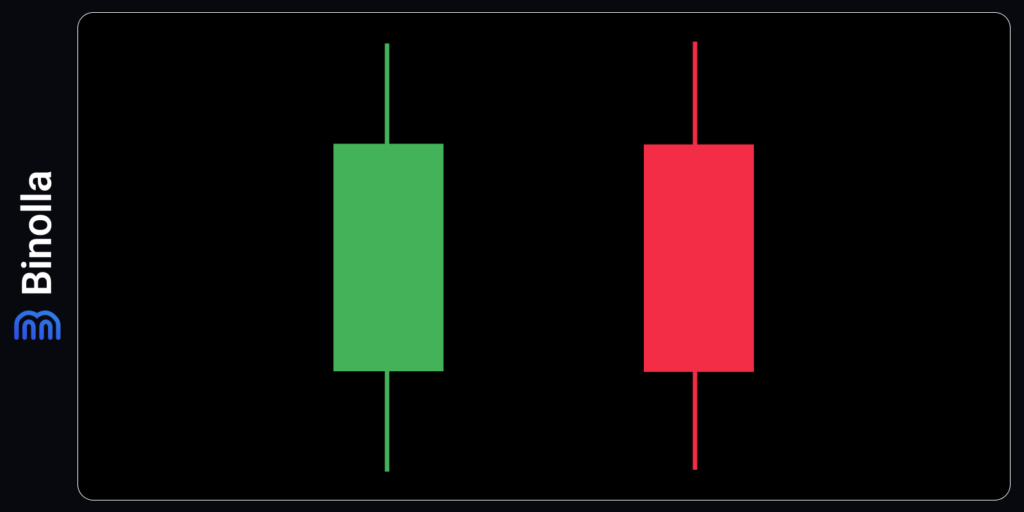
Candlesticks with wicks on both sides reveal the weakness of the trend. While the reversal is still on the way, using weakness patterns may be very useful.
As you can see, even when there is a weakness pattern, there is no guarantee that there will be a trend reversal. In the example below, after the weakness pattern appears, the price continues to grow and makes some higher highs later.
Weakness patterns are not great for trading. While they may indicate that bulls or bears lose their domination, there is still no guarantee that the price is going to change its direction. Therefore, weak candlesticks can be used by Forex traders as an early signal to exit the market. For digital options traders, those patterns are almost useless.
Reversals
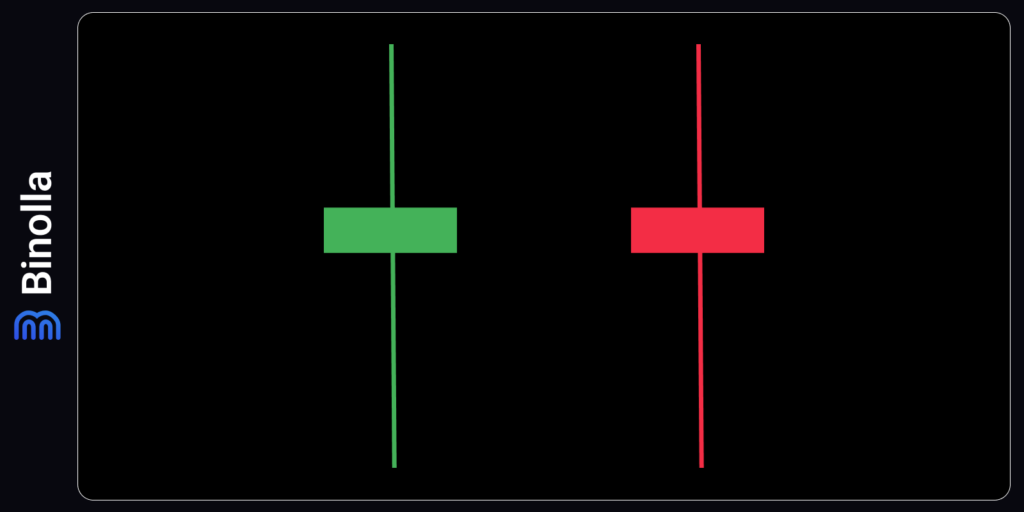
Another type of candlestick that you can find on Heikin Ashi charts is the reversal pattern. It is characterized by a small body and long wicks on both sides. Reversal patterns in HA are similar to Spinning Tops or even Dojis in the classic Japanese candlestick system.
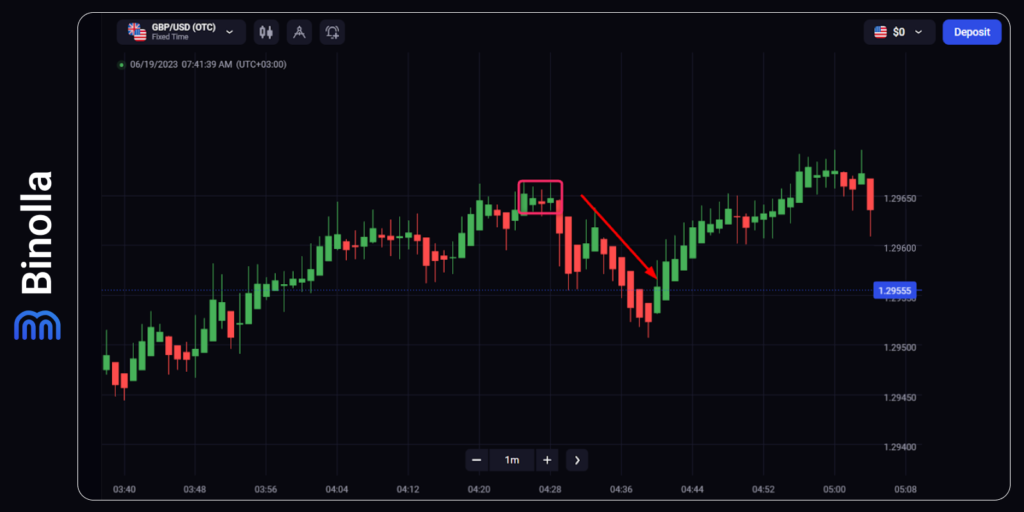
Here is an example of how this pattern works. You can use it to buy a Lower contract, as shown in the picture. Moreover, this signal can also be used by Forex traders to sell the currency pair.
The difference in Interpretation of Classic Japanese Candlestick and Heikin Ashi
While both types of charts may seem similar and HA is a twist of the classic Japanese candlestick system, they have significant differences in interpretation. Apart from the most evident twist in how they form, there are several other moments that you should take into consideration:
- Candle color. While classic Japanese candlestick receive their color depending on whether a particular candlestick closed above or below the open level, in HA, the color depends on the difference between the average price of the current and previous candlesticks;
- Price movements demonstration. Classic Japanese candlesticks may offer a lot of noise, especially on smaller timeframes. Heikin Ashi charts offer smoothed price movements as they use a specially modified formula. With this approach, it is easier for traders to define market trends and find key levels;
- Price gaps. While gaps may occur in classic Japanese candlestick charts, they are almost impossible in HA as they smooth gaps as they use average prices;
- Volatility. With HA charts, traders can get a better picture of market volatility as they average price movements instead of demonstrating actual prices.
All-in-all, HA charts can be useful for traders who prefer smoother price representation and want to reveal market trends in a simpler manner.
When it comes to classic Japanese candlestick charts, they are helpful for traders who want to have a more detailed perspective of price movements and identify price patterns in an easier way. Therefore, the choice between these two types of charts depends on the strategies that you are going to use.
Heikin Ashi Pros and Cons
Traders who use HA can rely on the following benefits:
- High readability. Traders can easily interpret separate candlesticks and patterns. They allow traders to find market trends;
- Reliability. Similar to Japanese candlesticks, HA provides traders with accurate results;
- Market noise mitigation. HA charts allow you to smooth market noise and have a better view of the current market trend;
- Better interoperability with other technical indicators. While HA can be considered as an independent chart and indicator, sometimes you can add some other technical analysis tools to augment Heikin Ashi and create some interesting strategies;
- Tolerant to any timeframe and asset. The chart can be applied to any timeframe and asset, including currencies, stocks, indices, commodities, and even cryptocurrencies.
While Heikin Ashi seems like an ideal charting system, it still has its drawbacks, which are listed below:
- Lack of price gaps. One of the strongest signals is a price gap when the open price of the next bullish candlestick is above the close price of the previous bullish candlestick, for instance. When it comes to HA charts, there are no price gaps at all. Therefore, by using this type of chart, you can miss some rare trading opportunities;
- No full-price information. With its formula, the HA chart shows averaged prices instead of demonstrating current open and close prices. Heikin Ashi may not be useful for scalpers and day traders.
Some Useful Tips for Using Heikin Ashi Charts
Before putting the final stop in this article, we would like to share some useful ideas with you:
- Heikin Ashi charts can affect risk management. The HA chart reduces the level of market noise on charts, which means that you will see fewer false signals. However, on the other hand, there is a lag behind the price action, which will impact your stop loss tactics. Heikin Ashi does not demonstrate current highs and lows, which results in inaccurate risk/reward ratios. Moreover, you may have difficulties placing accurate stop loss orders when trading Forex CFDs. In addition, you may have trouble defining exact entry points as well as finding points to close your trades;
- Adjusting stop losses with Heikin Ashi. While there can be a lag behind the price action that we have already mentioned in the previous paragraph, you can use classic Japanese candlesticks and combine them with HA to confirm entry and exit points. If you don’t want to use classic Japanese candlesticks to avoid confusion or to make your strategy even more complex, you can use the percentage approach, placing a stop loss in a distance that you think is appropriate for you. In this case, you can also use the same percentage approach to set your profit targets.
Conclusion
Heikin Ashi is a type of price chart that uses a special averaging formula in its calculations. Unlike Japanese candlesticks, Heikin Ashi does not reveal current open and close prices. It is based on average price calculations instead.
Heikin Ashi may seem similar to Japanese candlesticks, but it has a totally different approach. It reduces the noise and helps traders follow trends. On the other hand, HA charts are not accurate in demonstrating the current price, which makes them almost useless when it comes to placing stop losses or defining trading goals for a particular trade.
In general, Heikin Ashi can be applied solely on charts or as a part of a trading system, which may include classic Japanese candlesticks, some technical indicators, or other tools.
FAQ

Is Heikin Ashi Reliable?
Like any other type of chart, Heikin Ashi can be used for some purposes. For instance, you can apply it to reveal current market trends. Taking into consideration its formula, Heikin Ashi is a great tool to define price movement directions. However, when it comes to other purposes, it is better to use traditional Japanese candlesticks.
How Accurate the Heikin Ashi Chart is?
Unlike Japanese Candlesticks, HA charts do not show the current market price. Therefore, it is impossible to discuss their accuracy. They are used for other goals such as indicating the current market trend and smoothing price fluctuations.
Is Heikin Ashi Good for Day Trading?
Like any other chart, Heikin Ashi can be used for intraday trading. However, taking into consideration its nature, it is better to use this type of chart for mid- and long-term strategies.
Is Heikin Ashi Good for Analysis?
Yes, it is. This type of candlestick chart can be used to read the charts, smooth and reduce noize, as well as to make price movement forecasts. This type of chart has three main types of signals that allow you to predict the continuation of the trend, its weakness, or even reversals.


