EUR Gains Power as USD Steps Back Ahead of the US Data

On Tuesday, EUR/USD is showing signs of consolidation, hovering just below the 1.0900 mark during the European trading session. The pair’s recovery is being constrained by a combination of widespread weakness in the US Dollar, tempered inflation expectations in the Eurozone, and a generally cautious market sentiment. Traders are now turning their attention to upcoming US sentiment data and further comments from Federal Reserve officials.
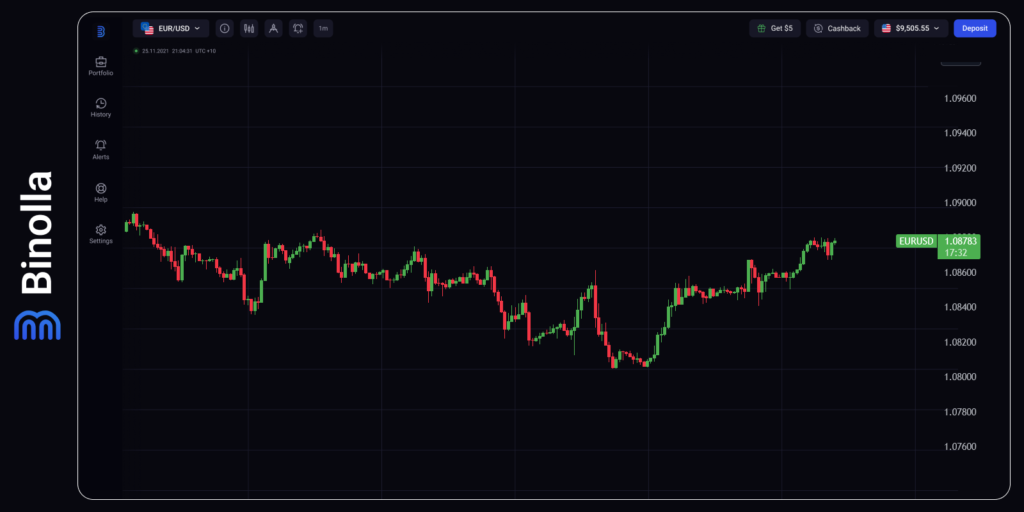
The EUR/USD pair is encountering significant resistance in the 1.0890-1.0900 zone. This area is critical as it aligns with the 78.6% Fibonacci retracement level of the recent downtrend and the mid-point of the current ascending regression channel.
Should the pair manage to break above this resistance and establish it as a new support, the next targets could be 1.0940, which is the upper boundary of the ascending channel, and 1.0970, marking the starting point of the previous downtrend and a static resistance level.
Conversely, on the downside, the pair could find support at several key levels. The first support is at 1.0830, the lower boundary of the ascending channel. This is followed by 1.0810, where the 100-day Simple Moving Average is situated, and further down at 1.0750, which corresponds to the 200-period Simple Moving Average on the 4-hour chart. These levels are crucial for maintaining the current upward momentum and preventing a deeper pullback.
Contents
- 1 GBP/USD Edges Lower Toward 1.2750 Amid Market Caution
- 2 Market Volatility? Profit from It!
- 3 Australian Dollar Gains as US Dollar Softens Ahead of Upcoming US PCE Data
- 4 USD/CAD Extends Decline to 1.3600 Amid Weakening US Dollar
- 5 Gold Prices Dip Amid China Demand Concerns and Modest USD Rebound
- 6 Bitcoin faces downward pressure but surpasses expectations
GBP/USD Edges Lower Toward 1.2750 Amid Market Caution
The GBP/USD pair is easing back towards the 1.2750 level during Tuesday’s European session, pulling back from its recent two-month highs. This reversal is occurring as the US Dollar halts its decline, with market participants growing cautious ahead of the release of US Consumer Confidence data and upcoming statements from Federal Reserve officials.
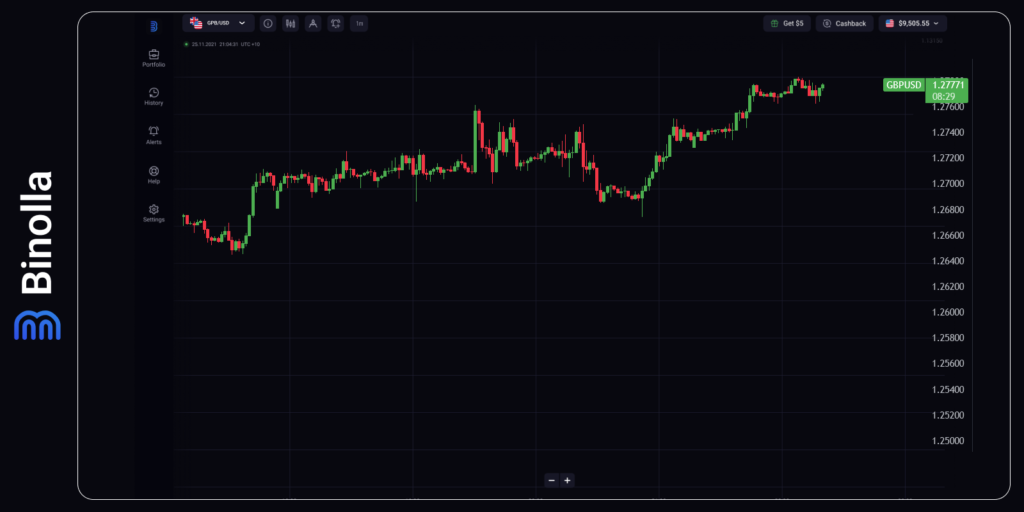
Currently, GBP/USD remains within the upper half of the ascending regression channel that has been in place since late April. The Relative Strength Index (RSI) on the 4-hour chart holds close to 60, indicating a continuing bullish bias.
On the upside, the pair faces key resistance at 1.2760, aligned with the 78.6% Fibonacci retracement of the latest downtrend. Should this level be breached, further resistance is anticipated around the 1.2800-1.2810 range, which corresponds to a static level and the upper boundary of the ascending channel. The next significant resistance lies at 1.2850, another static level.
Conversely, support levels for GBP/USD can be identified at 1.2730, which is the midpoint of the ascending channel and the 20-period Simple Moving Average. Further down, support is seen at 1.2670, the 61.8% Fibonacci retracement, and at 1.2640, marking the lower boundary of the ascending channel. These levels are crucial for maintaining the pair’s upward momentum and preventing a deeper correction.
Australian Dollar Gains as US Dollar Softens Ahead of Upcoming US PCE Data
The Australian Dollar continues its upward trajectory, bolstered by improved risk appetite in the markets. Despite Australia’s Retail Sales growth of 0.1% in April falling short of the expected 0.2%, it marked a recovery from the previous month’s decline of 0.4%. Concurrently, the US Dollar is depreciating due to falling US Treasury yields.
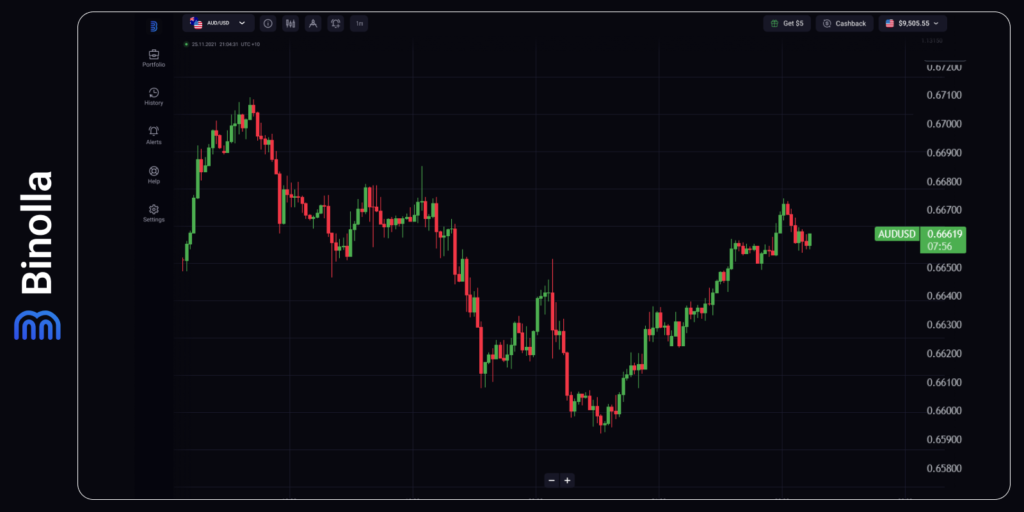
On Tuesday, the Australian Dollar is trading around 0.6660. An analysis of the daily chart reveals a bullish bias for the AUD/USD pair, which is currently situated within a rising wedge pattern. The 14-day Relative Strength Index (RSI) stands just above the 50 level, reinforcing this positive outlook.
Looking ahead, the AUD/USD pair has the potential to climb to a four-month high of 0.6714. Beyond this, the next target is the upper boundary of the ascending triangle, around 0.6730.
On the downside, key support is found at the 21-day Exponential Moving Average (EMA) at 0.6618, followed by the crucial psychological level of 0.6600. If the pair declines further, it may face additional pressure, potentially driving it toward the throwback support zone at 0.6470.
USD/CAD Extends Decline to 1.3600 Amid Weakening US Dollar
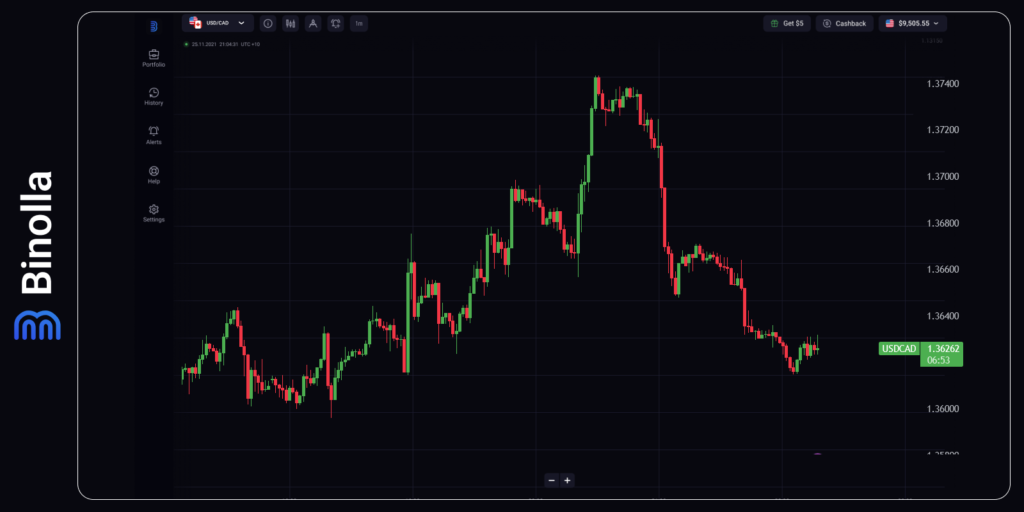
The USD/CAD pair has fallen further, approaching the key support level of 1.3600 during Tuesday’s Asian session. The Canadian Dollar is gaining strength against a weakening US Dollar, despite market expectations that the Federal Reserve will maintain interest rates at their current levels in the upcoming September meeting.
Gold Prices Dip Amid China Demand Concerns and Modest USD Rebound
Gold prices faced rejection near the $2,360 mark on Tuesday, signaling a reversal in trend. The precious metal is now back in negative territory, driven by concerns over declining imports of gold into China and a slight rebound in the US Dollar. Traders are closely monitoring US economic data releases and statements from Federal Reserve officials for potential market-moving catalysts.
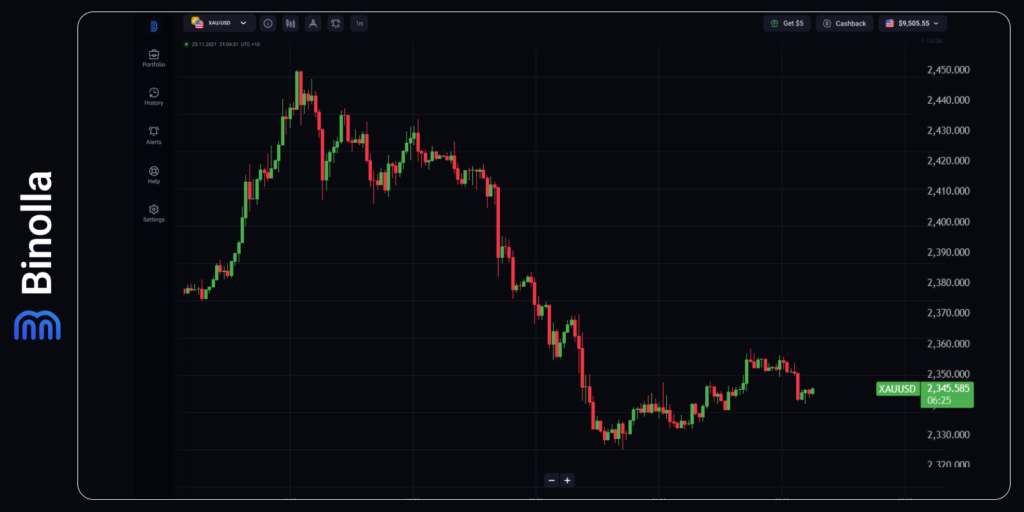
In recent news, gold has declined following reports of reduced imports to China, indicating weakened demand in one of the world’s largest gold markets. Meanwhile, a report highlights a decrease in silver prices, adding to the downward pressure on precious metals. However, in India, gold prices have edged higher according to data from MCX, suggesting varying trends in different regions.
From a technical perspective, gold experienced a rising wedge breakdown on Monday but found support from a positive shift in the 14-day Relative Strength Index (RSI), which remains above the 50 level. The path for further upside movement depends on the metal’s ability to surpass the wedge support-turned-resistance at $2,365 on a daily closing basis.
Currently, gold is testing the 21-day Simple Moving Average (SMA) at $2,349, with potential for a move towards the May 24 high of $2,384 if buyers regain control above $2,365. On the downside, a breach of the 50-day SMA support at $2,317 could signal a resumption of the downtrend, with key support levels at $2,300 and $2,277.
As market dynamics evolve, traders will continue to monitor these technical levels and external factors to gauge the direction of gold prices in the near term.
Bitcoin faces downward pressure but surpasses expectations
Cryptocurrency market capitalization experiences a slight dip of 0.8% over the past 24 hours, resting at $2.55 trillion. Bitcoin and Ethereum witness marginal declines of 0.7% and 1.1% respectively, while other leading altcoins display mixed performances, ranging from a 0.9% decrease in Toncoin to a 1.1% increase in Solana.
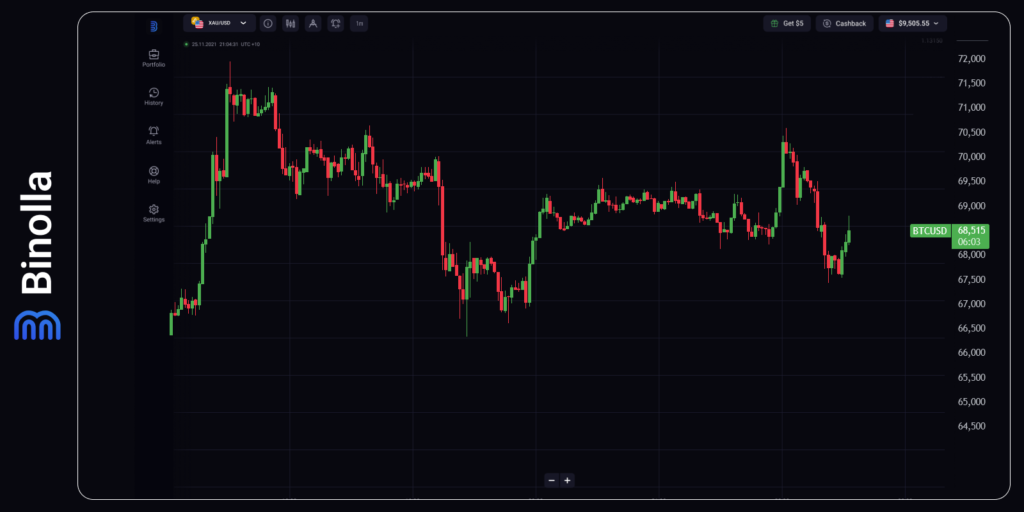
Bitcoin’s hashrate achieves a record high following the fourth halving, reaching 676 Eh/s. The 7-day moving average of BTC hashrate surpasses 650 Eh/s, peaking at 659 Eh/s at the week’s onset. Contrary to expectations, Bitcoin miner capacity escalates post-halving.
Despite initial gains on Monday, Bitcoin retraces on Tuesday, retreating from the upper boundary of its trading range to $68K. The lower limit of the range, potentially attracting bearish interest, lies below $60K. However, consolidating above $70K could disrupt this bearish pattern.
In other news, MtGox initiates active fund distribution, intending to disburse 142,000 BTC ($9.7 billion), 143,000 BCH ($69.6 million), and 69 billion yen ($439 million). While this event initially pressures markets due to potential immediate asset liquidation, it promises to resolve longstanding uncertainties.
Additionally, Ethereum developers unveil plans for the Pectra update, slated for release by the first quarter of 2025. This significant upgrade, succeeding Dencun, aims to enhance the Ethereum Virtual Machine object format and deploy EIP-7251 proposals.
Furthermore, Bloomberg reports a notable surge in crypto funds, with 25 cryptocurrency-focused venture capital and hedge funds entering the market between January and March, marking the highest influx since the second quarter of 2021.
Meanwhile, the total value of blockchain assets (TVL) within The Open Network (TON) surpasses $300 million, witnessing exponential growth since March. This surge in liquidity is attributed to Tonstakers’ liquidity-stacking program.


