Double Top and Double Bottom: Integrating These Reliable Patterns in Your Trading Strategies

Trading patterns like top and double bottom are very popular among professional traders as they allow market participants to catch bearish and bullish reversals even without adding technical indicators. They can be used by both digital options and forex traders, offering them a rather high level of reliability. By reading this article, you will grasp the basics of double top and bottom, as well as how to use these patterns in different market situations.
Looking for a reliable broker for trading digital options and CFDs? Join Binolla now and enjoy trading across a broad range of assets.
Contents
- 1 Key Takeaways
- 2 Double Top Pattern Explained
- 3 Double Bottom Pattern Explained
- 4 How to Trade the Double Top Pattern
- 5 The Double Top Strategy – How to Confirm the Second Peak
- 6 Give this pattern a try!
- 7 Double Bottom – a Strategy to Buy an Asset or Buy a Higher Contract
- 8 Trading Double Top and Double Bottom Using the Line Chart
- 9 Triple Top and Triple Bottom Patterns
- 10 Trading with Double Top and Double Bottom: Recommendations
- 11 Conclusion
- 12 FAQ
Key Takeaways
- Double top and double bottom patterns appear quite often on charts;
- Such patterns demonstrate the shift in market sentiment after key support and resistance levels are tested twice and then the price moves in the opposite direction;
- Both patterns can be applied to digital options, Forex, stocks, and cryptocurrencies;
- When trading with double top and double bottom, you don’t need any technical indicator to use the pattern;
- The neckline in both patterns is a signal line that allows you to confirm the pattern;
- Traders often use Japanese candlestick analysis to be more sure about the pattern;
- Both patterns can be traded with line charts.
Double Top Pattern Explained
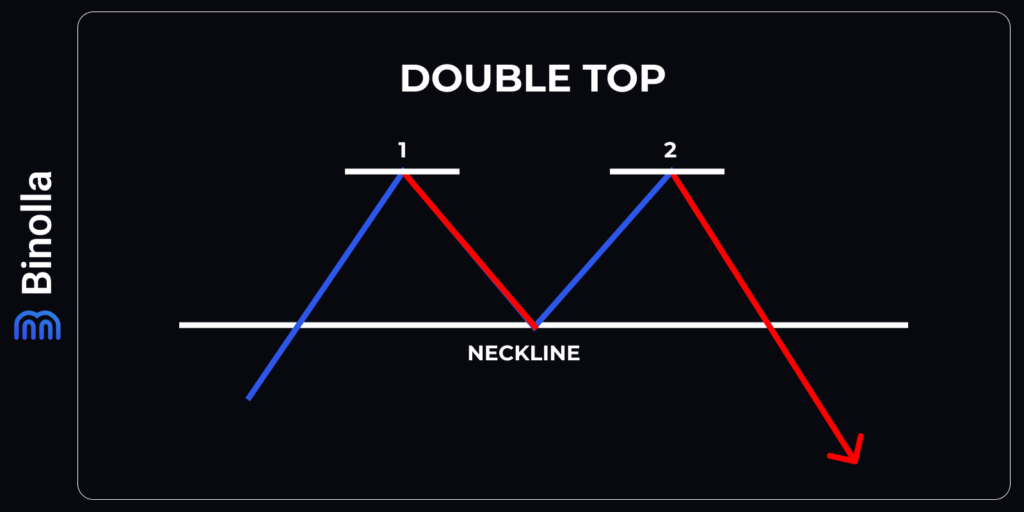
The idea behind the pattern is that there is uncertainty in the market after an uptrend. The price tests the resistance level a couple of times before a reversal occurs.
A double top consists of two peaks and a neckline, which is a support level that prevents the price from moving lower for a while. The first peak forms when buyers can’t push the price higher through a specific level. The second peak is at the same level, which makes it even stronger as buyers are unable to push the price higher again.
What happens next is the change in the market sentiment. After two attempts of breaking higher, the price reverses. The neckline is the local support level, which the price tests in between testing the peaks. After the quotes leave the second peak, they move to the neckline again. If the price breaks the neckline at this particular moment, the double top pattern starts working.
What is important to learn here is that after the price breaks the neckline, momentum often comes. However, in some situations, the price may return to the neckline from below to retest it as a resistance level.
Double Bottom Pattern Explained
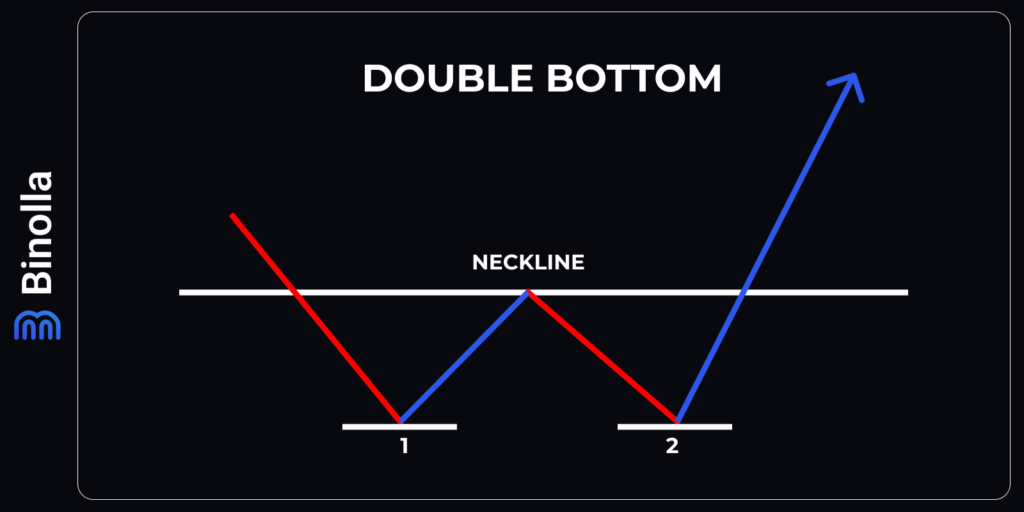
The double bottom pattern includes two dips and a neckline, which is a local resistance level. Both dips should be at the same level. The idea behind this pattern is that sellers were trying to push the price lower but failed. After the first dip, buyers attempt to reverse the market, but sellers still push the quotes lower to form another dip. Finally, when sellers fail to push the price lower again, buyers regain control.
Similar to the double top pattern, this one demonstrates a change in market sentiment. The first dip outlines the support level, which is confirmed by the second dip. As you may know already, the more the price fails to go through a particular level, the stronger the level becomes. In this case, after two failed attempts, the price reverses.
Both double top and double bottom patterns may appear when significant market data is released. For instance, this may be the monetary policy announcement, inflation or labor market data, and others.
How to Trade the Double Top Pattern
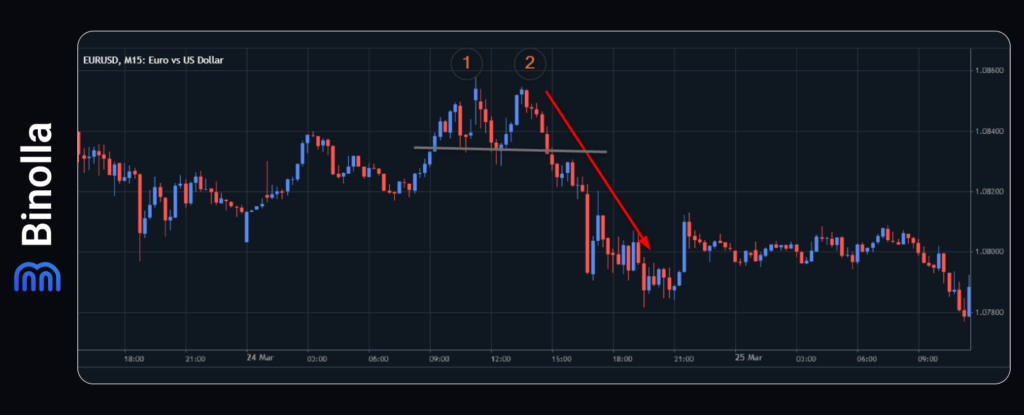
Double top is a rather simple strategy that allows you to sell or buy a Lower contract without applying any technical indicator. It is important to mention that you can see the pattern in advance after the second peak is formed and the price moves to the neckline again. This is the right moment to prepare for trading.
To sell or to buy a Lower contract, a trader should wait for the price to break the support level. At this moment, you can place a trade. However, there is also a conservative strategy that requires you to wait for the candlestick to close before placing a trade.
Finally, another strategy requires waiting for the price to move toward the neckline from below and opening a position when the retest fails. This is a very conservative strategy, but it is considered one of the most reliable ones as the resistance level is confirmed by the rejection.
To protect your trade from excessive risks, you can set stop losses. To do that, you can simply watch the neckline and place stop losses somewhere above it. Also, some traders calculate the distance between the price and the stop loss. You can use such calculations to place such protective orders with higher precision. Keep in mind that when trading digital options, you don’t need to set stop losses due to the nature of such contracts.
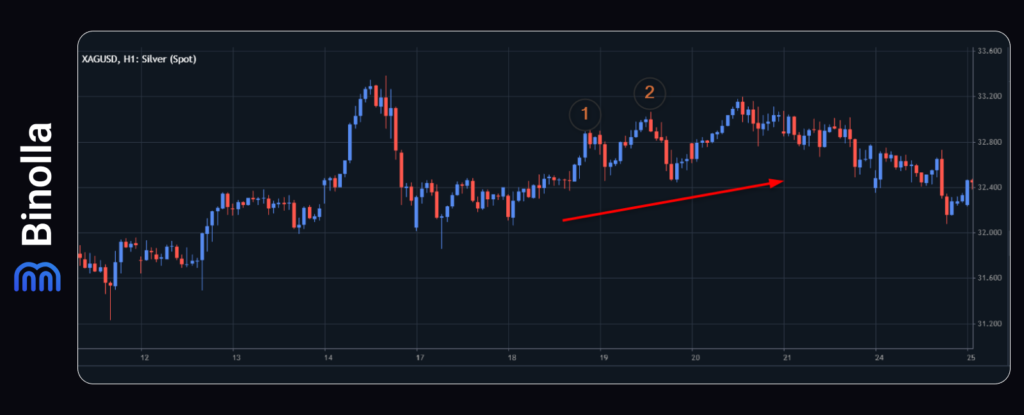
Not all patterns that may seem like double tops are reliable. In the example above, you can see a formation that may look alike, but there are two things that you can notice there that make it a bad pattern. First, there is no uptrend before the double top pattern. Second, the peak number two is above the first peak, which means that bulls managed to push the price a bit higher. As you can see, the price continues to move higher after testing the neckline for the second time.
Manuel Alves – Top Binolla Trader
I personally use the most aggressive strategy and sell when the price breaks below the neckline, even without waiting for it to close. However, what I suggest to traders is the middle variant to sell or buy Lower options when the candlestick is closed. In this case, you can be sure that the breakout took place. The third version of the strategy is also good, but the price may not return to the neckline, which means that you may lose a trading opportunity. Therefore, if you want to have better guarantees, then you can use the second variation.
The Double Top Strategy – How to Confirm the Second Peak
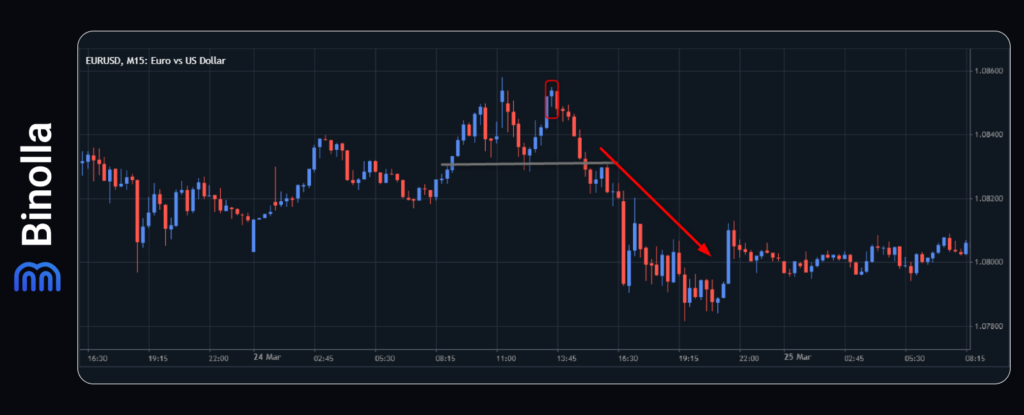
To be more sure about the pattern in advance, you can pay attention to the second peak. It is advisable to see whether there is any reversal pattern that will help you confirm local reversal and to be more sure that the price is likely to move towards the neckline.
Why is it important? The double top pattern is a rather complex formation, and the earlier you find it, the more time you will have to make a decision. Moreover, you will have more time to place limited orders in advance if you want to trade CFD and not waste time waiting for the pattern to form. In particular, you can place a Sell Stop order right below the neckline. If the formation appears and starts working, the price will break below the neckline where your Sell Stop order will be placed.
Double Bottom – a Strategy to Buy an Asset or Buy a Higher Contract
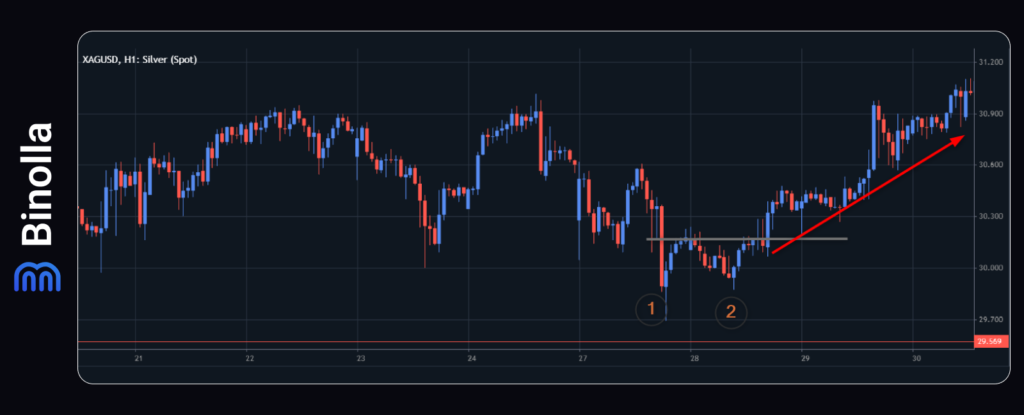
Before placing a trade, you need to identify the pattern first. You can do it when the second peak is formed and the price goes to the resistance level, which is the neckline in the formation. Once the price gets to the resistance level, you can prepare for the trade. The first type of strategy is to buy an asset or a Higher contract once the qiptes break above the resistance level.
Similar to the double top formation, this strategy is a bit risky as you don’t know whether the price has broken the resistance line or not. Therefore, some traders use another approach and wait for the candlestick to close before placing an order. This is a more conservative approach, as you may lose part of the movement, like in the example above, where we have quite a long blue candlestick. Finally, there is the most conservative strategy, which suggests that you should buy an asset or a Higher contract when the price retests the neckline.
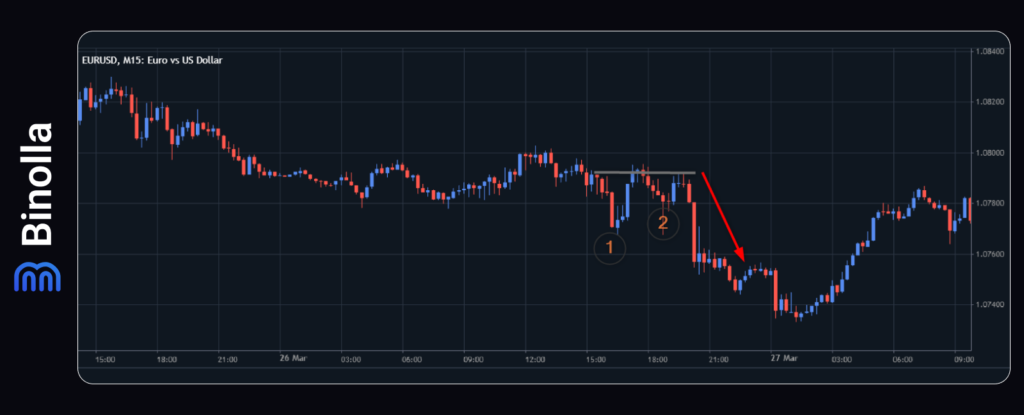
Similar to double top, there are plenty of fake double bottom patterns. As you can see, there are two reasons why considering this pattern will be a mistake. There was no downtrend before the formation, and the dips are not at the same level. Therefore, trading with this pattern would be a mistake.
Trading Double Top and Double Bottom Using the Line Chart
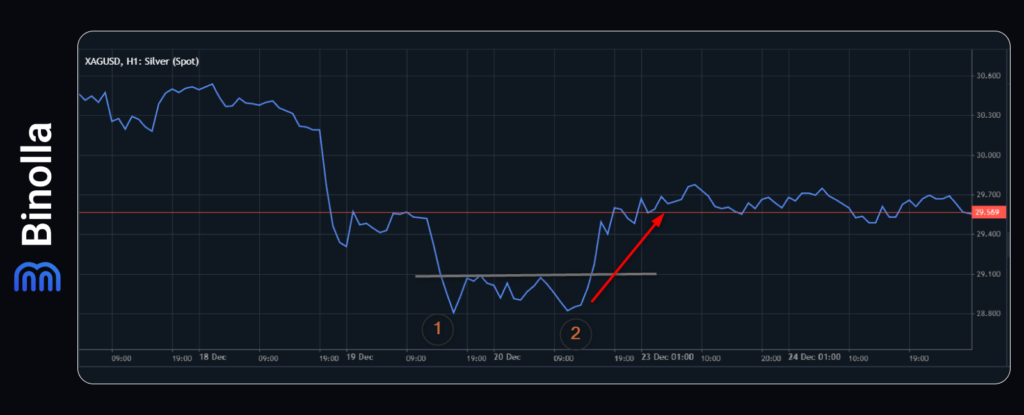
Sometimes professional traders use the line chart to trade patterns like this. The idea behind switching to this type of charting is simple. You will have a clearer picture of what is hapenning in the market without information that may be unnecessary to use when trading double tops or double bottoms.
The strategy works the same way. You need to wait for the second dip to form and then watch until the price breaks above the neckline. Unlike trading with candlesticks, you don’t need to wait for confirmation, and you can open the trade right away.
Peter Darkert – Binolla Trader
I prefer trading these formations with the line chart. This way, I receive pure information and am not distracted by candlestick open and close prices. Moreover, this option gives me the opportunity to enter without any confirmation, which sometimes makes it even more profitable. However, I admit that the method may be less effective as compared to one when Japanese candlesticks are used as when you have confirmation coming from the closed candle, you are more sure about the outcome.
Triple Top and Triple Bottom Patterns
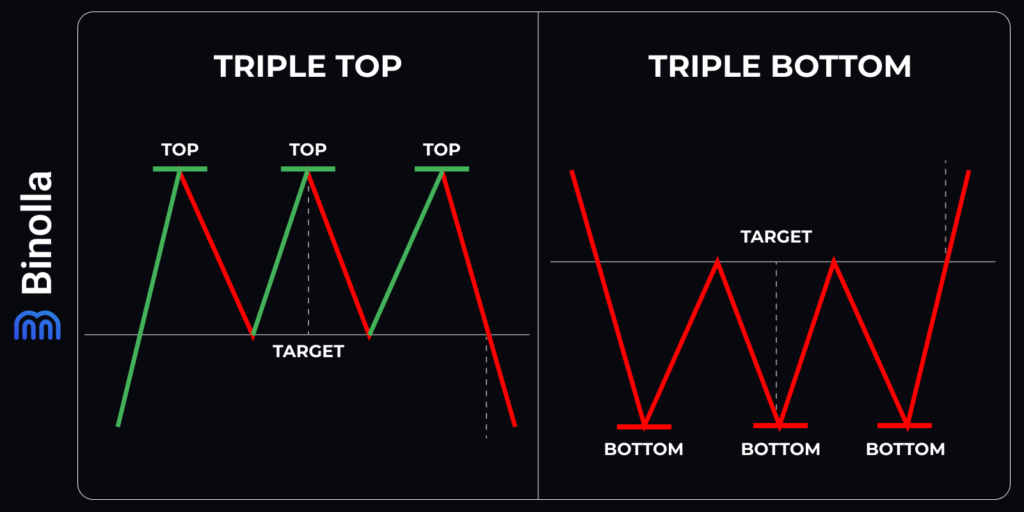
These are very rare patterns that occur sometimes when double top and bottom fail. The price makes another test of the resistance/support level before changing direction.
Trading the triple top pattern is almost similar to trading the double top formation. The only twist is that the price makes a third peak before it breaks below the neckline. To sell or buy a Lower contract, you simply need to wait for the candle to close below the support level. However, some more aggressive traders may open a trade when the breakout occurs.
When it comes to the triple bottom pattern, the idea is to buy or purchase a Higher contract after the price breaks above the neckline. Unlike the double top formation, the quotes make another dip before a reversal. When the candlestick closes above the neckline, you can open a trade. Similar to the previous case, if you decide to trade more aggressively, you can place an order right after the breakout.
Trading with Double Top and Double Bottom: Recommendations
Both patterns can be very reliable if they are used properly. Here are some recommendations that may help you improve your trading results:
- Wait for confirmation when the neckline is broken. Whether you are trading a double top or double bottom with Japanese candlesticks, it is better to wait until the candle closes before entering a trade. The aggressive approach may decrease the profitability of the strategy;
- Use higher timeframes to exclude market noise. When trading on lower timeframes, you will see a lot of noise. To avoid this, you should switch to higher timeframes. While the pattern works even on minute and 5-minute scales, the most reliable ones appear on charts starting from 1 hour;
- Use volumes to confirm the pattern. Every breakout is confirmed by rising volumes in trading. When using both patterns, you can add any of the volume indicators and see whether the volume rises or not;
- Add various indicators for confirmation. Traders may use indicators like MACD or RSI to confirm the breakout or the reversal signal when the price is rejected by the second peak/dip;
- Use Stop losses. To protect themselves from higher risks, traders should place stop losses. The best idea is to set them above the neckline for double top and below the neckline for double bottom formations. The distance should match your risk management rules;
- Calculate profits. The distance between the neckline and tops/bottoms can be used by traders to calculate profits. This distance is approximate, traders often use it as a minimum value. If you use the risk-reward approach in trading, then you should set your profit target according to this ratio;
- Avoid entering the market before the pattern starts working. Some traders with lower skills sometimes tend to enter the market before the neckline is broken. This may lead to situations when the pattern is rejected, but you have already placed your trade.
Conclusion
Double top and double bottom patterns are quite popular among traders as they allow market participants to engage without adding any indicator on charts. However, such patterns are rather complex and require some knowledge in technical analysis and experience before you can spot them on charts. Both formations are reliable enough, but you should strictly follow the rules to trade them successfully.
FAQ

Is Double Bottom a Bullish Pattern?
Yes, it is. The double bottom pattern forms after the downtrend. It contains two dips at the same level, which means that bears are unable to move the price lower. After the second dip is rejected, the price moves higher and starts the uptrend.
How to Identify Double Tops?
To identify the pattern, you need to wait for the price to test the resistance level twice after the uptrend. The price should also test the local resistance level between moving to the peak for the second time.
When Should I Buy Trading the Double Bottom Pattern?
When trading the double bottom pattern, you should wait until the price reaches the neckline and then breaks it. Aggressive traders buy when the price just steps outside the neckline, while more conservative market participants wait for the candle to close to open a position.
What Types of Assets Can I Trade with Double Tops and Bottoms?
Traders can use all types of assets when trading with this strategy. In particular, you can buy and sell forex currency pairs, cryptocurrencies, stocks, indices, metals, etc.


