Bullish and Bearish Engulfing: Secrets that You Should Know Before Trading These Patterns

Both bullish and bearish engulfing patterns are powerful tools that allow you to find market reversals or notice market corrections. They appear quite often, which makes them very popular in the traders’ community. Moreover, such patterns have simple identification rules, which means that you don’t need to spend much time analyzing charts. By reading this article, you will find out more about bullish and bearish engulfing patterns and their features. Start trading on the Binolla platform and apply bullish and bearish engulfing patterns in your trading sessions.
Contents
- 1 Bullish and Bearish Engulfing Candles Basics
- 2 Bullish Engulfing and Bearish Engulfing in Digital Options
- 3 Bullish and Bearish Engulfing Candles in Forex Trading
- 4 Secrets Behind Engulfing Patterns
- 5 Start using these patterns on the Binolla platform
- 6 How to Trade Bullish and Bearish Engulfing patterns
- 7 Limitations of Applying Engulfing Patterns in Trading
- 8 Conclusion
- 9 FAQ
Bullish and Bearish Engulfing Candles Basics
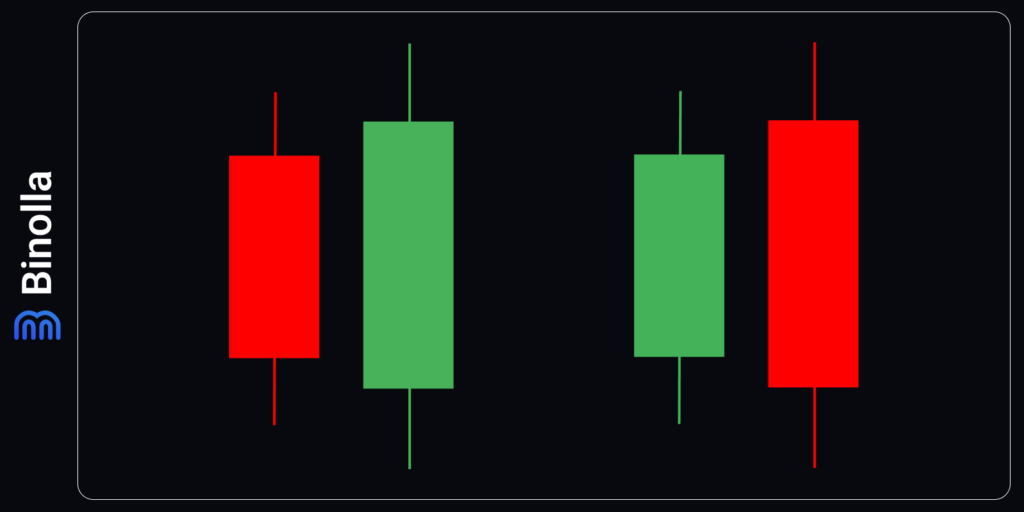
The knowledge of identifying bullish and bearish engulfing patterns is crucial for trading with these models. Therefore, the first thing you should understand is how they look on charts. The bullish engulfing is a pattern with two candlesticks inside.
The first one is bearish, and the second one is bullish. The latter has a bigger body, which “engulfs” that of the bearish candlestick. This is the main condition for pattern identification.
In bearish engulfing, the situation is the opposite. The first candlestick is bullish, and the second one is bearish, with the largest body that “engulfs” that of the first candlestick.
Bullish Engulfing and Bearish Engulfing in Digital Options
Bullish and bearish engulfing patterns are close to ideal when it comes to digital options trading. They provide traders with clear signals that, when they occur, allow them to make the right decision. One of the tricks, however, is that the price is not to go upwards or downwards right away.
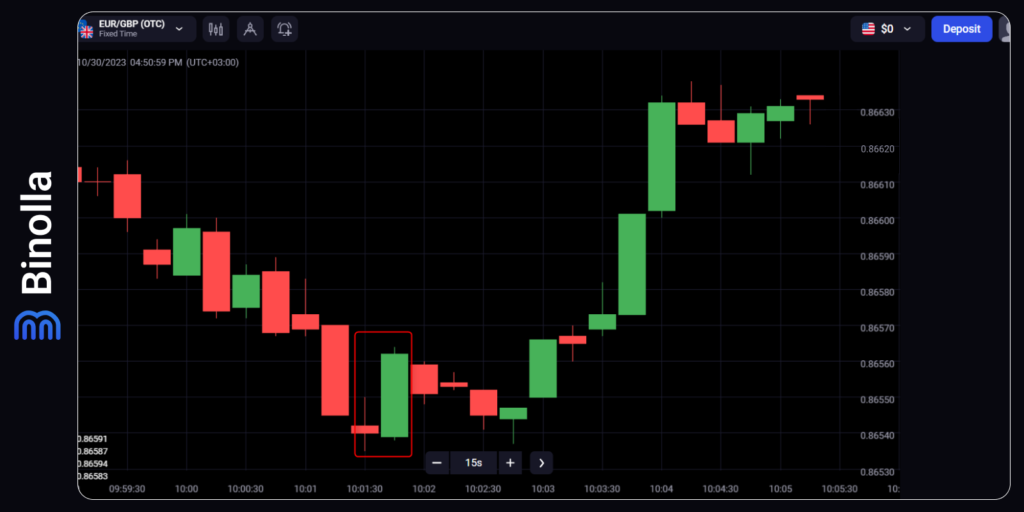
In this particular example, we have a confluence of signals, as a bearish spinning top is followed by a long bullish candlestick that engulfs the red one. However, as we can see later, the price makes a three-candle correction before moving upwards. The trick here is that if you buy a Higher digital option contract, you may lose money.
Assume that your expiration time is equal to 15, 30, 45 seconds, or even a minute (the example is taken from a 15-second chart). Then everything that expires in this interval will bring you nothing but losses.
Therefore, when trading digital options, you should be prepared for these situations and allocate your funds accordingly to be able to survive in such cases and compensate them with further profits.
Bullish and Bearish Engulfing Candles in Forex Trading
Unlike digital options, Forex trading allows you to hold your trades for as long as you want or until the margin call situation happens. In the example above, you can place a buy order and wait for the price to go up.
While it may seem more advantageous, you should also keep in mind that even a clear bullish or bearish engulfing candle signal may not work as you expect it to. In this case, digital options traders will be in an advantageous situation as their trade will be closed before the price goes further in the opposite direction, accumulating losses for their current position.
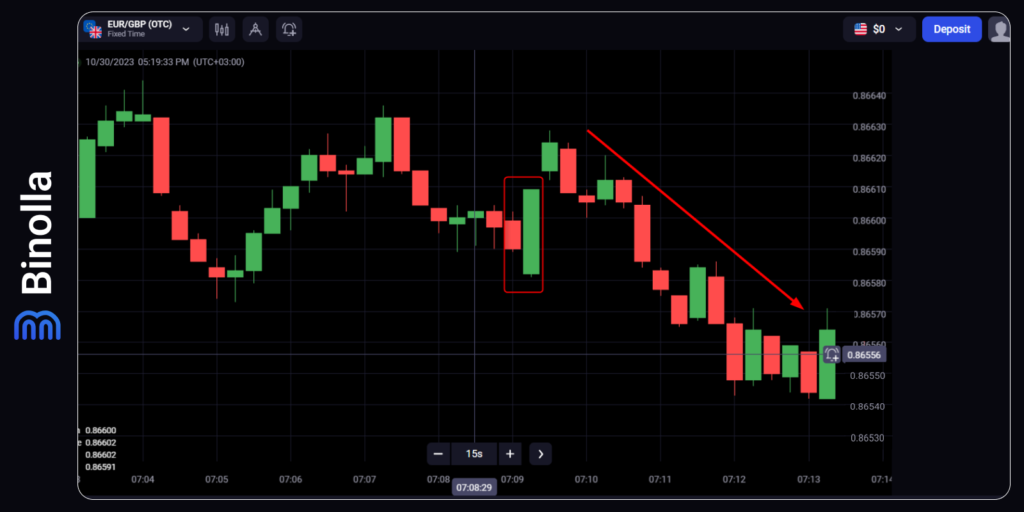
The example above shows how you can perform when buying an asset in Forex. The price moves down right after a couple of bullish candlesticks, which means that the longer you hold the trade, the heavier losses you will take by the end.
This is where the advantages of digital options come into play. Even if you miss the opportunity to make a profit by placing a longer expiration, your trade will be closed with pre-established losses, which means the minus on your balance will not exceed the amount that you placed in the trade.
Secrets Behind Engulfing Patterns
While these patterns are used by many traders worldwide, not all know some interesting facts about these price formations. We have put together some of them so that you can delve into the insights of bullish and bearish engulfing.
The first secret refers to the perception of this candlestick pattern. Bullish and bearish engulfing can be found in their pure classic versions, mostly on charts with assets with lower liquidity. This is due to the fact that price gaps occur on these charts more frequently as compared to charts with higher liquidity assets.
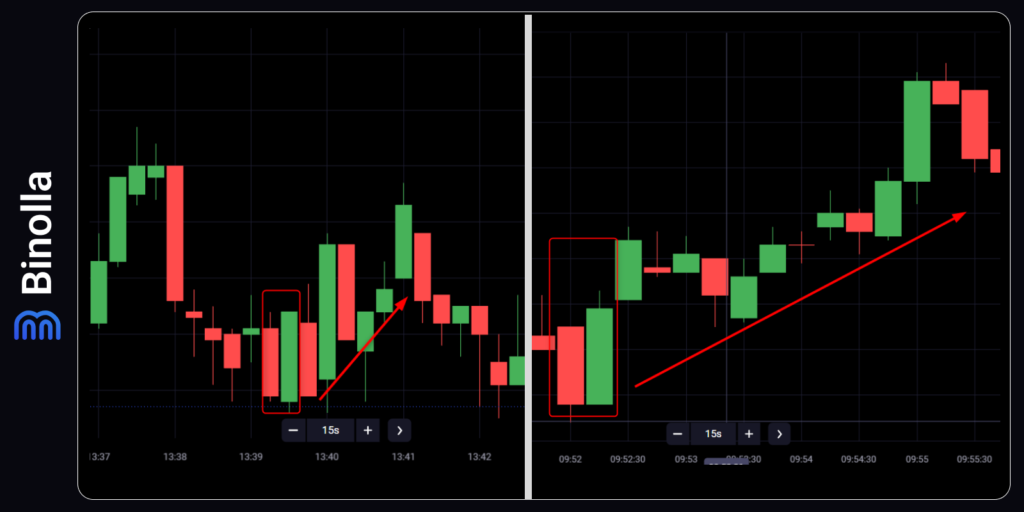
The example above shows two bullish engulfing patterns. The difference between them is that the left one is true engulfing, while the right one is the adapted version.
The true engulfing appears when the body of the first bearish candlestick is “engulfed” from both sides. This means that the closing price of the bearish candlestick is above the opening price of the bullish one. When it comes to the opening price of the bearish candlestick, it is, naturally, below the closing price of the bullish one.
This rule is 100% true for the left example, but only 50% true for the right one, as the closing level of the red candlestick is at the same line as the opening level of the bullish candlestick.
Practice shows that whether you are dealing with a true or half-true engulfing doesn’t matter. What matters is how you are prepared to trade it.
Another secret of using bullish and bearish engulfing candles is that they should appear on levels to be treated like patterns that may signal the change of the previous trend. Otherwise, it is nothing more than a couple of candlesticks that you shouldn’t take seriously.
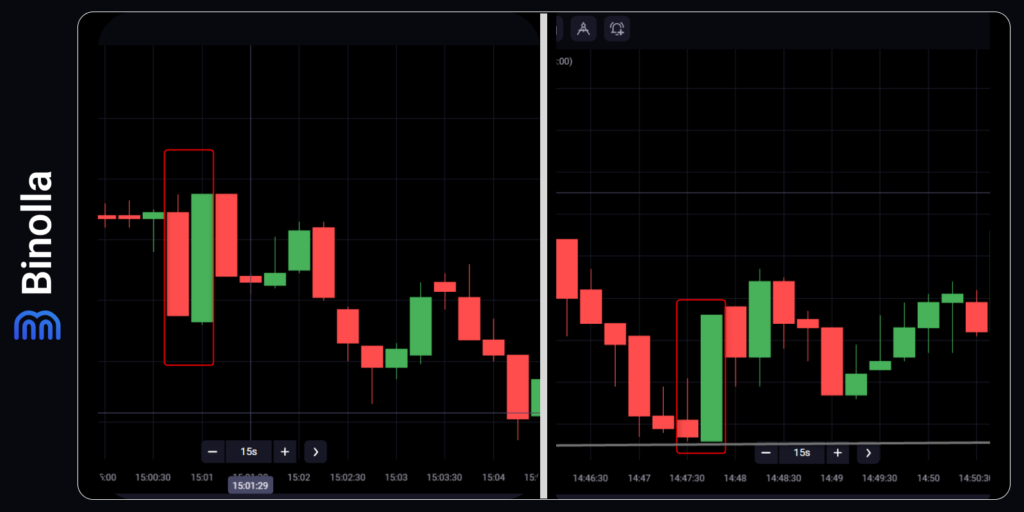
A good example of avoiding trading engulfings of both types can be found in the image above. We have a bullish engulfing pattern, but it is somewhere in the middle of the downtrend. Therefore, it is better to skip this formation and wait for the true pattern to appear.
The example in the left part of the image shows another engulfing, which can be considered this time as it was formed on the support line. The price moves upward after a while.
How to Trade Bullish and Bearish Engulfing patterns
Now that you are aware of some key secrets of these patterns, it is time to delve into some examples of how you can trade using engulfing patterns.
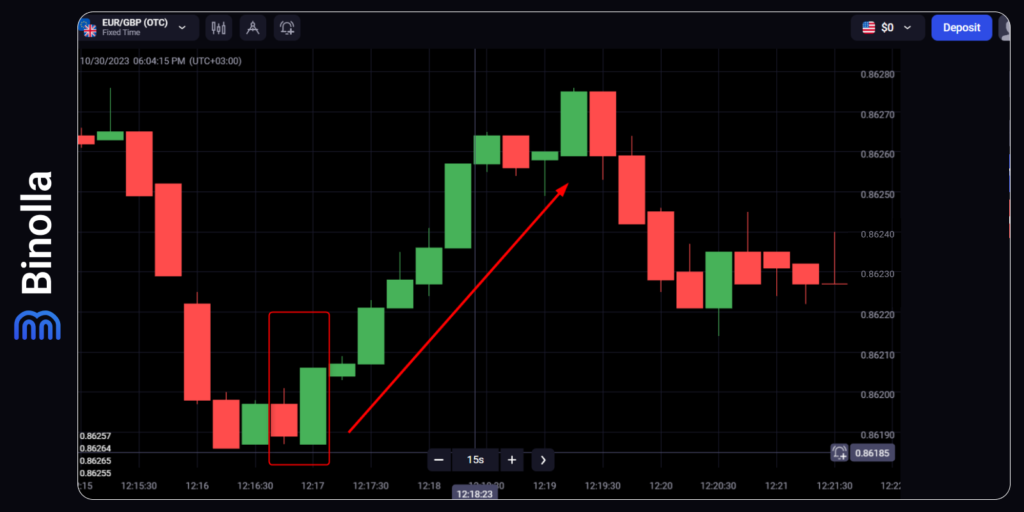
The first example here shows a bullish engulfing pattern. To trade it, you simply need to wait until the bullish candlestick closes. In this particular case, you can buy a Higher contract or purchase a currency pair or a stock.
Digital options traders shouldn’t do anything further, as they will simply wait for the outcome of this trade when the expiration strikes. When it comes to Forex, you can protect your trade by placing stop losses below the engulfing pattern at a distance that you consider enough to protect you from higher risks.
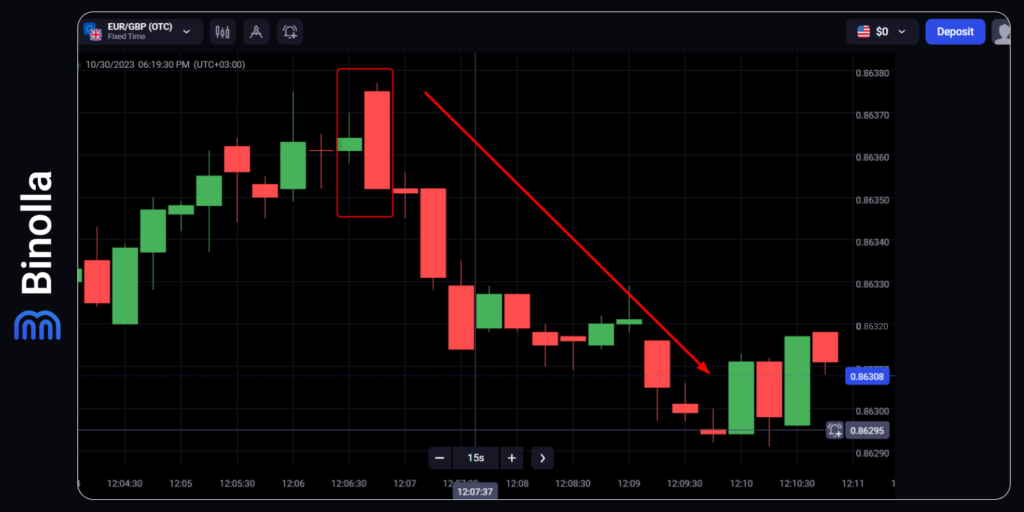
The next example is about a bearish engulfing that takes place on the resistance level. Traders can buy Lower contracts when they use digital options as their financial instruments or sell a currency pair/stock once the bearish candlestick that engulfs the bullish one closes.
While digital options traders can stop right here and wait for the expiration to see the outcomes, FX or stock traders can protect their positions from unexpected price movements. You can place a stop loss right above the pattern at a distance that you think is enough to limit your risks.
Bullish Engulfing and RSI Strategy
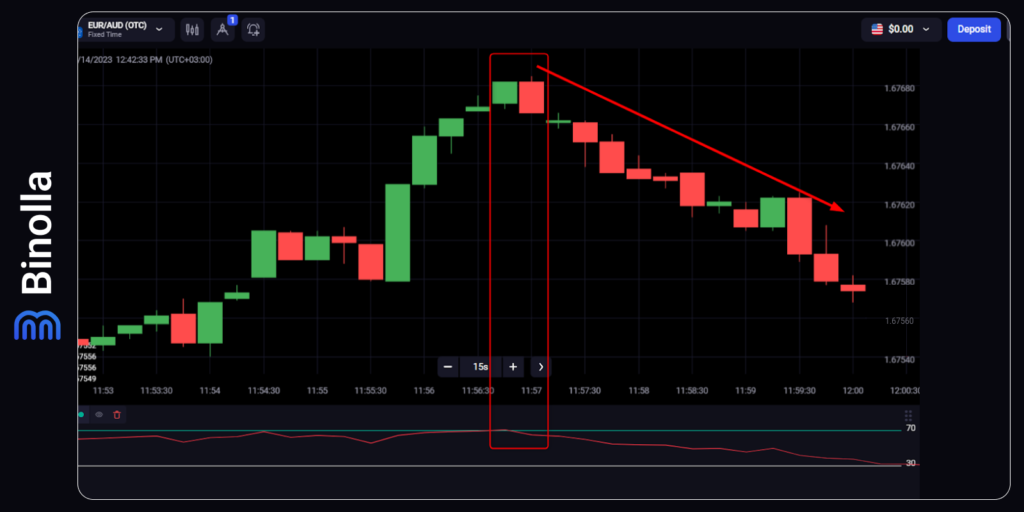
Engulfing patterns can be used as standalone strategies, but if you want to be more sure about trading signals that you receive, you can apply additional technical analysis tools. In the example above, we have a bearish engulfing pattern that predicts the first price decline.
We have also added a standard RSI indicator (Link to: RSI) that is going to provide us with additional signals and filter the existing ones. This augmented strategy works the following way. Once you see that the engulfing candle is closed, you can look at RSI below the screen. If it leaves the overbought area (above 70), the signal is confirmed.
If you are trading digital options, you can buy a Lower contract after both signals appear. FX and stock traders can go short in this case.
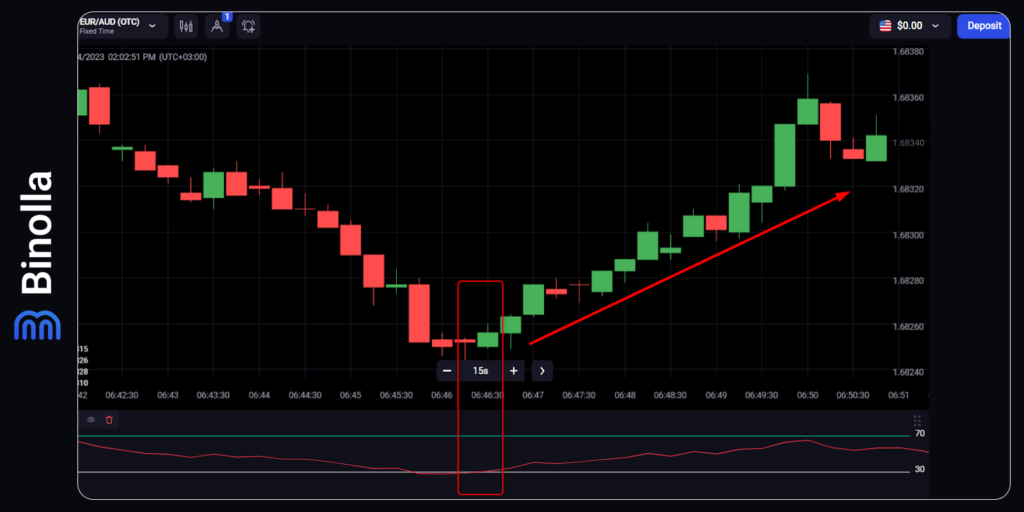
Another example of applying such a strategy can be seen above. Here we have a clear bullish engulfing pattern, with a kind of hammer candle right in front of the engulfing one. Also, we have a signal coming from the RSI indicator. The line leaves the oversold area (below 30). This is a confirmation that the reversal is taking place.
Digital options traders can both buy a Higher contract once the engulfing candlestick is closed and when the RSI leaves the oversold area. For FX and stock traders, buying assets is possible when in the same cases.
Limitations of Applying Engulfing Patterns in Trading
While bullish and bearish engulfing patterns may be very powerful tools in your strategy arsenal, they have some weaknesses that may trap traders. First of all, you should look at the market situation before trading with this formation.
We have already mentioned that engulfings appear on levels. However, there is one more rule to take care of. When the price fluctuates in a narrow range or even if there is a weak trend, then engulfing may not be a powerful tool at all, and fake signals are of greater probability.
Another limitation is that the second candlestick may be large enough, and there is not much movement to be completed by the price in the future. Moreover, if you are trading Forex or stocks, then you have to place wider stops as the distance between the opening and closing price of the engulfing candlestick will be longer. Thus, if this happens, you can skip the signal and wait for others in order to decrease the risks.
Working with engulfing may also have other tricks, like setting targets, for instance. If you trade with technical indicators, for instance, you can have a clear entry point and later watch whether the opposite signal appears. When it comes to engulfing, you can’t plan anything in advance because you don’t know when the trend will change. Therefore, it is better to add some additional tools, such as trendlines, indicators, levels, etc.
Conclusion
Bullish and bearish engulfing patterns are very popular among traders. They often appear on charts and provide market participants with reversal signals. When trading with those formations, you don’t even need to apply other technical analysis tools. However, by adding some indicators or graphic lines, you can increase the chance of collecting profits.
FAQ

What are the two types of engulfing patterns?
The two types of engulfing patterns are bullish engulfing and bearish engulfing. A bullish engulfing pattern occurs when a green candle completely covers a red candle, signaling a possible uptrend. A bearish engulfing pattern occurs when a red candle completely covers a green candle, signaling a possible downtrend.
How can traders use engulfing patterns to enter or exit trades?
Traders can use engulfing patterns to identify potential entry or exit points for their trades. For example, if a trader sees a bullish engulfing pattern after a downtrend, they may consider buying or going long on the asset. Conversely, if a trader sees a bearish engulfing pattern after an uptrend, they may consider selling or going short on the asset.
What are some factors that increase the reliability of engulfing patterns?
These factors include the size, volume, and location of the candles. Generally, the larger the candles, the stronger the signal. Similarly, the higher the volume, the more confidence there is in the reversal. Additionally, the location of the candles relative to other indicators, such as support and resistance levels, trend lines, or moving averages, can also affect the validity of the pattern.
What are some limitations or risks of using engulfing patterns?
Some limitations or risks of using engulfing patterns are that they are not always accurate, they may be influenced by market noise, and they may require confirmation from other sources. Engulfing patterns are not 100% reliable and may sometimes fail to predict the correct direction of the price movement. Moreover, engulfing patterns may be distorted by market noise, such as spikes or gaps, that do not reflect the true sentiment of the market. Furthermore, engulfing patterns may need confirmation from other sources, such as volume indicators, oscillators, or chart patterns, to increase their credibility.

