Binolla Platform: How to Use Indicators

Traders can find whatever technical analysis tools they need on the Binolla Platform. Technical indicators may be very useful if you know how to apply them in your strategy. This guide will provide you with more information about how to use indicators on our platform.
Contents
- 1 How to Start Using Indicators on the Binolla Platform
- 2 How to Set Up an Indicator
- 3 Trend Indicators
- 4 Oscillator Indicators
- 5 Try all these indicators on the Binolla platform!
- 6 Putting Several Indicators on the Chart
- 7 How to Remove Indicators from the Chart
- 8 Video Guide on How to Add an Indicator to the Binolla Platform
- 9 Conclusion
- 10 FAQ
How to Start Using Indicators on the Binolla Platform
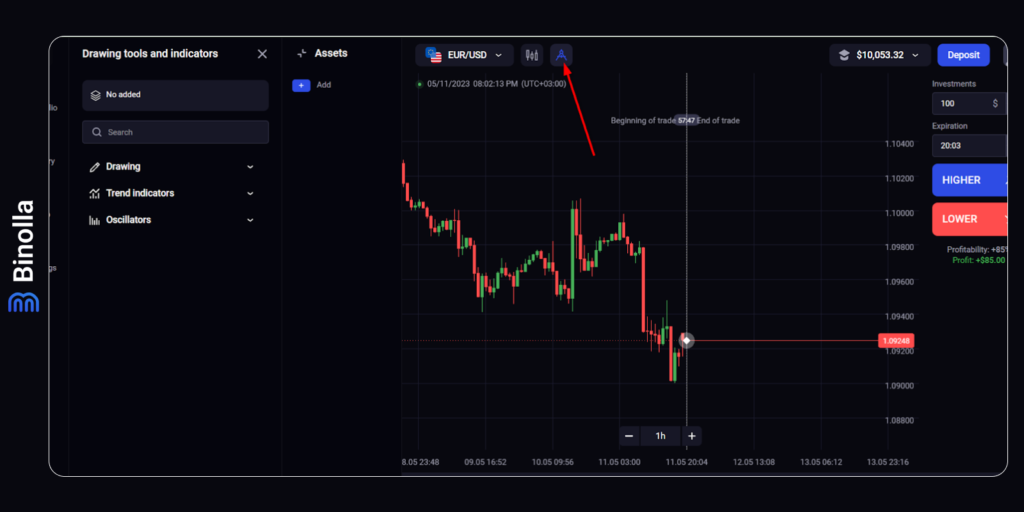
To start using indicators when trading at Binolla, you should do the following:
- Click on the button that is shown on the screenshot once you are logged in to the platform;
- Choose between Trend Indicators and Oscillators;
- Find a particular indicator inside your favorite category and click on it;
- The indicator will immediately appear on the chart.
How to Set Up an Indicator
All the indicators that you put on the chart have default settings. Sometimes it is enough for traders to simply install any indicator and use it by default. However, some strategies may require a deeper approach, and here are some settings that may be useful.
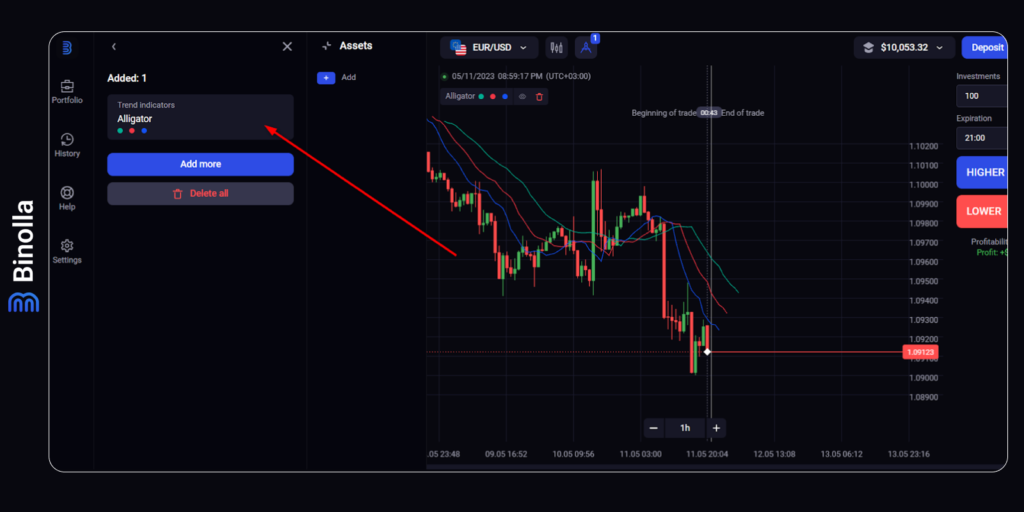
To enable the settings of each indicator, you simply need to click on the indicator that you have chosen. Once you do it, you will see a menu with all the options that you can change.
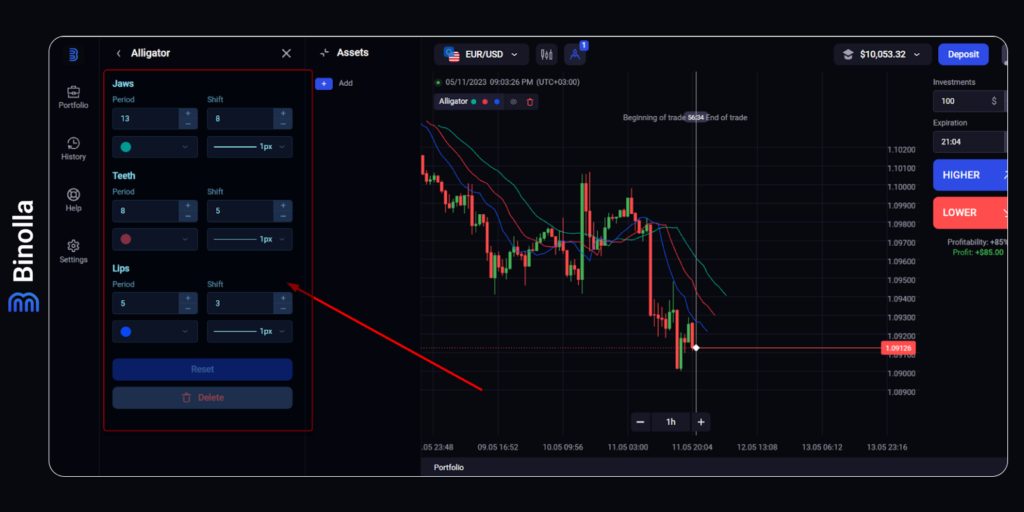
The most important option here is the period. It allows you to adjust the indicator according to your wishes. The period stands for the number of candlesticks that are taken into consideration.
Binolla Tip
By decreasing the period, you will see the indicator being more flexible. However, this makes it harder to see the general picture with the trends, while by increasing the period, the indicator becomes less flexible and allows you to better see the general trend.
Apart from period, you can also change the color of the indicator and the thickness of its lines, but, as it was mentioned above, those options are of less importance.
Trend Indicators
Before you choose a particular indicator, you will have to choose between two categories. Trend indicators are those that help traders follow market trends as they come from their name. Therefore, by putting those trading indicators on the chart, you can watch the current trend.
Binolla Tip
Keep in mind that even if you see the trend, it doesn’t give you an idea of when to place a trade. Moreover, trend trading indicators are following the price and not vice versa, meaning they are late for trend changes.
Here is the list of trend indicators that you can find on our platform (links):
- Alligator;
- Bollinger Bands;
- Envelopes;
- Fractal;
- Ichimoku Cloud;
- Keltner Channel;
- Doncian Channel;
- Supertrend
- Moving Average;
- Parabolic Sar
- Zig Zag.
Oscillator Indicators
Without going deep into details in this article, oscillator indicators are designed to find price momentum and reversals. They are always “in front” of the price, meaning they can predict reversals even if there is no sign of them on the price chart.
When it comes to oscillators, you can use the following ones on our platform (Links):
- ADX;
- Aroon;
- Awesome Oscillator;
- Bears Power;
- Bulls Power;
- CCI;
- DeMarker;
- ATR;
- MACD;
- Momentum;
- RSI;
- Stochastic;
- Schaff Trend Cycle.
Putting Several Indicators on the Chart
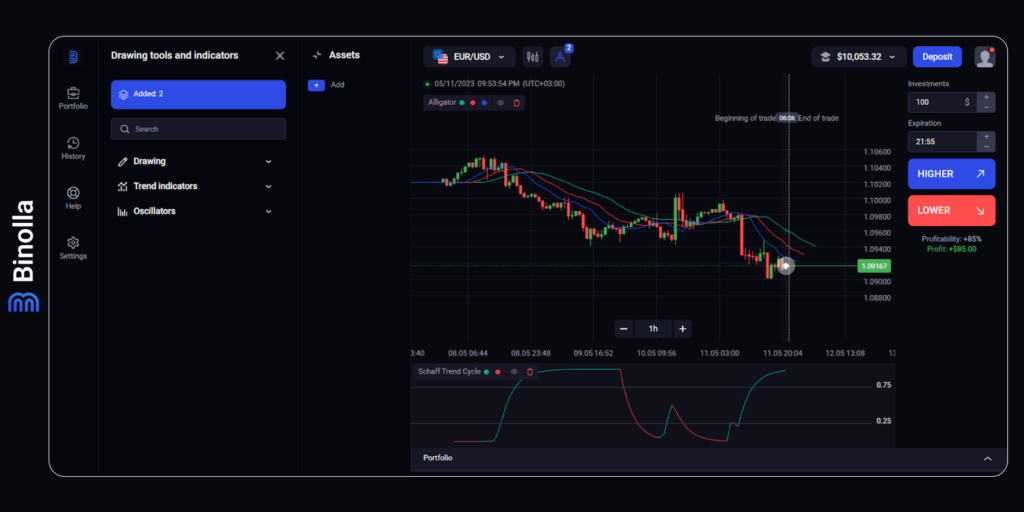
Some trading strategies go far beyond using a single indicator. When trading with Binolla, you can put on the chart a couple of or even several indicators if you need them. Moreover, you can combine trend indicators and oscillators to make the most out of them.
To add more technical indicators to the chart, you need to do the following:
- Once an indicator is put on the chart, click Add;
- Go to the category from which you want to pick another indicator;
- Select a particular one and put it on the chart.
Binolla Tip
Keep in mind that adding more indicators to the chart does not guarantee successful trading. Moreover, sometimes traders overload charts with an excessive number of indicators that prevent them from seeing trends or finding trading signals.
How to Remove Indicators from the Chart
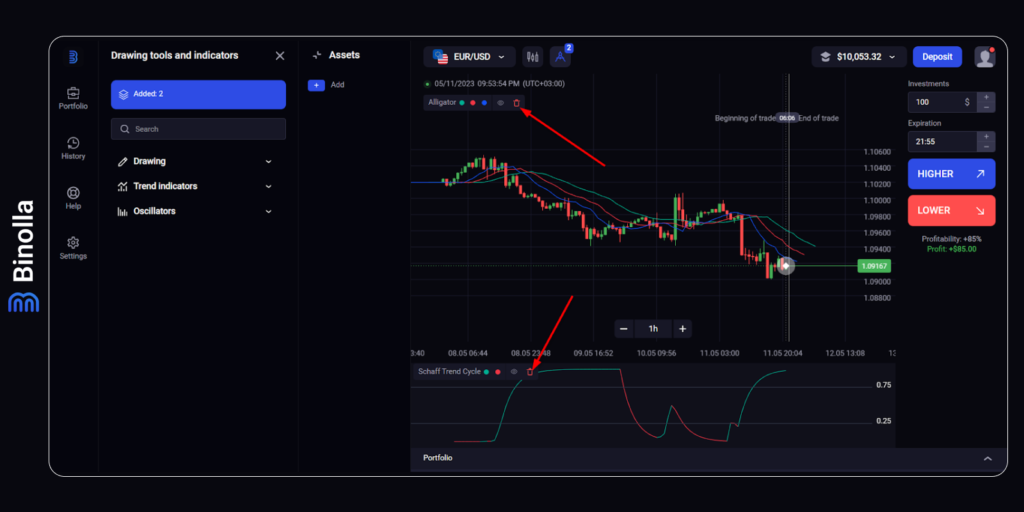
If you need to remove any indicator from the chart, you can simply click the trash bin icon as shown on the screenshot. The indicator will be removed from the chart immediately.
Video Guide on How to Add an Indicator to the Binolla Platform
Conclusion
Now that you know how to add and remove indicators from the chart, as well as how to adjust them, you can use whatever trading strategy you have. If you want to learn more about the Binolla trading platform, you may find these guides useful:
Binolla Platform General Guide
Discover the basics of our trading platform.
Binolla Platform: How to Register and Deposit Funds
Find out more about how to create an account at Binolla and start trading on the platform.
Binolla Platform: How to Trade
Discover the steps that you should take to place your first trade at the terminal.
Binolla Platform: How to Draw Support, Resistance, and Trend Lines
Start drawing your own support, resistance, trend lines, and others with our well-designed platform.
Learn more about how to switch between charts and read them on the Binolla platform.
FAQ

What Types of Trading Indicators Are Presented in the Binolla Platform?
By trading in our platform, you can use both oscillators and trend-following indicators to watch the current market trend and predict reversals.
Is There a Golden Rule to Set the Moving Average Indicator?
No, there isn’t. Trading indicators can be set according to your preferences, but there is no golden rule for them. If you increase a period, you will see the trading indicator being sleeker. While after decreasing the period, the MA will be faster to react to price changes but you will have a lot more fake signals.
How Many Indicators Should Be Used in the Best Trading Strategies?
When choosing indicators for your strategy, you shouldn’t think about their number, but their inside. Even if you add one indicator, but build a strategy around it, you can make money with it.


