Binolla Platform: How to Draw Support, Resistance, and Trendlines

Drawing support, resistance, and trendlines may be very useful for traders to understand the current market situation and even to forecast price fluctuations. While naked price charts look a bit chaotic, once you put levels and trendlines on them, price fluctuation starts making sense. By reading this guide, you will learn more about how to draw support/resistance and trendlines on the Binolla platform. You can also start trading right now by creating an account at Binolla.
Contents
- 1 How to Put Horizontal Lines on the Chart with the Binolla Platform
- 2 Experiment with various drawing tools!
- 3 How to Build Trendlines on the Binolla Platform
- 4 How to Remove Drawings from the Chart
- 5 How to Use Drawing Tools on the Binolla Platform: A Video Guide
- 6 Trading with Lines: Tips and Tricks
- 7 Conclusion
How to Put Horizontal Lines on the Chart with the Binolla Platform
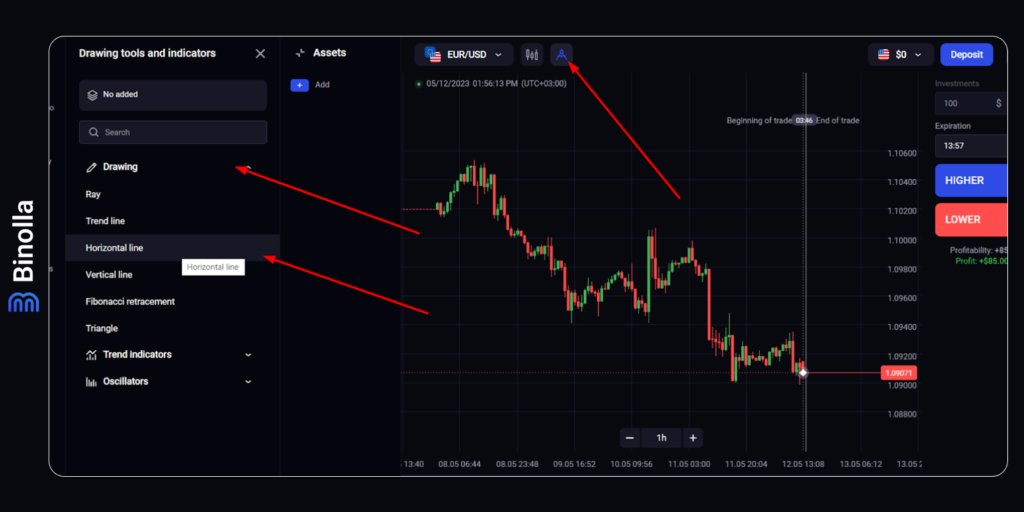
To add your first horizontal line to the chart, you simply need to click the icon at the top of the screen, as shown in the image above. You will see an additional screen on the left with Drawing tools. Here, you need to choose the Horizontal line.
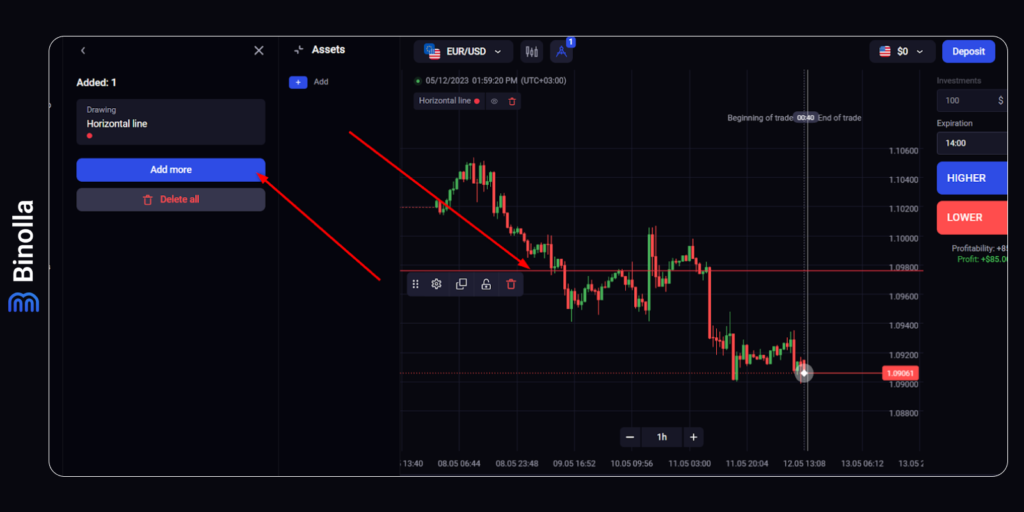
Once you click the Horizontal line, you will see it appear in the middle of the chart. However, this is not a support or resistance level at all. Now you need to move it upwards or downwards to transform a simple line into a level. The balance between bulls and bears shifts, and the price reverses.
Binolla Tip
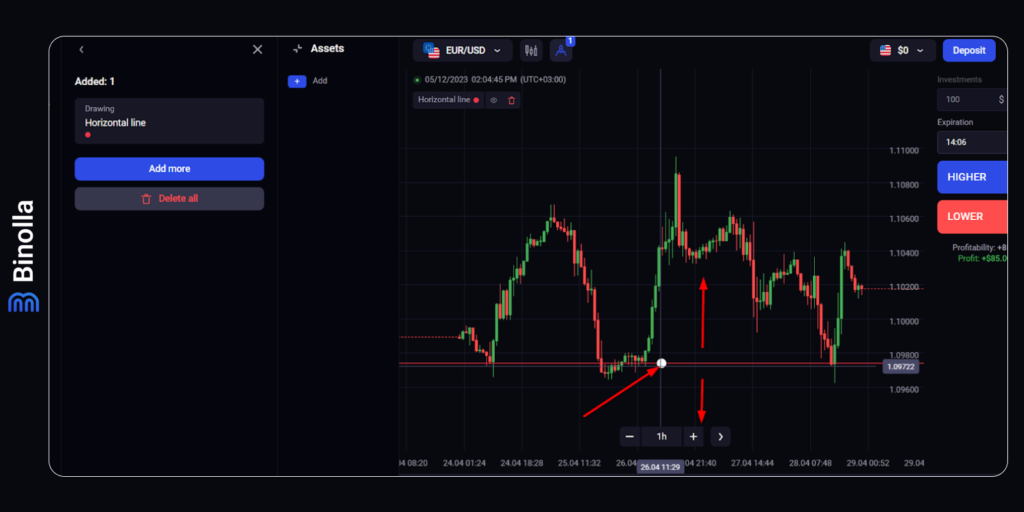
The support level, or simply support, is a price level that the asset does not fall below for a period of time. To put it simply, support marks an area, which prevents the price from going lower. Read more about support here (link: Support and Resistance Levels: How to Use Them).
To adjust the Horizontal line position and turn it into the support area, you need to hover over it with your mouse, click on the highlighted dot, and drag the line up or down. As support naturally prevents the price from going down, it is drawn through local price lows. A
Binolla Tip
The resistance level, or simply resistance, is a line where the underlying asset can’t move above. Simply put, this level prevents the price from getting higher.
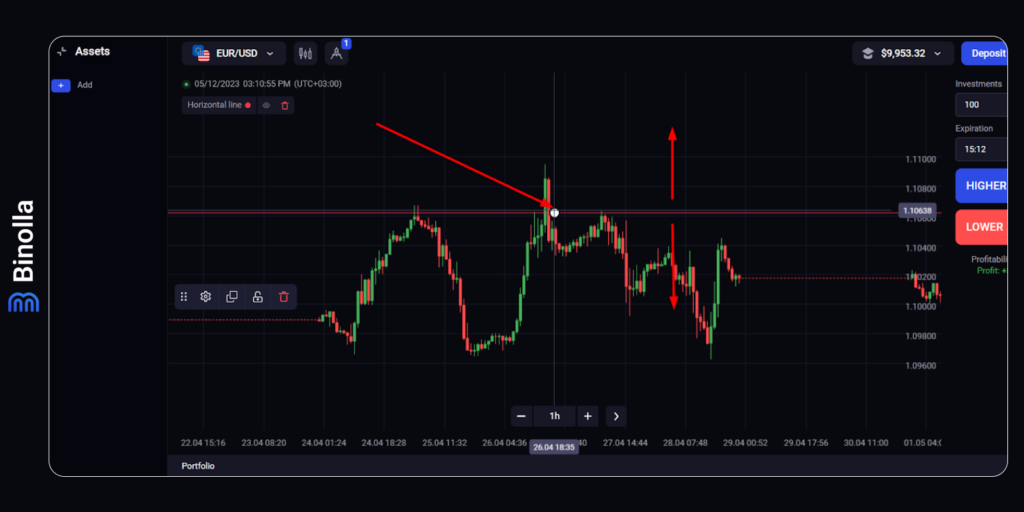
To adjust the resistance level, you need to drag the line so that it matches at least a couple of highs. As you can see, resistance prevents the price from going higher.
Binolla Tip
Keep in mind that support and resistance levels can’t hold the price forever. At a certain moment, the underlying asset breaks (Link to: Breakout Strategies in Trading) those levels and goes higher or lower. Additionally, the price may return to those levels in the future and they will work.
Support and Resistance Lines: What Are They For?
Support and resistance lines, or areas, are used by traders to find entry points where the price is likely to reverse. When the price is close to support, it is likely that it reverses upwards and moves higher. Therefore, traders can buy Higher options if this happens.
On the other hand, when the price is close to the resistance line, it means that it is likely to reverse downwards, which is a great opportunity for traders to buy Lower contracts.
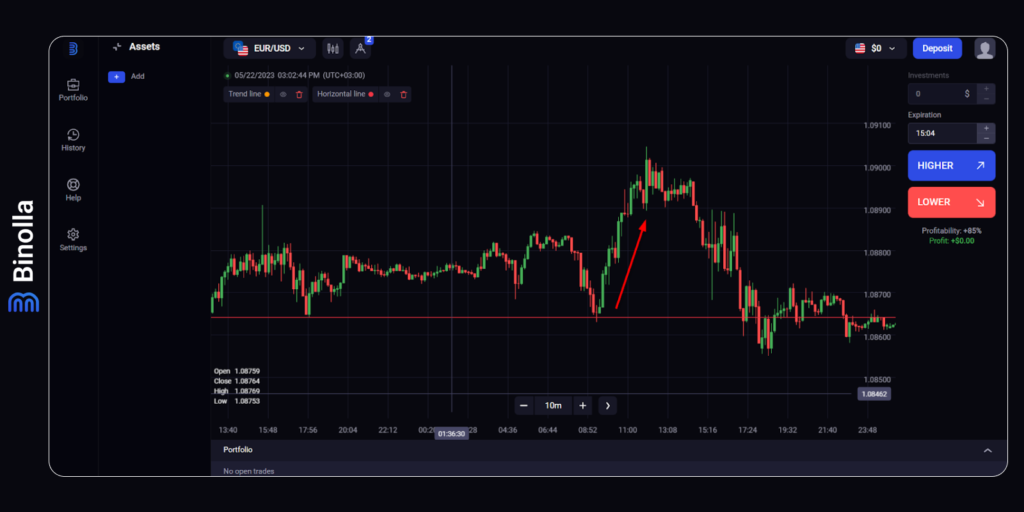
The example above shows how you can use support in trading. EUR/USD tests the support line and rejects it with a doji candlestick, which is one of those patterns of uncertainty, but normally, it works as a reversal one. Therefore, once you see such a pattern that appears on the support level, you can buy a Higher contract or purchase EUR/USD if you are dealing with Forex CFD.
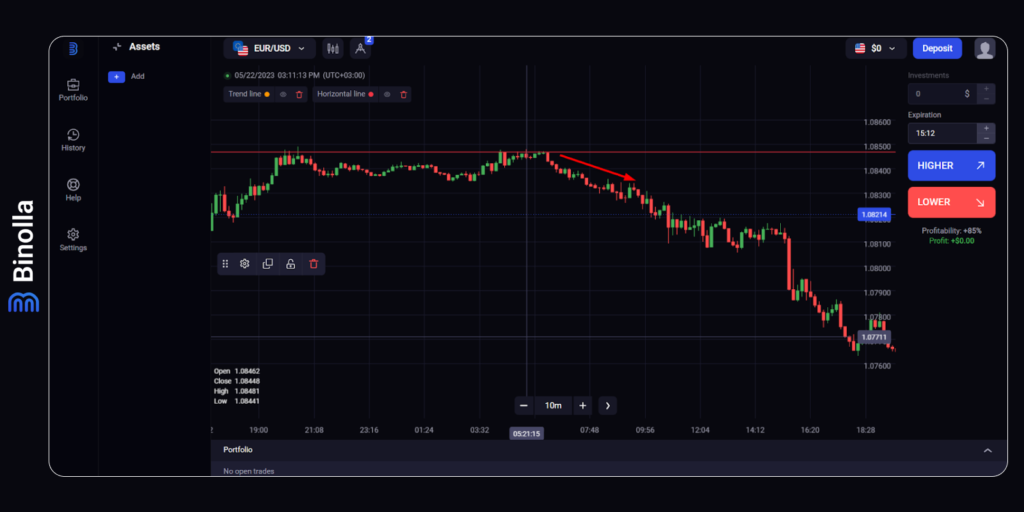
When it comes to resistance, you can use it the same way, but in the opposite direction. Once the price tests it, you can prepare yourself for trading. If you find any confluence signals, like bearish engulfing in our case, you can buy a Lower contract or sell the currency pair.
Binolla Tip
The simple fact that the price is close to those levels does not guarantee that the underlying asset is going to reverse. To make sure that it happens, most traders use some confirmation signals, including Japanese candlestick reversal patterns or even oscillator indicators.
How to Build Trendlines on the Binolla Platform
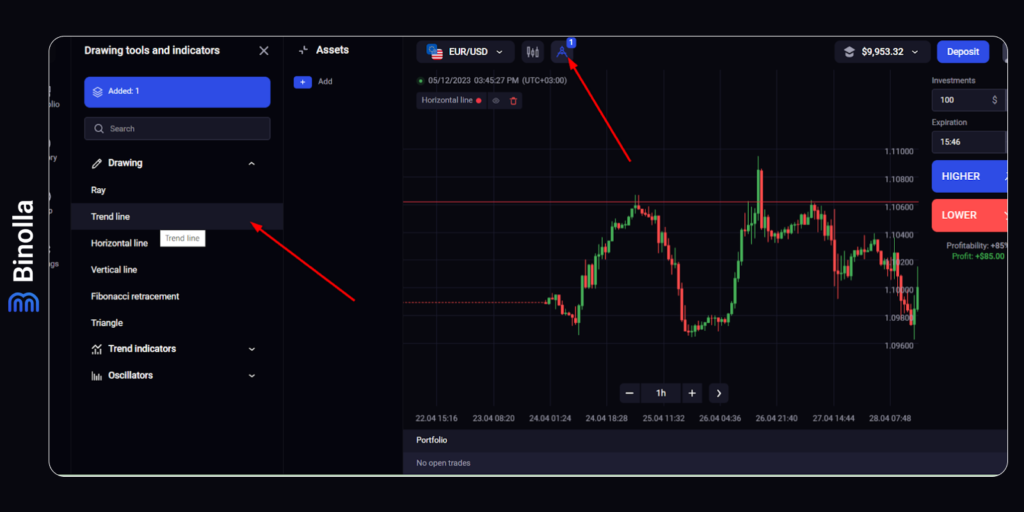
To build a trendline, you need to go to drawing tools, as shown in the image above. Here you are to select the trendline.
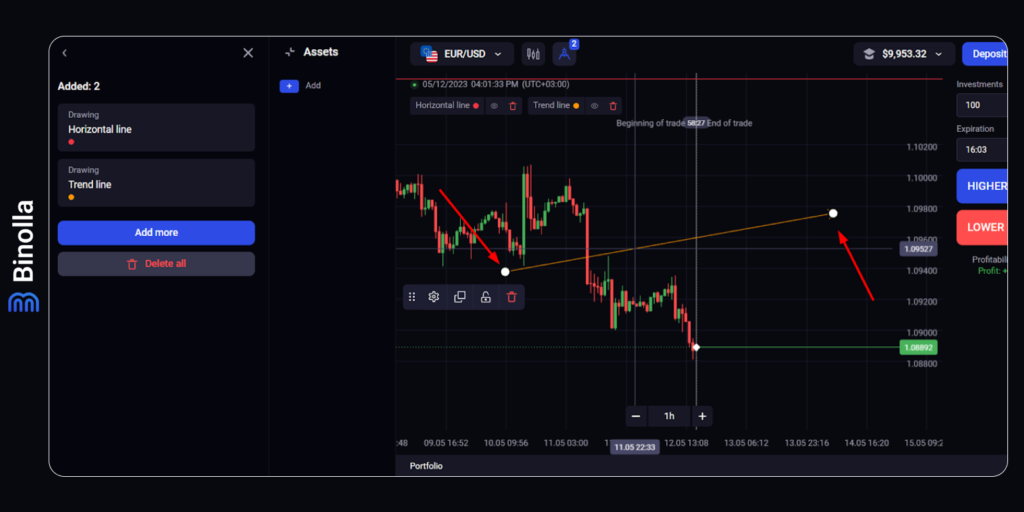
Once the trendline appears, you can drag its ultimate points to adjust it according to the current market situation.
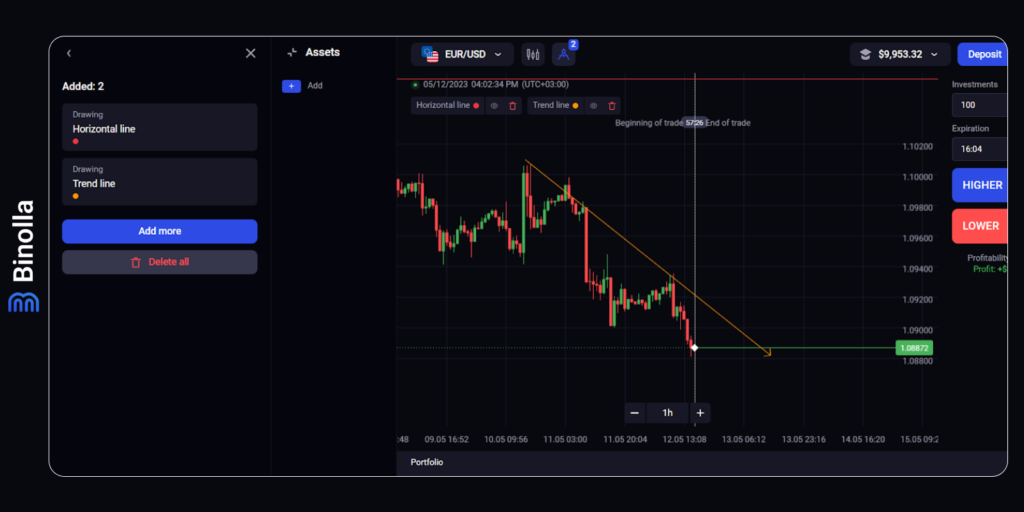
Here is what you get if you do everything right. The descending trendline helps you find downtrends. To draw it, you need to connect the highs, as demonstrated in the image above. To find out more about trendlines, read this article.
Trading with Trendlines Basics
The trendline acts like support or resistance, depending on the situation. The descending trendline prevents the price from going higher, while the ascending one stops it from moving lower.
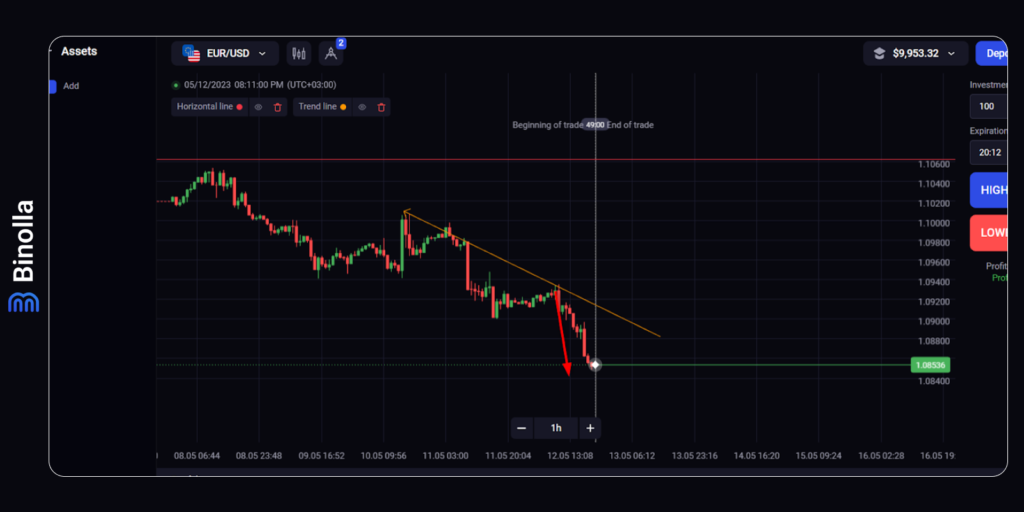
In the example above, there is a descending trendline, which prevents the price from going higher. This trendline also demonstrates that the market is in a downtrend currently. Therefore, it would be a great idea for traders to find the point where the price bounces off the trendline to buy a Lower contract or sell the currency pair when dealing with FX CFD.
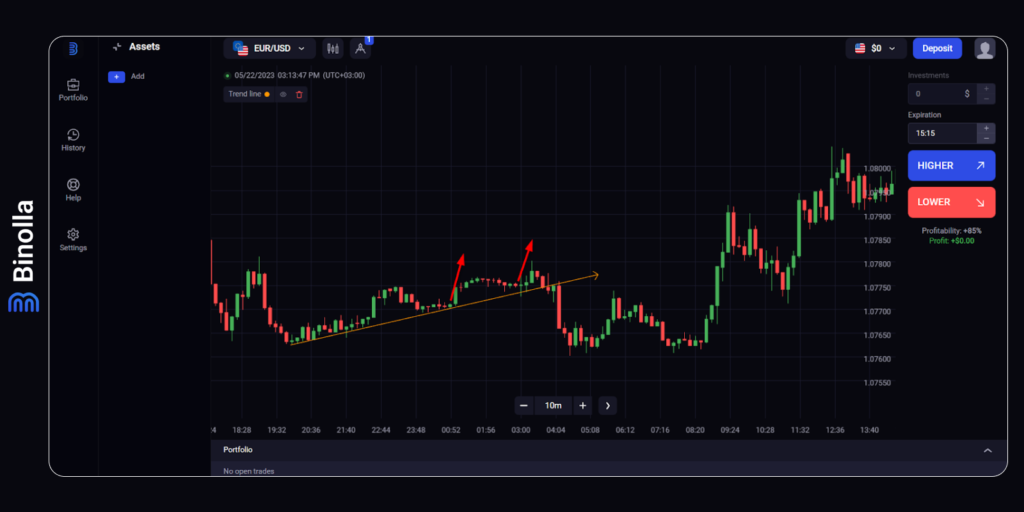
The ascending trendline is another opportunity for a trader to benefit from the current market situation. Once the price rejects it, you can watch for more signals, like candlestick patterns, to buy Higher contracts or to purchase the currency pair if you are using Forex CFD instruments.
How to Remove Drawings from the Chart
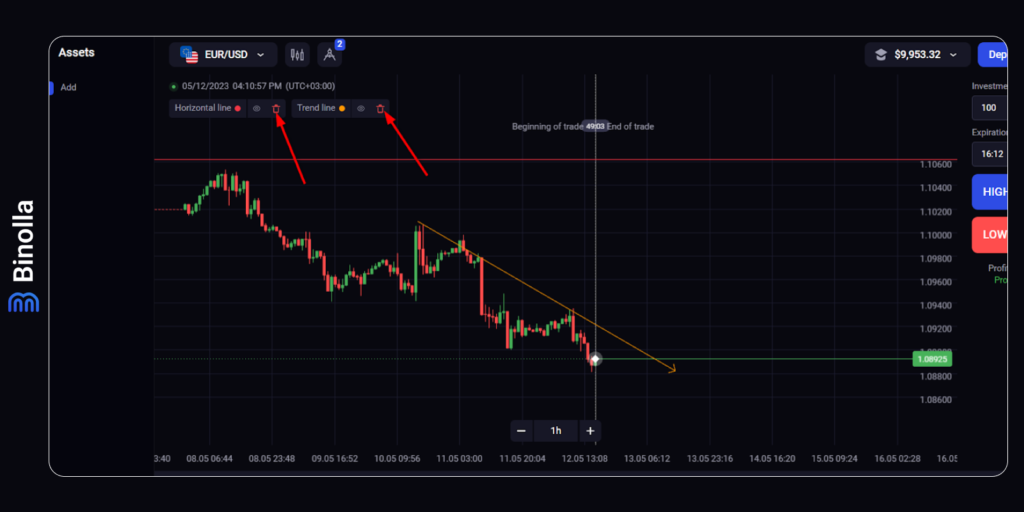
If you need to delete drawings from the chart, you can easily do it by simply clicking the trash bin icon.
How to Use Drawing Tools on the Binolla Platform: A Video Guide
Trading with Lines: Tips and Tricks
Now that you know how to apply all types of lines to the charts, it is time to learn some useful recommendations on how to use them:
- The price does not necessarily touch and go. Sometimes you can see that the price steps outside lines for a while. This may be a couple of pips. If this happens, you should stick to those lines and wait for the price to reverse;
- Fake breakouts. In this situation, the price steps outside for even more pips, and the whole picture looks like you have a clera breakout. However, the price may reverse and get back below the resistance or above the support. You should learn how to make a difference between true and fake breakouts;
- Breakouts. If the price breaks a particular level or trendline, it is called a “breakout”. use such situations to open trades along new trends;
- The more dots, the better. Stronger support, resistance and trendlines have more dots connected by lines. If a trendline, for instance, has only three dots, it is weaker than a trendline connecting 5-6 dots. However, you should also keep in mind that none of those lines are eternal. At some point, the price will break them to set a new trend of going towards the next support/resistance levels;
- Use confluence signals. It is not enough to draw a trendline or support/resistance levels. You will need some additional signals to increase your chances of profiting. For instance, you can add candlestick analysis to combine levels and chart patterns.
Conclusion
Those are the basics of drawing support/resistance and trendlines. To learn more about our platform, you can read the following articles:
Binolla Platform General Guide
Discover the basics of our trading platform.
Binolla Platform: How to Register and Deposit Funds
Find out more about how to create an account at Binolla and start trading on the platform.
Binolla Platform: How to Trade
Discover the steps that you should take to place your first trade at the terminal.
Binolla Platform: How to Use Indicators
Learn about trading indicators and how to use them on our platform.
Learn more about how to switch between charts and read them on the Binolla platform.


