Binolla Platform: Charts

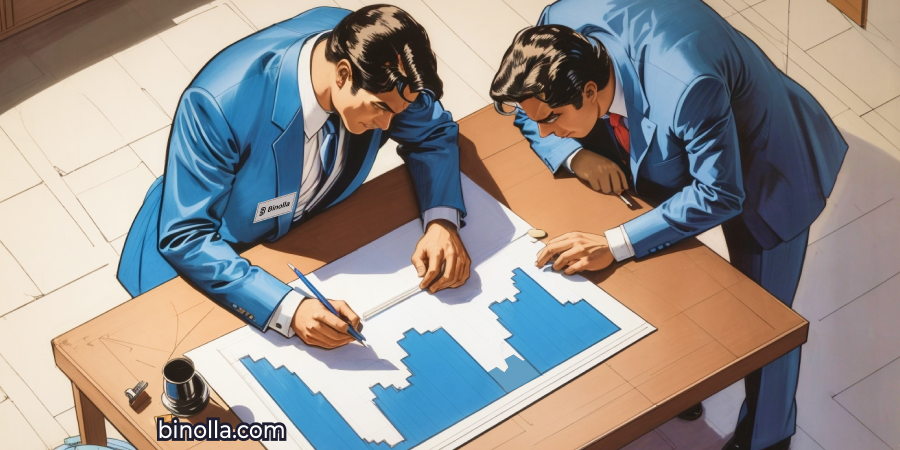
Charts are very important in trading as they allow traders to see the current asset’s price as well as to look at the past and see how a particular financial instrument performed over time. Moreover, charts are not only about price perception. They can be used to analyze markets and reveal trends as well as price reversals. At Binolla, we provide our customers with the most popular types of charts to trade digital options. By reading this guide, you will learn more about how to change them, and we will also provide you with some basics about each one.
Contents
How to Switch between Various Types of Charts in Binolla

To get access to charts and switch between them at Binolla, you need to do the following:
- Log in to your Binolla account;
- You will see the candlestick chart that is set by default in the middle of the screen;
- Click the button showing candlesticks at the top;
- Choose your preferred type of chart in the dropdown menu to trade digital options.
Now that you know how to access charts and change them, it is time to look deeper at each type.
Japanese Candlestick

This is the most popular type of chart in trading nowadays. A Japanese candlestick represents four main pieces of data that are very useful for a better understanding of the current price: open, high, low, and close levels. Each separate unit reflects price changes for a particular period. For instance, if you are trading on a five-minute chart, each candle forms for five minutes.
Green candlesticks stand for bullish, while red ones stand for bearish. Bullish candles form when the open level is below the closing, while bearish candles, on the other hand, appear when the open price is higher than the closing.
Japanese candlesticks can be used for price reading, but they are also a ready-made analysis system that allows you to make your assumptions on further price fluctuations and helps you make digital options analysis. To learn more about this type of chart, you can read this article.
How to Trade Using Japanese Candlestick Charts
Japanese Candlesticks are not only about reading the price. This is a ready-made analysis tool that allows you to both predict market reversals and trend continuation to trade digital options profitably. There are so-called candlestick patterns that you can use in your daily trading routine to forecast price fluctuations.

Here is an example of this strategy. A hammer pattern on the support line is a reversal signal, which normally allows us to predict the end of the downtrend and the beginning of the uptrend.
The hammer pattern is a green candlestick with a long tail below it and a small body. The longer the tail, the stronger the signal. In this example, we have a hammer pattern that resides on the support level, which is one of the strongest signal confluences.
As you can see, the price goes up after the hammer is closed. Therefore, traders could buy Higher digital options in this case and profit from such a trade. To find out more about other patterns that you can use in trading, read Candlestick Charts: The Most Popular Reversal Patterns.
Along with those patterns, traders can use standard tools like levels and trend lines in digital options trading.

The image above shows the EUR/USD currency pair and the ascending trend line. While the currency pair remains above it, traders can assume that the asset is in uptrend. Therefore, each time when it bounces off the trend line and moves upwards, traders can buy Higher contracts.
Heikin Ashi

This type of chart is based on Japanese candlesticks, but it has some major twists that make it look a bit different. The idea behind this type of chart lies in reducing the impact of market noise and creating a chart that will better demonstrate price trends as compared to classic candlesticks.
However, on the other side, along with the above-mentioned advantage, there is a disadvantage too. When you use Heikin Ashi, some price information is lost due to the averaging that is used to create those candles.

Find your best type of chart with Binolla!
Join Binolla and choose from all these types of charts to create your best strategy
Register nowLong bearish candlesticks with small upper tails represent a strong downside trend, while long bullish candlesticks with small or no wick stand for the uptrend. To learn more about this type of chart, you can read this article.
How to Trade Using Heikin Ashi
Unlike Japanese Candlesticks, Heikin Ashi does not offer this huge variety of reversal patterns. There is only one strong signal that you can use, for sure.

Doji (a candlestick with a small body and tails in both directions) is a strong reversal pattern that demonstrates the uncertainty and the possible change of moods on the chart. Therefore, when traders find those doji patterns, they can buy Higher contracts if those patterns conclude the downtrend and purchase Lower when the doji is formed at the peak of the uptrend.
You should also keep in mind that tails play a very important role in the Heikin Ashi analysis system. The longer wick and the smaller body tell digital options traders that the current market trend is wicker and the market reversal is close.

Another way to trade with Heikin Ashi charts is to stick to the current trend. One of the advantages of this chart is that it removes market noise. Therefore, you can see that only bullish candlesticks are formed during a strong upside and bearish during a strong downside. Sticking to the trend means buying Higher when you see bullish candlesticks with long bodies and small wicks and purchasing Lower contracts when the bearish candlesticks have long bodies and small tails.
Line

This is the simplest and most basic type of chart that allows you to see the “naked” price. It forms dots that are connected by line segments. Its second when a new price is set, a new dot appears, and a line between it and the previous one is drawn.
Being simplistic, they do not include open and close prices and do not allow you to find any patterns in price behavior, instead, they can be great in trading with various technical indicators. To find out more about line charts, you can look through this article.
Trading with Line Charts
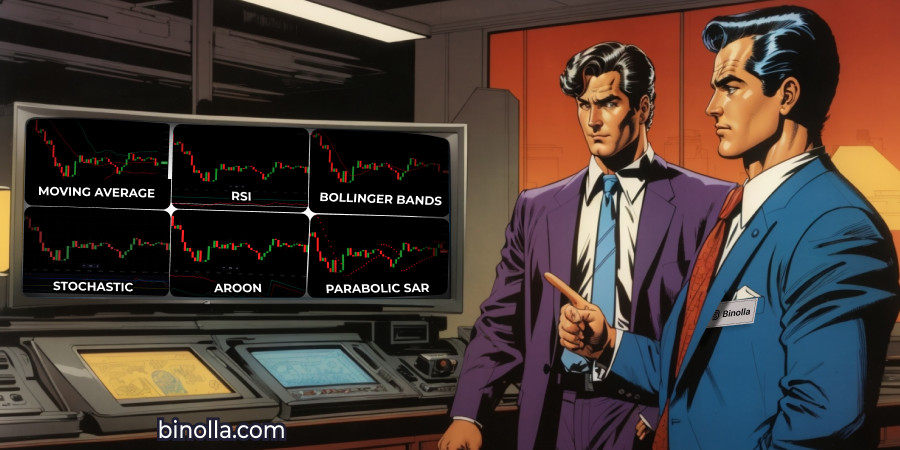
While the line chart is less informative than Japanese candlesticks, Heikin Ashi, or bars, it allows you to use standard price models and tools like trend line, support and resistance, etc.

The easiest way to trade using the line chart is to draw a trend line. In the example above, you can see a descendant trend line, which prevents the price from moving higher and defines a general downtrend. The idea here is to buy Lower options when the price rejects the descending trend line.

Another classic strategy is to use indicators. The RSI indicator in our example leaves the overbought area (above 70) and moves below. Here is a signal for traders to buy Lower contracts.
Bars

This type of chart represents the open, high, low, and close prices of a particular asset and it is similar to Japanese candlesticks, even if they look a bit different. The vertical line here represents the high and low prices for a particular period, while horizontal lines stand for the open and closing prices.
Like with Japanese candlesticks, the bars are bullish (green) when the open price is below the close one and bearish (red) when the open price is above the close one. To learn more about bars, you can read this article.
Trading with Bars

Like Japanese candlesticks, bars also have their own patterns that make them an autonomous analysis system. The example above shows a two-bars bullish pattern, which allows traders to see the price reversal and, therefore, buy Higher options.
The example above shows how to use bars in range trading. You can see support and resistance levels and the price fluctuating between them. Each time it rejects resistance, you can buy Lower contracts, while when the price bounces off support, traders buy Higher contracts.

The Binolla platform offers an opportunity to personalize the visual component of the chart. To do that, one needs to click the settings icon below the chart. Once a trader does this, they can switch between filled and hollow candlesticks. Moreover, market participants can also set colors of both bullish and bearish candlesticks on their own.
Conclusion
Traders often use their preferred types of charts to forecast price fluctuations. A particular type of chart may become the foundation for a strategy. We advise traders to discover more about each one before making the final decision.
To learn more about our platform, you can go through the following articles:
Binolla Platform General Guide
Discover the basics of our trading platform.
Binolla Platform: How to Register and Deposit Funds
Find out more about how to create an account at Binolla and start trading on the platform.
Binolla Platform: How to Trade
Discover the steps that you should take to place your first trade at the terminal.
Binolla Platform: How to Use Indicators
Learn about trading indicators and how to use them on our platform.
Binolla Platform: How to Draw Support, Resistance, and Trend Lines
Start drawing your own support, resistance, trend lines, and others with our well-designed platform.
FAQ

Why Do Traders Switch Charts?
While the basic chart is a line, you may be interested in having more information about the current price based on open, high, low, and close. Moreover, using various charts allows you to build a lot more strategies based on graphic analysis methods.
What Chart is Best for Traders?
Everything depends on your preferences. However, if you want to make data-driven decisions, you can use Japanese candlesticks, bars, or even Heikin Ashi.
What is the Most Frequent and Popular Chart Pattern?
Most traders often use a hammer and its derivatives, as this is one of the most frequent reversal patterns.