Zigzag Forex Indicator: Basic Principles and Trading Strategies

Zigzag is a trend indicator that helps traders identify price movements. It can be very helpful when it comes to defining price reversals. The indicator can also filter out short price fluctuations, which, in turn, reduces noise and makes this technical analysis tool even more helpful. Zigzag can equally be used for digital options trading, Forex, stocks, and other types of assets. By reading this article, you will find out more about the basics of the Zigzag indicator as well as learn more about how to apply it to different strategies. Start trading with Zigzag on the Binolla platform.
Contents
- 1 Zigzag Forex Indicator Basics
- 2 How to Use Zigzag Indicator on the Binolla Platform
- 3 How to Trade Zigzag Indicator: Basic Strategies
- 4 Start using Zigzag in your trading sessions!
- 5 How to Trade Zigzag Indicator with Patterns
- 6 Non-Repaint Zigzag Indicator
- 7 Zigzag Indicator Recommendations
- 8 ZigZag Fore Indicator Pros and Cons
- 9 Conclusion
- 10 FAQ
Zigzag Forex Indicator Basics
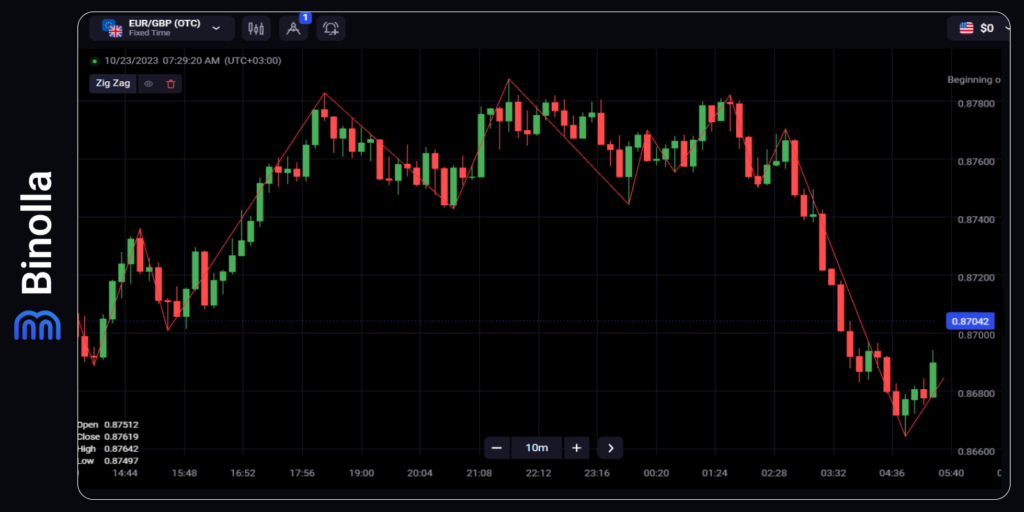
The Zigzag indicator is a powerful tool used in forex trading to identify trend reversals. It helps traders by:
- Filtering out short-term fluctuations in price, making trends easier to spot;
- Highlighting underlying trends by connecting points on a chart whenever prices reverse by a percentage greater than a pre-chosen variable;
- Identifying potential support and resistance zones between plotted swing highs and swing lows;
- Revealing reversal patterns, such as double bottoms and head and shoulders tops.
Remember, the Zig Zag indicator doesn’t predict future trends, but it assists traders in understanding price movements. It’s often used alongside other technical indicators to confirm overbought or oversold conditions.
Experiment with different percentage settings to find what works best for your trading strategy.
How to Use Zigzag Indicator on the Binolla Platform
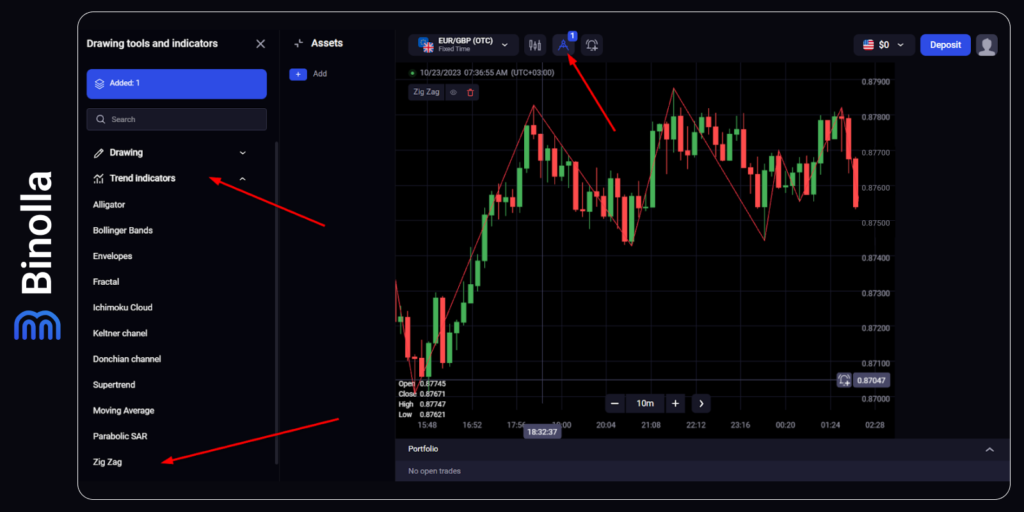
To apply the indicator to the Binolla platform, you need to complete the following steps:
- Go to the platform and log in to your account.
- Click the icon with tools at the top of the screen.
- Choose Trend Indicators at the left part of the page.
- Scroll down the dropdown menu and click Zigzag there.
Now that you have added the indicator to the platform, it is time to look at its settings. There are three main parameters that should be taken into consideration when working with this indicator:
- Depth: This represents the minimum number of price bars required where there is no secondary high or low. It helps filter out minor fluctuations and focuses on significant swings in price;
- Deviation: The deviation is expressed as a percentage. It indicates the number of pips that prices can deviate above the previously plotted high or low for the Zig Zag indicator to re-change its highs and lows. Adjusting this value impacts the appearance of the Zig Zag line;
- Backstep: The backstep setting reflects the minimum number of bars (or candlesticks) between which the highs and lows can be plotted. It determines how closely the indicator follows price movements.
You can set them on your own. For instance, the basic meaning for Depth is 5, which means that five bars are used with no secondary highs and lows. By increasing them, you can find longer trends, and the distance between swings will also be longer. Therefore, you will be able to catch longer price movements and cut the noise. However, if you are looking for more precise entry points on reversals or want to find exit points for small and medium trends, you can use standard parameters or even reduce them.
How to Trade Zigzag Indicator: Basic Strategies
The first thing that you should remember about this indicator is that Zigzag works better when you add other technical analysis tools. They could be indicators or even drawing tools like support and resistance levels, Fibonacci Retracement, etc.
The first strategy that we are going to consider is based on a non-repaint zigzag indicator and a simple channel that we have applied for the uptrend.
While the price stays in this channel, you can expect it to climb higher by jumping off the lower line and rejecting the higher one.
Zigzag Indicator with Ascending Channel
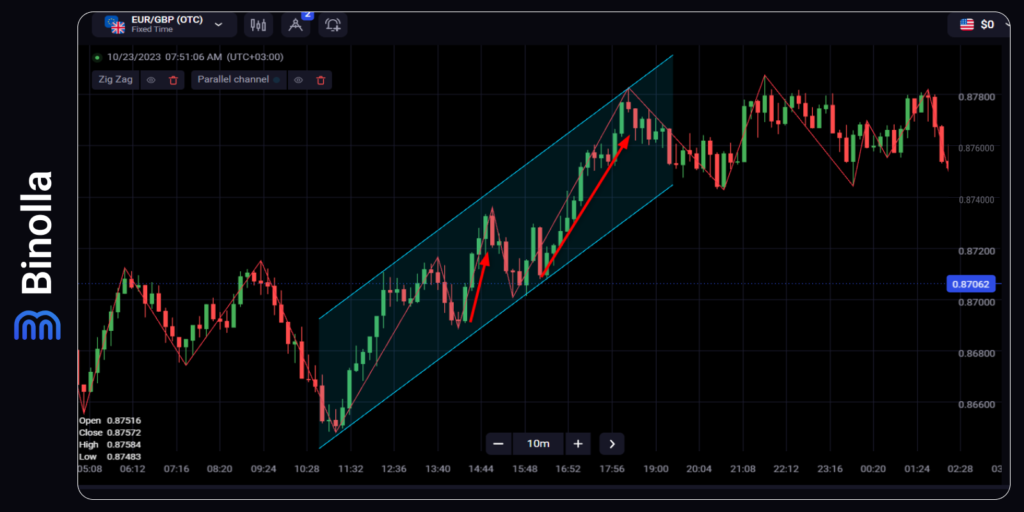
The example above shows how to trade the Zigzag indicator with an ascending channel in your trading routine. First, after you have drawn a channel, you should wait for the swings to appear. Once the price hits the lower side of the channel, you can buy a HIgher contract or buy a currency pair/stock.
For digital options traders, there is no need to seek exit points, as they simply need to wait for the contract expiration moment. Forex or stock traders can go further and use this tool to add new positions during the following swings and exit the market when the price makes a breakout of this channel and changes the trend. In our particular case, this happens when the price goes sideways.
Zigzag Indicator with Descending Channel
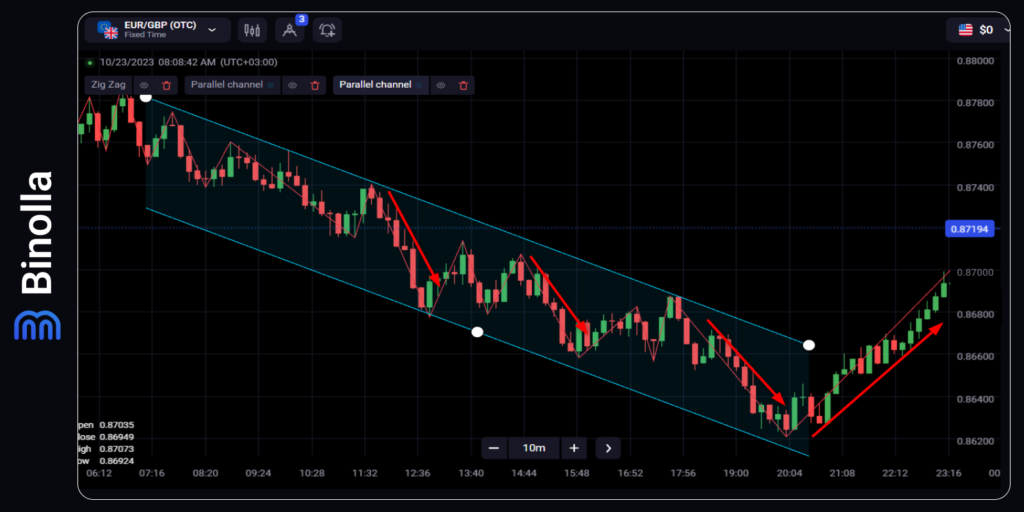
Another example of using this strategy is when the price moves downward. You can see that we have built the same old price channel, but this time it goes down. The upper swings can be used to find entry points for digital options traders or those who use Forex currencies or stocks to trade.
You can buy a Lower contract when the price rejects the upper band of the channel and a Zigzag swing appears. Forex or stock traders can simply sell a currency pair. To find exit points, you can use the channel as well. Simply find the moment when the price makes an upward breakout of the higher channel line together with the Zigzag indicator.
How to Trade Zigzag Indicator with Bollinger Bands
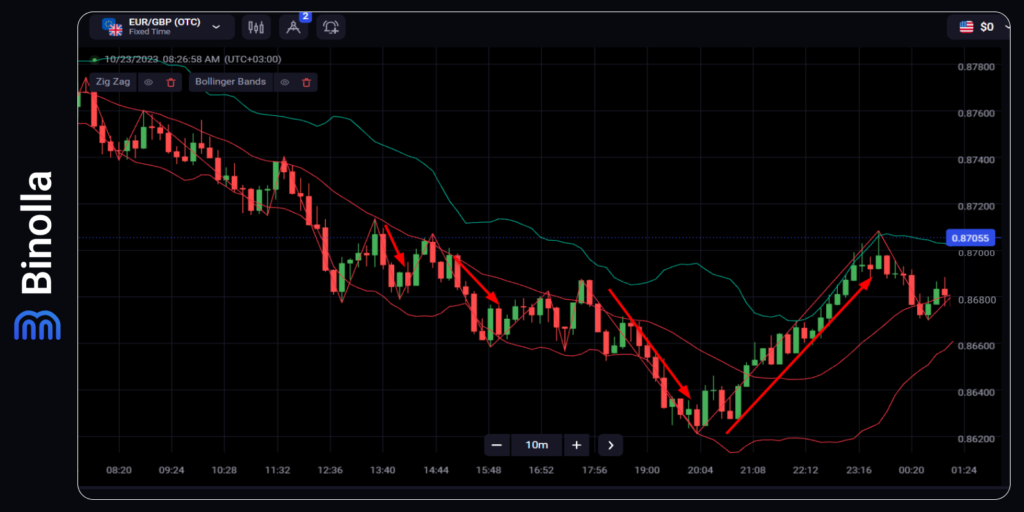
You can use various indicator combinations as well. For instance, Zigzag works well together with Bollinger Bands. In our example, we have flagged a couple of entry points that you can use to buy Lower or Higher contracts when trading digital options or simply sell and buy FX assets or stocks.
When the price rejects the middle line from below and Zigzag draws a swing, you can buy a Lower digital options contract. For FX or stock traders, this is a good opportunity to sell assets. On the other hand, another signal comes when the price rejects the lower band of the BB indicator and moves higher. We have another Zigzag swing here, which means that an opportunity to buy a Higher contract or a currency pair/stock appears.
Two Zigzag Indicators with Different Periods
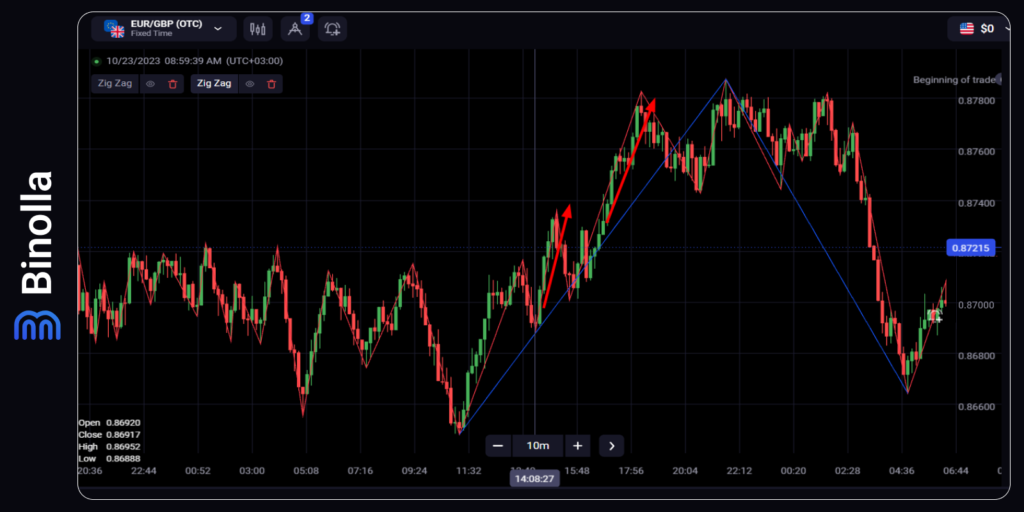
An interesting idea is to apply two Zigzag indicators with different depths. For instance, in the example above, we have added one Zigzag with a depth of 5 and another with a depth of 36. The latter shows a major trend, while the first allows you to find some interim swings. However, keep in mind that the blue line of Zigzag with higher depth appears only after a new major swing is in place.
How to Trade Zigzag Indicator with Patterns
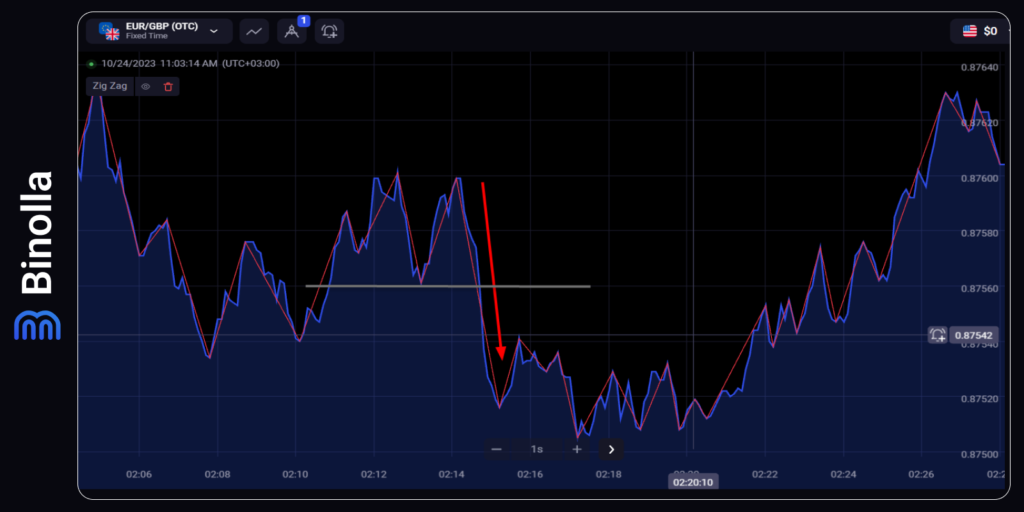
If you are using a line chart for trading, there is good news for you. The Zigzag indicator can be used to identify price patterns. For instance, in the example above, you can see a double-top model, which normally predicts the possibility of a further downtrend.
Digital options traders can simply buy a Lower contract when the price breaks the neckline (a grey line on the screenshot above) and wait for the expiration to come. As for Forex traders or those who buy/sell stocks, they can sell assets once the neckline is broken by the price.
Stop losses can be placed right above the neckline at the distance that you find appropriate. As for profits, you can take the distance between the last top and the neckline and apply it to your possible earnings calculations.
Non-Repaint Zigzag Indicator
One of the biggest problems with this indicator is that sometimes it repaints the readings. You may see a line that makes a swing above or below, but in the next moment, a new swing appears. This is due to the nature of this technical analysis tool. Moreover, whatever best settings for the Zigzag indicator you try to apply, you will still have the same problem.
There are plenty of variations of Zigzag over the Internet, and none of them provide you with pure signals. This doesn’t mean that the technical analysis tool is completely useless. You can apply it to a variety of strategies, even ones you create yourself. The idea is that the indicator should better be used with other indicators or technical analysis methods.
Keep in mind that you can’t change the nature of Zigzag unless you have an idea of how to do it and enough skills in programming. However, you can still improve the signals coming from them by filtering those entry points using a variety of additional technical analysis tools.
Zigzag Indicator Recommendations
When using Zigzag, you can stick to some general recommendations:
- Use a longer lookback period to reduce the number of zigzags and focus on the major trends. A shorter lookback period can produce more zigzags and noise, making it harder to identify the true direction of the market;
- Combine the zigzag indicator with other technical indicators or tools, such as moving averages, trend lines, oscillators, or volume, to confirm the signals and increase the reliability of the analysis;
- Use the zigzag indicator to draw Fibonacci retracements and extensions on the price chart, as the zigzag points can mark the significant highs and lows that are used to calculate the Fibonacci ratios. These ratios can indicate potential support and resistance levels, as well as target prices for trades;
- Be aware of the limitations of the zigzag indicator, such as its lagging nature, its inability to predict future price movements, and its sensitivity to the chosen parameters. The zigzag indicator should not be used as a standalone trading system but rather as a complementary tool that can enhance the understanding of the market structure and dynamics.
ZigZag Fore Indicator Pros and Cons
Some of the pros of using the zigzag indicator are:
- It can filter out minor price fluctuations and noise, making it easier to see the overall trend and significant reversals;
- It can help traders identify support and resistance levels, as well as chart patterns such as triangles, head and shoulders, double tops and bottoms, etc.;
- It can help traders measure the length and duration of price swings, which can be useful for determining entry and exit points, as well as setting stop-loss and take-profit orders.
Some of the cons of using the zigzag indicator are:
- It is a lagging indicator, meaning that it only shows past price movements and does not predict future ones. Therefore, it can give false signals or miss some opportunities in fast-moving markets;
- It is not a standalone indicator, meaning that it should be used in conjunction with other tools and indicators, such as volume, momentum, trend lines, etc.;
- It is subjective and sensitive to the chosen parameters, meaning that different traders may use different settings and get different results. Therefore, it requires careful testing and optimization to find the optimal value for each market and time frame.
Conclusion
The zigzag indicator is a technical analysis tool that can help traders identify the direction and magnitude of price movements. It can also help filter out market noise and highlight significant trends and reversals. It draws a line that connects the highs and lows of the price, forming a zigzag pattern. The indicator can be customized by setting the percentage or point change that defines a new high or low.
FAQ

What is the zigzag indicator and how does it work?
The zigzag indicator is a line that connects the highs and lows of price movements on a chart. It filters out minor fluctuations and shows only significant changes in price direction. The zigzag indicator works by applying a percentage deviation to the price data. For example, if the percentage deviation (depth) is set to 5%, then the zigzag indicator will only draw a new line when the price moves more than 5% from the previous high or low.
How can traders use the zigzag indicator?
The zigzag indicator can help traders identify the trend, support, and resistance levels, swing highs and lows, chart patterns, and Fibonacci retracements and extensions. The zigzag indicator can also help traders measure the length and duration of price movements, which can be useful for determining entry and exit points, stop-loss levels, and risk-reward ratios.
What are the advantages and disadvantages of the zigzag indicator?
The advantages of the zigzag indicator are that it can simplify the price action, eliminate noise, and highlight important price reversals. The disadvantages of the zigzag indicator are that it is a lagging indicator, meaning that it does not predict future price movements, but only confirms them after they have occurred. The zigzag indicator can also be repainted, meaning that it can change its shape as new data arrives, which can lead to false signals and confusion.
How can traders adjust the settings of the zigzag indicator?
The settings of the zigzag indicator depend on the type of data and the trading style of the user. The most common setting is the percentage deviation, which determines how much the price has to move before a new line is drawn. A higher percentage deviation will result in fewer lines and a smoother zigzag, while a lower percentage deviation will result in more lines and a choppier zigzag. Traders can experiment with different percentage deviations to find the optimal balance between sensitivity and reliability. Some versions of the zigzag indicator also allow users to choose between high-low and close-close modes, which use either the high and low prices or the closing prices of each period to calculate the zigzag.

