Will the US Inflation Data Push the US Dollar Lower?

The key data release from the United States this week will be the yearly CPI which will be released on Wednesday. Economists expect the US inflation to slow down from 2.9% in July to 2.6% in August.
The PPI data will also be in focus this week. Core monthly PPI is expected to rise in August by 0.2%, while monthly PPI is likely to add 0.1% for the same period.
The EUR/USD currency pair remains under pressure as the asset stays below the SMA50.
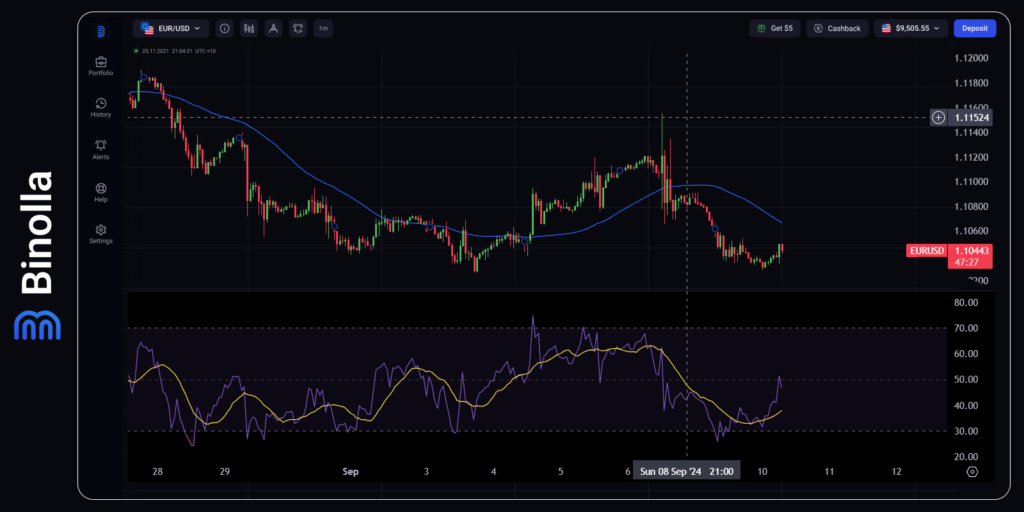
The currency pair seems to have some potential for the upward as the RSI indicator has left its oversold area and currently moves upwards. On the upside, the closest resistance level is 1.1050, which was already tested today. However, this level is still below the SMA50, which means that the currency pair develops a downtrend. The situation will change when EUR/USD manages to jump over the SMA50 and start using it as a support. On the downside, 1.1030 prevents the currency pair from moving lower. However, the current RSI position hints at the probability of EUR/USD moving higher.
Contents
GBP/USD Remains under the Pressure Ahead of the UK GDP Data
While the UK monthly GDP is expected to demonstrate a 0.2% growth as compared to previous data, GBP/USD remains under pressure. Friday’s CPI data from the United States may shed light on what the Fed is going to do in September and the rest of the year.
When it comes to the technical analysis, GBP/USD remains below the SMA50, which means that the general trend on the hourly chart is downside. The currency pair attempts to test this dynamic resistance level currently. If it manages to move above, the trend may change providing traders with buying opportunities.
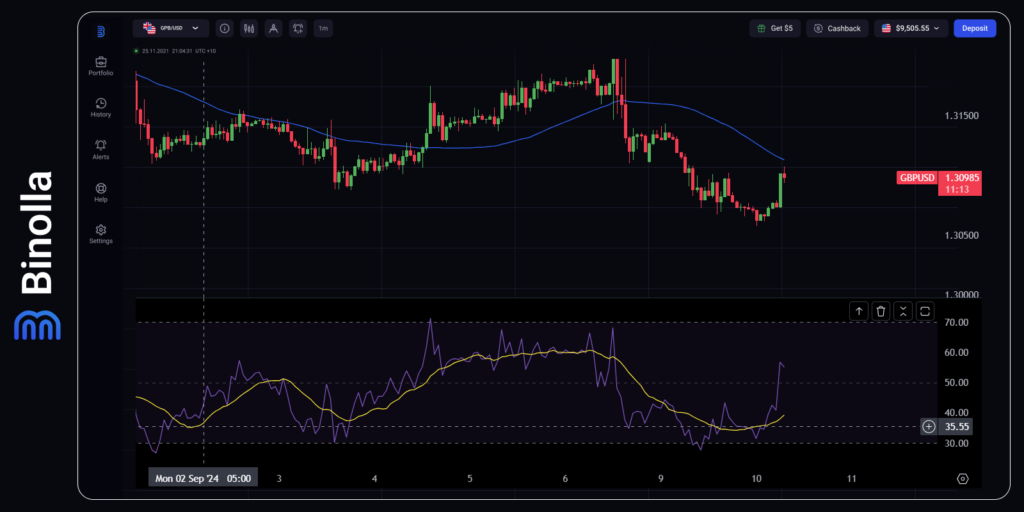
The closest resistance level is 1.3100, which is a psychological round number. On the downside, traders can focus on 1.3060, which is the closest support level. The RSI indicator has left the oversold area and moved higher. The average line (yellow) suggests that the local uptrend may take place, but the fact that the currency pair is below SMA50 limits the upside.
AUD/USD is Neutral as No News from Australia Is Expected This Week
AUD/USD ranges as there is no important news from Australia today. The currency pair stays below the SMA50, but there are chances that it is going to break this dynamic resistance without any significant momentum.
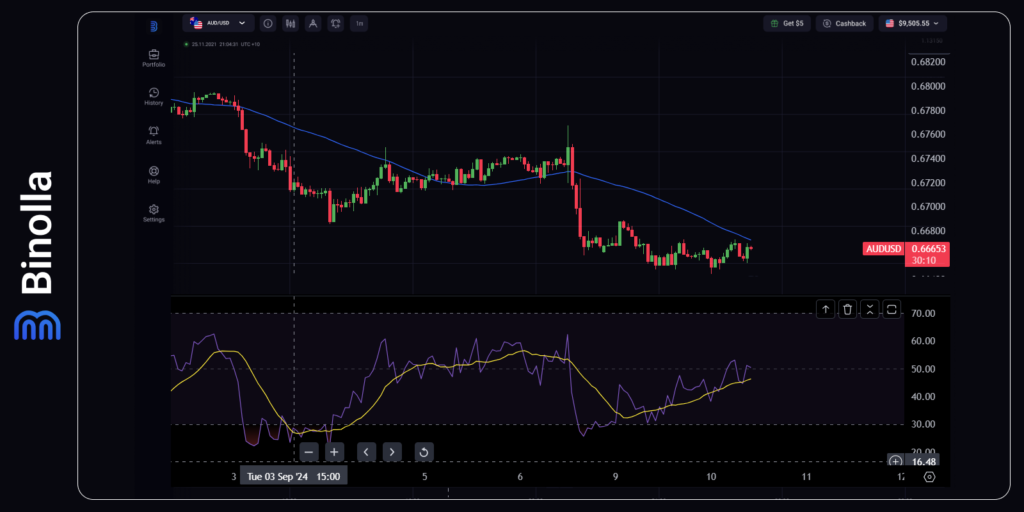
The closest resistance level is 0.6670, which prevents the currency pair from moving higher and reaching 0.6700. This resistance resides close to the SMA50, which means that if the currency pair manages to move higher, the trend will change.
On the downside, 0.6650 acts as the closest support level. The RSI indicator is pointing up after leaving the oversold area several periods ago. The yellow average line looks upwards as well.
USD/CAD Stands Still Ahead of the US Inflation Data
The currency pair has no clear direction due to the lack of news from Canada this week. Market participants are anticipating the US CPI data y/y to choose the further direction. While the BoC is considering at least one rate cut this year, the Fed plans to ease its monetary policy as well, which makes it confusing for market participants to choose the direction.
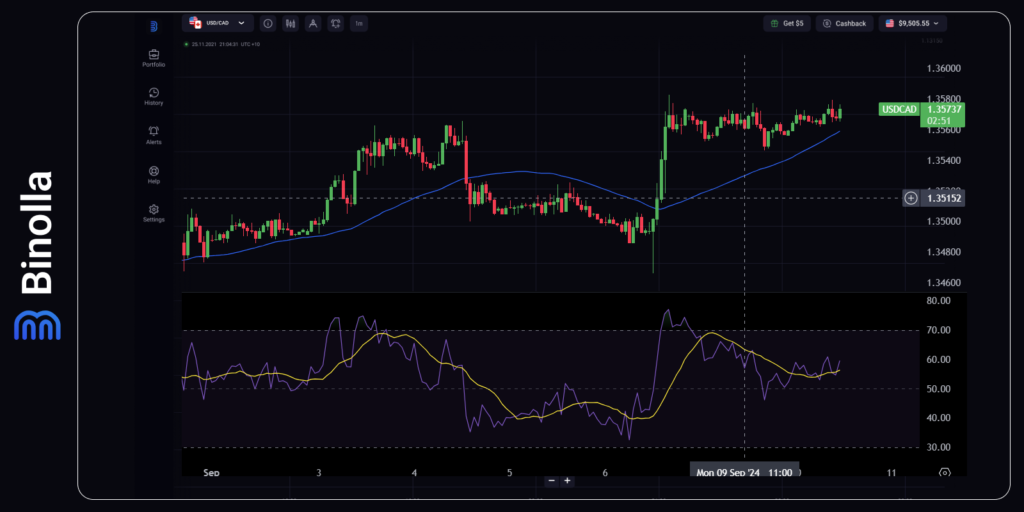
When it comes to the hourly chart, USD/CAD stays above the SMA50 as the uptrend is developing. However, later sideways movement suggests that the currency pair is likely to test the moving average in the near future and even move below it, especially if the US inflation data will meet the forecasts or be even below it.
The RSI indicator follows its downside direction after leaving the overbought area. All this indicates the probability of a downtrend if USD/CAD manages to break below the SMA50. The closest resistance level is at 1.3570, As for the targets below, the closest one resides at 1.3550.
Gold Is Trading Sideways on the Eve of the US Inflation Data
Traders and investors are in doubt about the future of XAU/USD price as the situation with the next Fed decisions is still unclear. Gold is still close to its all-time highs, but currently, it moves close to the SMA50 without a clear direction.
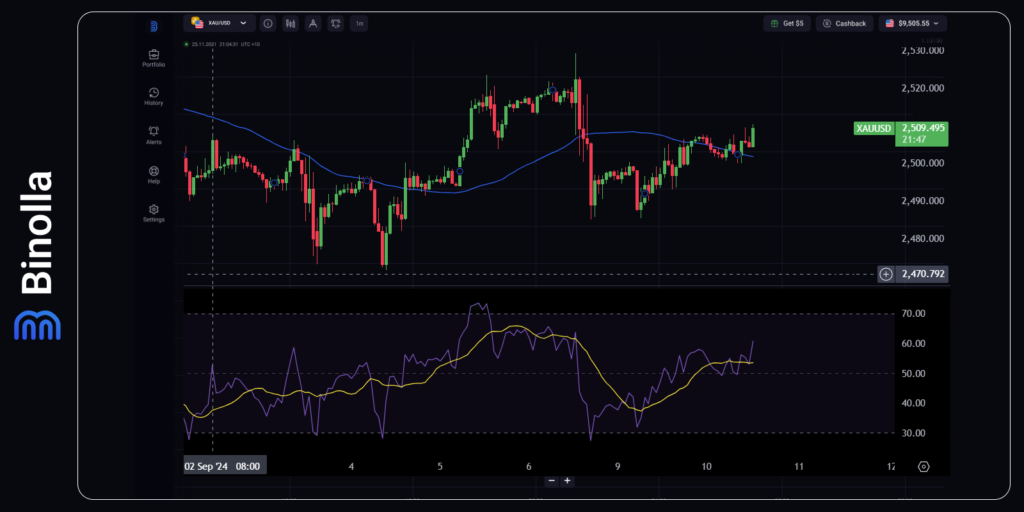
The RSI is also sideways, meaning that the market participants are looking for signals before opening long or short positions.


