Weekly Technical Market Review: EUR/USD Struggles to Recover, While Bitcoin Enters a Consolidation Area

EUR/USD extended its downward trajectory for the sixth consecutive session on Tuesday, holding near 1.0620 during the Asian trading session. The persistent strength of the US Dollar (USD) weighed on the EUR/USD pair, potentially fueled by rising US Treasury yields. Moreover, robust Retail Sales figures from the US surpassed expectations, heightening speculation that the Federal Reserve (Fed) may maintain its hawkish stance on interest rates.
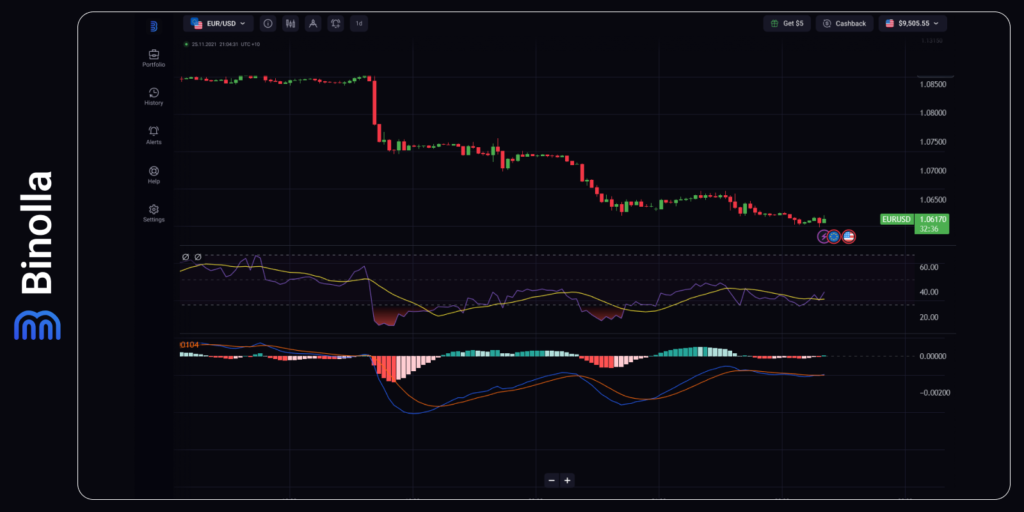
From a technical standpoint, analysis indicates a bearish outlook for the EUR/USD pair. The 14 Relative Strength Index (RSI) is positioned below the 50 mark, signaling bearish momentum. Furthermore, the Moving Average Convergence Divergence (MACD) indicator is below the centerline and exhibits a divergence below the signal line, indicating weakness in the pair’s performance.
Immediate support for the EUR/USD pair is anticipated around the psychological level of 1.0600. A breach of this level could exert downward pressure on the pair, potentially leading it towards the area around the key level of 1.0550, followed by November’s low at 1.0516.
Contents
GBP/USD Dives Deeper as Bulls Lose Confidence
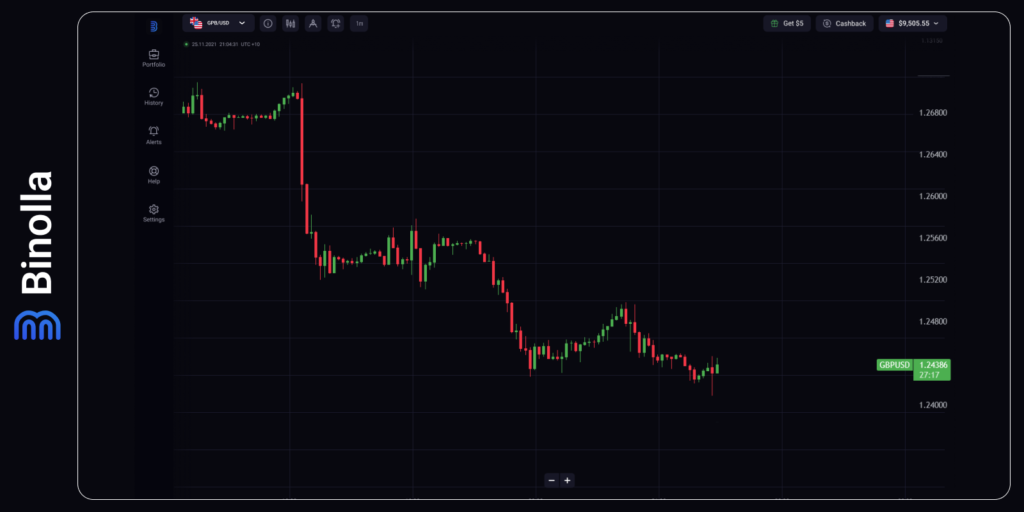
The GBP/USD pair extends its decline for the third consecutive day on Tuesday, marking the fourth negative session out of the previous five. During the Asian session, it reaches its lowest level since November 17, currently hovering around the 1.2420 region. Traders are now awaiting the release of the UK monthly employment data for potential market direction.
Analysts expect the number of people claiming unemployment-related benefits to increase to 17.2K from the previous 16.8K, while the jobless rate is projected to edge higher from 3.9% to 4% for the three months ending in March. Such data could indicate a cooling job market, reinforcing expectations for at least four rate cuts by the Bank of England (BoE) this year, with the first anticipated in June. This outlook is likely to weigh on the British Pound (GBP) and exert downward pressure on the GBP/USD pair.
The pair has been pressured by bears, driving it towards the lower boundary of the monthly descending channel, currently testing around 1.2440. Below this level lies last Friday’s low at 1.2430, with a decisive breach of this support area potentially paving the way towards 1.2370. Further downside movement could encounter limited support until reaching 1.2220.
Conversely, on the upside, clearing the 1.2505 level is crucial for advancing towards 1.2565. This level coincides with an unbroken order block, presenting a potential barrier and renewed opportunity for bearish momentum.
USD/CAD Develops Its Upside Momentum
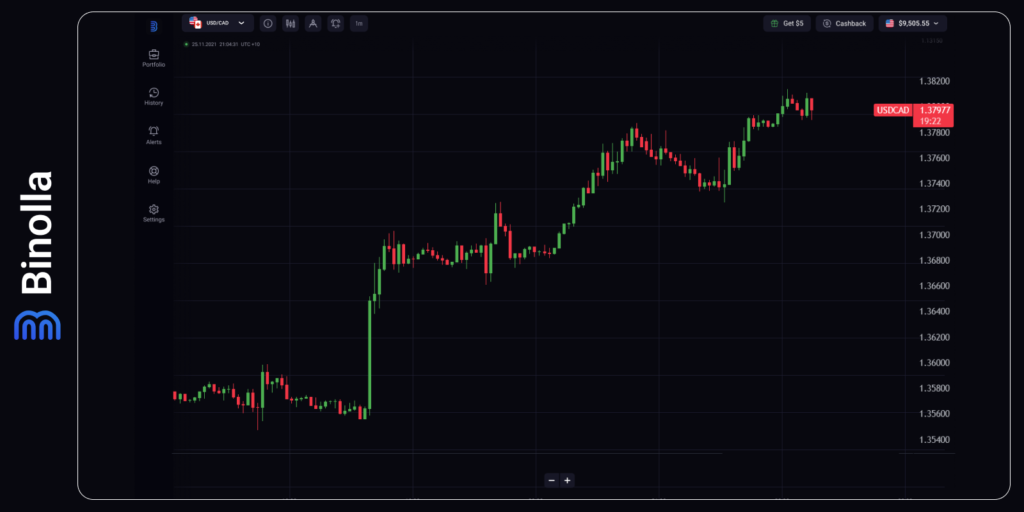
Continuing its breakout momentum from last week, the USD/CAD pair extended gains for the fifth consecutive day on Tuesday. Climbing above the 1.3600-1.3610 supply zone, spot prices reach the 1.3815 region during the Asian session, marking the highest level since November 14. The ongoing bullish sentiment surrounding the US Dollar provides strong support for the pair.
The USD Index (DXY), reflecting the performance of the Greenback against a basket of currencies, surged to its highest level in over five months amidst expectations of the Federal Reserve (Fed) postponing interest rate cuts due to persistent inflationary pressures. Additionally, robust US Retail Sales data released on Monday suggests resilient consumer spending, fueling concerns about inflation and potentially prolonging the Fed’s stance on maintaining higher interest rates. This hawkish sentiment continues to support elevated US Treasury bond yields, bolstering the US Dollar.
Moreover, a general risk-off sentiment prevailing in equity markets, exacerbated by ongoing geopolitical tensions, reinforces the appeal of the safe-haven US Dollar, thus providing further support to the USD/CAD pair. Heightened tensions in the Middle East following Iran’s weekend missile and drone attack, with Israel vowing to retaliate, contribute to the geopolitical uncertainties. This backdrop aids in boosting Crude Oil prices, which could limit the upside potential of the commodity-linked Canadian Dollar and restrain gains in the USD/CAD pair.
Gold Has a Limited Downside Potential
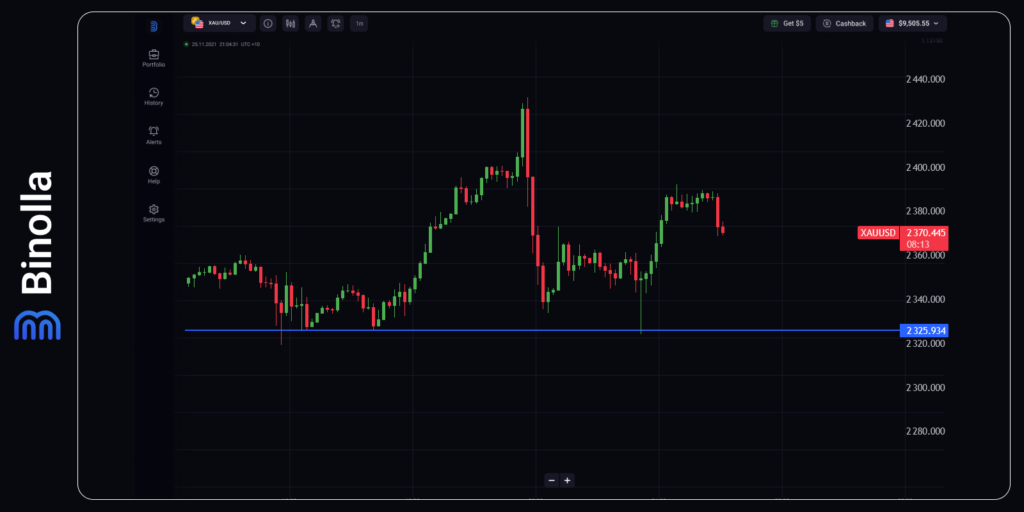
During the early European session on Tuesday, the price of gold (XAU/USD) saw a slight decline, retracing a portion of the overnight gains from its recent multi-day low in the $2,325-2,324 range. This dip is attributed to ongoing USD strength, fueled by expectations that the Federal Reserve (Fed) will maintain higher interest rates due to persistent inflation and a robust US economy. Despite this pressure on the USD-denominated commodity, a significant corrective downturn appears unlikely.
Investor sentiment remains cautious amid geopolitical tensions in the Middle East, reflecting in a subdued tone across equity markets. Additionally, speculation of potential interest rate cuts by major central banks later in the year may serve to cushion the downside for gold, given its status as a non-yielding asset. Attention is now turned towards US macroeconomic data releases and speeches by influential FOMC members, particularly Fed Chair Jerome Powell, for fresh insights that could drive movements in XAU/USD.
From a technical standpoint, the recent bounce reaffirmed the significance of the $2,325-2,324 support zone, now a crucial pivot level. A decisive breach below this level could potentially drive gold prices down to the psychological $2,300 mark. Further downward momentum would indicate a short-term peak for the precious metal, possibly leading to a more substantial decline towards the $2,220 zone, with interim support likely around $2,250.
Conversely, bullish investors may seek confirmation with a breakout above the $2,400 threshold before considering fresh positions, eyeing a return to test the recent record high near $2,431-2,432 recorded last Friday. However, considering the Relative Strength Index (RSI) signaling overbought conditions on the daily chart, gold prices might encounter resistance around the all-time peak before resuming the upward trend established over the past three weeks or so.
Bitcoin: A Short-Term Downtrend is Developing
The Bitcoin market is currently displaying a bearish trend on shorter timeframes, as indicated by several technical indicators signaling a downward trajectory.
Both the Moving Average Convergence Divergence (MACD) and the Awesome Oscillator (AO) are registering negative readings, indicating that the short-term bearish sentiment might persist, with the potential for further decline.
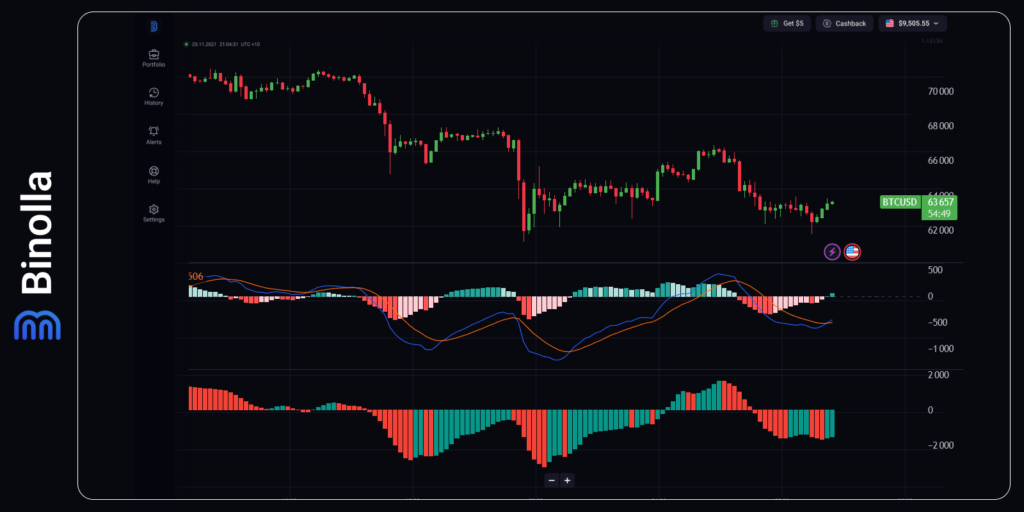
Should Bitcoin lose support from its ascending trendline, there’s a possibility of a decline to around $63,000, with an even more significant drop potentially revisiting the psychological level of $60,000.


