Trading Indicators and Signals Basics for Beginners

Indicator-based trading is a special method that is based on technical analysis tools to follow trends or find market reversals. Signals, in turn, are entry points that traders receive from various providers. By signals, we also mean entry points that a strategy gives to traders. By reading this article, you will find out more about both and learn about their pros and cons. Start trading with Binolla by creating an account on the platform!
Check the most popular questions and answers to them before delving deeper into technical indicators and signals.
Contents
- 1 FAQ
- 2 Indicator-Based Trading Explained
- 3 How Indicator-Based Trading Looks Like
- 4 Types of Strategies that Are Based on Indicators
- 5 The Pros and Cons of Using Indicators
- 6 Try these indicators on the Binolla platform!
- 7 Trading Signals
- 8 The Magic Behind Trading Signals
- 9 Should I Use Trading Signals?
- 10 A Strategy or a Signal?
- 11 Conclusion
FAQ

Are Trading Signals Worth It?
It depends on your own approach. You can use trading signals, but keep in mind that not all of them are reliable enough.
Where Do Traders Get Signals?
Normally, traders get signals from brokerage companies, and this is the best solution for those signals to be trustworthy and checked by professionals. Third-party signals, in turn, are not reliable and are far from trustworthy.
Can I Get 100% Accurate Signals?
Unfortunately, there are no 100% accurate signals. The best way to use them is to combine signals with your own strategy. If both give you the same entry point, you can engage in trading with higher chances.
How Do You Use Indicators in Trading?
You can use them to create your own strategies. The latter may include one or several indicators to increase the chances of making money.
Now that you know answers to some of the most popular questions, you can read the full article.
Indicator-Based Trading Explained
A technical indicator is a special analysis tool that uses historical price data and visualizes it to provide traders with information about the current trend or market reversal. When you use a particular chart indicator, you employ technical analysis in your trading routine. Applying technical analysis allows traders to research and systematize the information from charts instead of watching chaotic price fluctuations on naked charts.
How Indicator-Based Trading Looks Like
Each technical indicator has a special mathematical formula behind it. This formula, in turn, includes various price inputs that are calculated and then visualized on charts. This visualization provides you with more information about the average price for a particular period or even gives you an idea about whether a particular asset, be it a stock, currency, cryptocurrency, or commodity, is oversold or overbought.
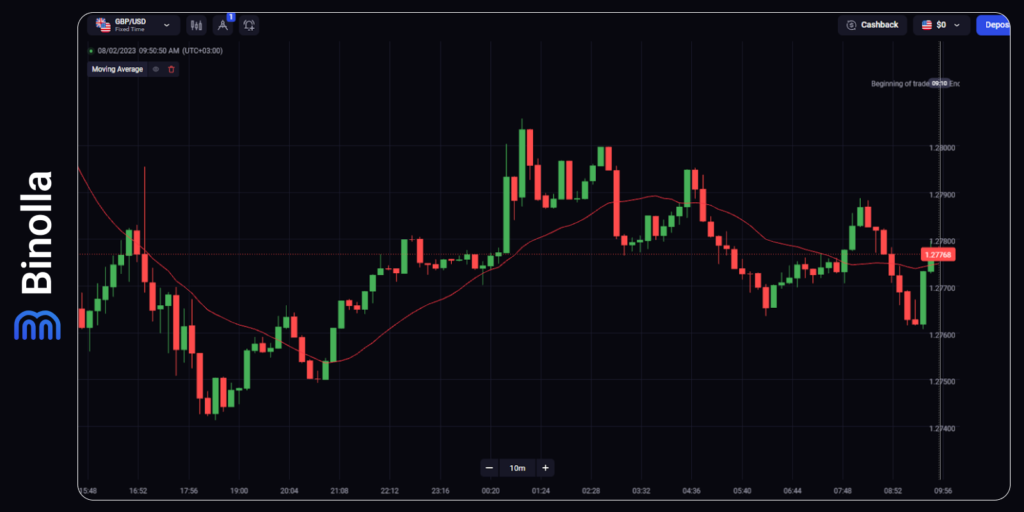
The example above shows how a moving average indicator can change the view about the current price. When the line of this technical indicator goes upwards, you can assume that the uptrend is developing, while when it goes down, the downtrend is dominating.
When you use a moving average, each new point in the line is calculated as the average price for a particular period. In our example, we have set it to 20. Therefore, considering the fact that we are using a 10m timeframe, the indicator includes 20 past candlesticks and covers the past 200 minutes.
While this indicator does not show you where to buy a particular digital option or buy/sell a currency pair, stock, or commodity, it allows you to have an armed view of the chart and proceed with other strategies to find where it is better to buy a particular asset.
Types of Strategies that Are Based on Indicators
You can find a lot of indicators on the Binolla Platform that can be used in an even greater combination of strategies. However, most trading tactics can be classified into a particular group. There are four main groups of trading strategies that you can apply in your day-to-day trading routine.
Crossovers
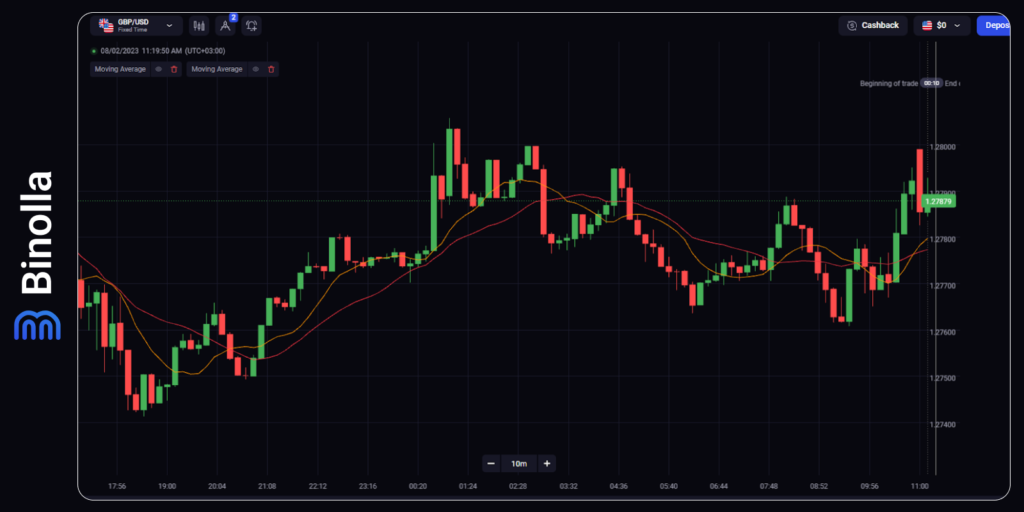
One of the basic crossover strategies is MA crossover, which involves two moving averages with different periods. In our example, we have applied moving averages with 10 and 20 periods. The idea behind this strategy is very simple. If the moving averages have a crossover below the price, traders can consider buying a Higher contract or placing a buy order. On the other hand, if the crossover is above the price and both moving averages are going down, this is a signal to sell or buy a Lower contract.
Breakouts
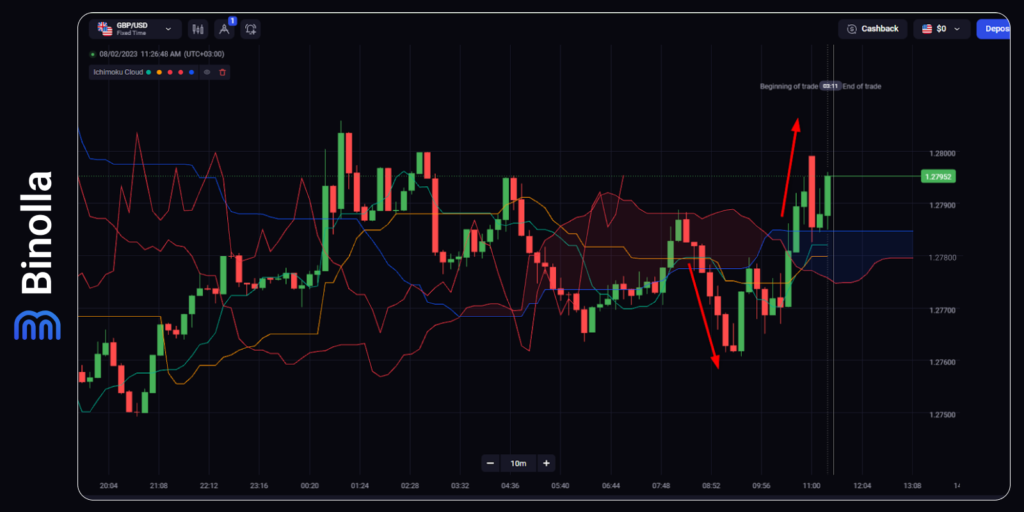
Ichimoku is an all-in-one indicator that allows you to follow trends and find price reversals. The main part of it is a cloud, which allows you to build a lot of interesting strategies around it. In particular, you can use it to find breakouts. The idea is very simple. If the price breaks the lower line of the cloud, you can buy a Lower contract or sell an asset, while after crossing the higher border of the cloud, traders can buy Higher contracts or buy an asset.
Swing Strategies
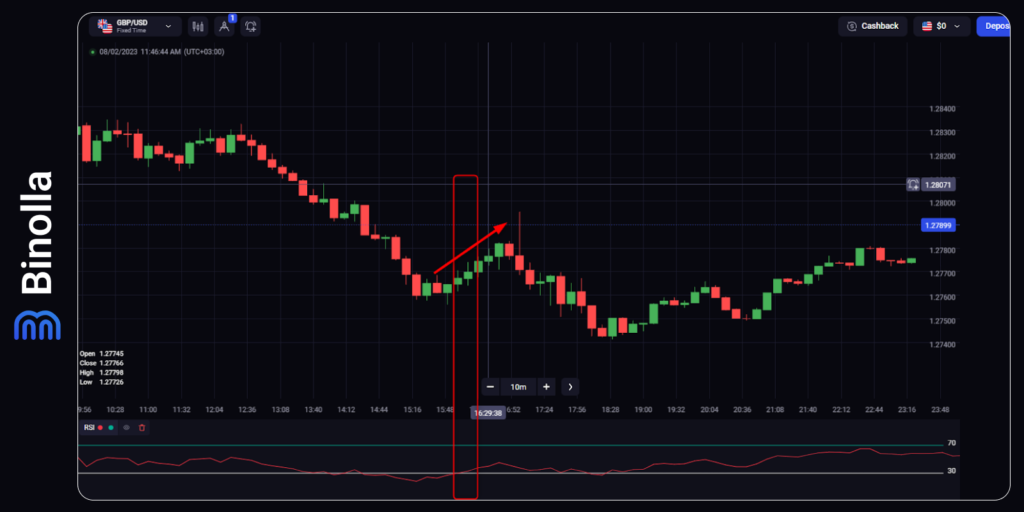
When it comes to swing strategies, you can apply most momentum indicators. In the example above, we used RSI to find the overbought and oversold areas. Once the indicator goes above 30, this is a strong reversal signal, which allows you to buy a Higher contract or an asset.
Trend-Following Strategies
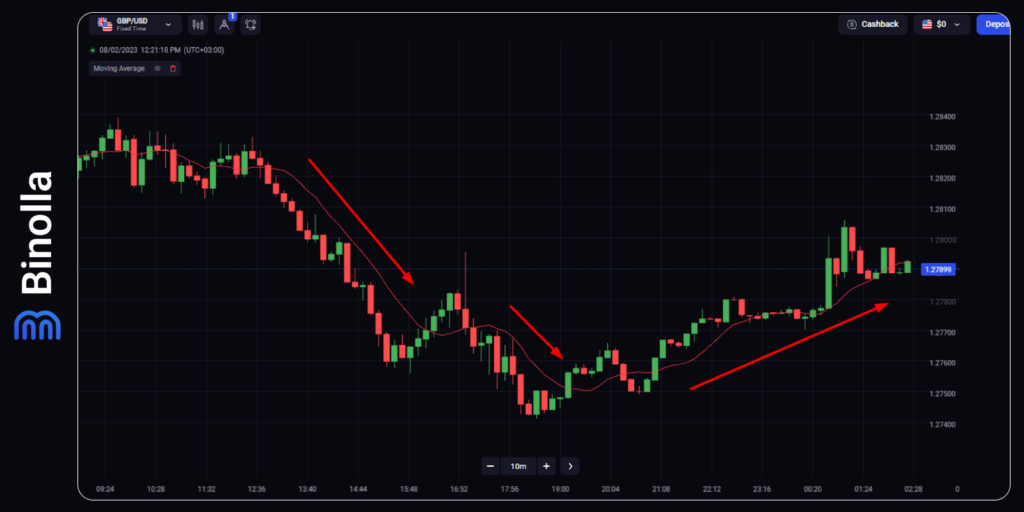
Let’s go back to a 10-period moving average again and watch what we can squeeze out of it. While it may seem like a very basic chart with a dynamic line on it, the moving average indicator is a strong tool that allows you to define market trends. Moreover, if you are using trendlines, you can see a lot of similarities between the drawing tool and the indicator.
The truth is that a moving average is the same as a trendline, with the sole difference being that the first is calculated by a special averaging formula, while the latter appears when you move the mouse or your finger (when it comes to the mobile version of the platform). Moreover, a moving average may have an advantage for those “lazy” traders, as you don’t need to rebuild it all the time. When a trend ends, the moving average indicator stays horizontal, while during the trend period, it goes upwards or downwards depending on the price movement direction.
The Pros and Cons of Using Indicators
Technical indicators are nothing more than a way to display the average price or other price parameters that are calculated with a special formula. They have both advantages and disadvantages, which will be explained below.
Benefits of Using Technical Indicators
- Simple visualization. With technical indicators, you have a clear picture of what is going on with the price. Moreover, you can also watch the historical analysis and compare it to the current situation to make data-driven decisions;
- No puzzling. By applying a particular indicator, you can see simplified price movements that are easier to interpret than complex price fluctuations from the chart;
- Trading strategies are bricks. Indicators are the “construction materials” for a lot of strategies. Moreover, they can be used in combinations that allow traders to build a lot more tactics and use them in various situations.
Cons of Using Technical Indicators
- Trend-following technical indicators are lagging. If you look at a moving average, for instance, you will see that there is a gap between this indicator and the current price. Therefore, when the reversal occurs, trend-following indicators will still show the trend movement for a while;
- There are no golden rules for periods. There is no period that can be considered the best for a particular indicator. You should always spend some time trying to set your own period that will go in confluence with your trading strategy goals.
Trading Signals
Trading signals are very popular nowadays as they provide traders with ready-made entry points and, thus, make them work less on researching charts and allow them to focus on strategic aspects of their trading routine.
While using trading signals may seem like a kind of Holy Grail, the reality is far from being so bright, as most of those signals that you will find on the Internet are fake or ineffective. To learn more about trading signals and whether to apply them or not, read the next part of this article.
The Magic Behind Trading Signals

For most beginner traders, those signals are a kind of miracle or magic. However, the reality is that those signals are nothing more than the work of indicators that are brought together to provide entry points.
The idea behind trading signals is very simple. You receive one that tells you either to buy or sell (or to buy a Higher or Lower digital contract). That’s it. You simply need to follow the signal and complete a transaction by investing a part of your trading balance.
While it seems like a piece of cake, when you start trading with those signals, you will see that their profitability is low in most cases. This is due to the fact that market conditions are constantly changing, and those algorithms are unable to recognize those moments when a trend switches to a flat and vice versa.
Moreover, a lot, if not everything, depends on an indicator or a set of technical analysis tools that are used behind those signals.
Should I Use Trading Signals?
Using trading signals depends on your personal preferences. They may be useful at some point, but you should make sure that they are provided by a reputable company. Brokers’ signals are always more reliable as they are provided by professionals. Third-party signals are less reliable for the following reasons:
- You don’t know the company that stays behind those signals. In most cases, they are provided on dubious websites with no history or background. Keep in mind that receiving trading signals from those sites is at your own risk;
- You know nothing about the strategy that they use. When you are using signals from brokers, you can expect the whole team of traders to work on those systems. It’s totally different when you pick third-party providers, as you can’t be sure they use reliable strategies. Moreover, you can’t even look at those strategies, as they are always top secret. Therefore, using signals from third-party providers often makes it like going through the minefield without any appropriate tools to locate the position of mines;
- Those signals are not free in most cases. While brokers may also charge traders fees for using trading signals, those tariffs are affordable in most cases. Third-party providers make money on providing such services, and even if you find a reliable one, you will have to pay a lot more as compared to brokerage firms.
- You can’t be sure that those signals are controlled by anyone. When applying for brokers’ signals, you can expect the company to check and recheck them. However, you can’t say the same about third-party signals that are automated in most cases without proper guidance.
After what you have read above, you may still have a question about whether to use trading signals or not. Keep in mind that those signals are not a cure-all method that will make you rich on a whim. They may be useful if you do your own market research.
Those who want to try trading with signals can follow a couple of recommendations. First, try to avoid third-party signals from unreliable and unverified sources. Second, it is recommended for traders to get signal confirmation. To do that, you can simply use your strategy. If both a signal system and a strategy give the same signal, you can buy a digital option or buy/sell any other asset. If not, you can look for other, stronger signals.
A Strategy or a Signal?
Now that you know more about indicator-based trading and signals, it is time to make a kind of summary about whether to use signals or your own strategies.
| Strategies | Signals |
| You rely on your own research and make your own trading decisions | You rely on someone else’s research and can’t be 100% sure that the results are appropriate |
| You know all the technical analysis tools that you add to your strategy and each one is used for purpose | You don’t know anything about what is under the hood. |
| You need to do all the work on your own, from analysing markets to finding entry points | You don’t need to do anything at all. Signals are coming without any effort from you. The only thing that is required from you is to buy a contract or buy/sell an asset |
| You can switch between different trading systems when it is required by the situation on charts. For instance, if the price is trending, you can apply trend-following strategies, while in calm markets, you can apply a different kind of strategy, like trading within a range or looking for breakouts | You can’t switch between strategies, whatever happens, as long as you are receiving straight signals |
Conclusion
Trading indicators and signals are very popular nowadays. The first allows you to build your own strategy by using one or even several. Signals, in turn, are provided as they are, and you don’t even need to conduct any market research. However, both have their positive and negative sides and you need to weigh everything in order to choose between them.

