Top 8 Economic Events and Indicators to Watch When Trading in 2025
Economic events and indicators play a significant role as they have a direct impact on price fluctuations of different types of assets. From currencies to commodities and cryptocurrencies, whatever financial instrument you choose, knowing how the price and various economic data sets are interconnected, allows you to make more informed decisions. In this article, we will delve into the key events and macroeconomic indicators that traders can use to understand price fluctuations and predict future price movements.
Join Binolla now and use the information from this article to make successful trades!
Contents
1: Interest Rate Decision
The event number one in the world of trading and investing is the interest rate decision. Interest rates are set by central banks to regulate the volume of money in economics. When interest rates are higher, less money flows to the markets, and loans become less attractive, while bank deposits, in turn, are more attractive as you will get higher interest on your money.
For economies, higher interest rates may mean that business activity will slow down as companies can’t rely on cheaper loans. Moreover, consumers prefer to accumulate money and make savings instead of spending. Inflation is low, which is another factor that allows consumers to spend less as they are not pressured by expectations of higher prices and can make reasonable decisions.
Lower interest rates mean cheaper loans and more attractive money. This leads businesses to grow and consumers to be more active in spending. Bank deposits become less attractive, which is another reason why households become more active spenders.
How Do Interest Rates Impact Markets?
Higher interest rates support currencies issued by a central bank. For instance, if the ECB hikes rates, it will support the Euro against other currencies. However, when it comes to other types of assets, higher interest rates may have a different impact on them. For instance, higher interest rates will cut money inflow and will press on stocks and indices, which are likely to decrease.
When it comes to commodities, they are also unlikely to rise during periods of contractionary monetary policy due to the same reasons. Less money in the economy and higher loans will prevent investors and traders from expanding their portfolios.
Lower interest rates, in turn, stimulate traders and investors to buy more stocks, commodities, and other assets as they can rely on cheaper loans. Therefore, in times of expansionary monetary policy, one can expect stocks, indices, commodities, and even cryptocurrencies to grow.
How to use this information? When a central bank cuts interest rates, the currency plunges, while stocks, indices, and other assets may rise. On the other hand, when a central bank hikes rates, the currency is likely to surge, while stock markets and other assets are likely to plunge.
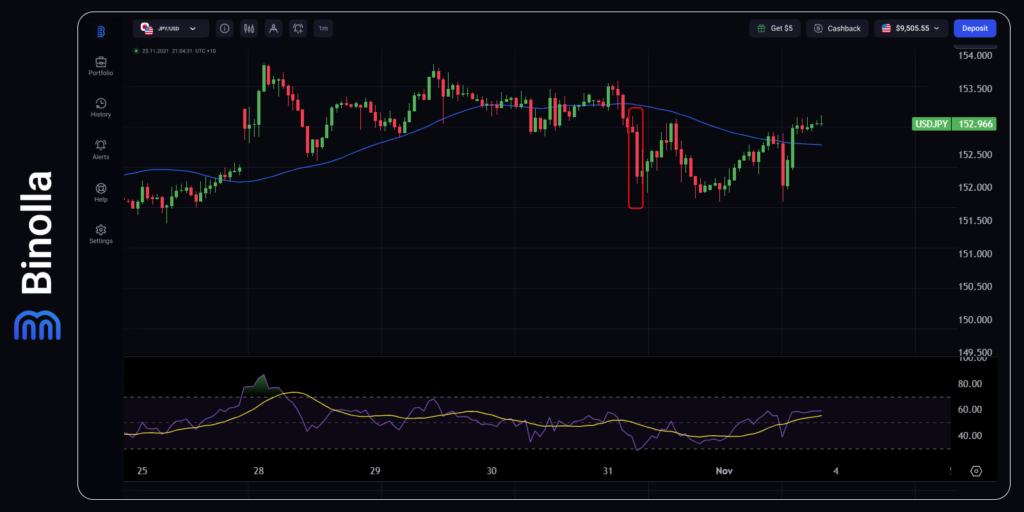
The recent BoJ decision about the interest rate supported the Japanese yen. While the Bank of Japan’s officials made no changes in the monetary policy, JPY moved higher, which can be seen on the chart. Traders and investors expect the Bank of Japan to raise interest rates in the near future, which was the main reason for the currency to grow.
2: Central Bank Officials’ Comments
The next important aspect that traders should consider when trading in the financial markets is how central bank officials comment on the current situation. Sometimes, they interfere with speeches to change the situation and impact currencies.
What is the idea behind these steps? Cheaper or more expensive currency influences economics directly. By making such speeches, central bankers try to impact financial markets without making any steps such as changing interest rates or launching quantitative easing. Verbal intervention is among the most popular tools that officials use to control currency prices.
How Does It Work?
Central bankers may give their comments during planned events or even give unexpected speeches about the currency if something extraordinary happens. For instance, a central banker may say that the currency is too expensive and they monitor the situation closely. This will be a signal to the market that if the currency remains expensive, then the central bank may cut rates, launch quantitative easing (QE), or conduct a single currency intervention in order to push it down.
On the other hand, if central bankers say that the currency is too cheap, which stimulates inflation to go beyond target levels then the market is given a clear signal, that the central bank may step in and support the currency by intervention or hiking interest rates. Comments can be direct and clear or even obscure. For example, a central banker may say that the economic growth is not enough, which means that the central bank is likely to be more stimulative and cut interest rates or launch QE.
When central bankers speak about expensive currency, market sentiment often switches from bullish to bearish, while when officials speak about a cheap currency, bulls often take control of the market. If verbal interventions are not effective enough, then central banks often conduct currency intervention.
3: Currency Intervention
This is a rare step that central banks make to stabilize their currencies in the market. When a central bank launches an intervention, it buys or sells its own currency in foreign exchange in order to guide the exchange rate. For instance, if a currency is too expensive which makes it less attractive for exporters, then the central bank is likely to start selling it in the forex in order to increase its supply, which pushes the currency down.
On the other hand, if a currency is too cheap, the central bank may use its foreign currency reserve to create artificial demand and buy its own currency. Another example of intervention is when the central bank sets a minimum exchange rate between its own and foreign currency. The Swiss National Bank conducted such an intervention from 2011 to 2015. The central bank set the minimum exchange rate of the Swiss franc to the Euro to prevent the national currency from strengthening too much. This step helped local exporters of goods that worked with European counterparts.
4: Quantitative Easing
Quantitative easing or QE is a step central banks take to buy securities in the markets in order to increase the money supply. This helps banks create new reserves and have access to more liquidity that they can use for lending and investment. Quantitative easing is normally announced by a central bank along with rate cuts. One of the major QEs was launched by the Bank of Japan in the 2010s and led to inflation growth. That helped Japan to leave the deflation zone, which prevented the local economy from growing.
Another example of quantitative easing is when the Fed started its purchase program in response to the global financial crisis of 2007-2008. Some economists believed that this step helped avoid harder consequences.
QE influences the currency rate as it provides more liquidity to the financial markets. Once launched, it creates an additional money supply, which pushes the currency rate down. Therefore, when traders hear that a central bank is going to launch a QE during the upcoming meeting, then they can expect the currency to plunge. Normally, this happens right at the moment when QE is announced (even before the meeting) and sometimes this announcement is used by central bankers as a part of verbal intervention as they can see how their comments and QE expectations will influence the market.
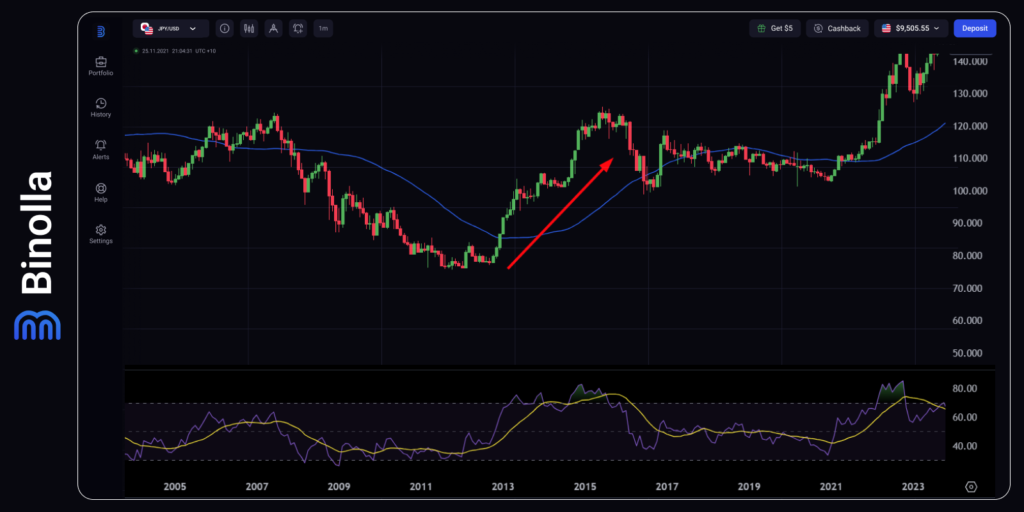
One of the side effects of quantitative easing is that QE may lead to bubbles in the financial markets. This is due to the fact that banks, large financial institutions, and investors may use additional liquidity to buy stocks and other securities. The value of such securities goes beyond their fundamental value, which creates bubbles. The main risk of this phenomenon is that a bubble may burst in the future and lead to a massive sell-off with unpredictable consequences.
5: Inflation Data
All central banks have mandates to maintain the inflation rate at a certain level. In most cases, it varies from 2% to 3%, which is considered a normal inflation rate for stable economic growth. If inflation is below 2%, a central bank may step in with an interest rate cut or even a QE in order to stimulate prices, while inflation above 3% may lead to higher interest rates.
Inflation data can be followed in economic calendars. Consumer price indices of different types reflect the price growth situation in a particular country. When CPI is beyond 2-3%, this may be a signal for traders and investors that a central bank may step in and launch contractionary monetary policy by hiking interest rates. A lower inflation rate (when CPI is below 2%) may indicate that a central bank is likely to cut rates or launch a QE round.
How to Use This Information in Trading?
Traders should follow CPIs in economic calendars and check forecasts. If the yearly inflation rate is above 2-3%, then the currency may surge as traders and investors will expect the central bank to step in. In the opposite situation, when yearly CPI is below 2%, traders and investors start selling the currency as they will expect the central bank to cut rates or launch the QE to stimulate inflation.
6: Labor Market Data
Speaking about economic growth it is worth mentioning labor market data as one of the indicators of economic health. The high unemployment rate tells traders and investors that economic activity is weak as companies tend to avoid creating new jobs. This often happens during economic stagnation or in times of recession.
Higher demand for labor force, in turn, demonstrates that companies tend to increase their activities and they believe in better economic conditions in the future that allow them to develop their businesses and create new jobs.
Central bankers check this data to make their monetary policy decisions as well. A higher unemployment rate, which is a bad signal pinpointing weak economic activity may stimulate the central bank to cut rates or launch the quantitative easing program. This, in turn, will push the currency down. Therefore, when checking unemployment data releases, you can expect a currency to plunge if the unemployment data is above forecasts.
On the other hand, a better situation in the labor market may be considered by markets as a signal that the central bank will make no additional steps to stimulate economic growth and, therefore, no interest rate cuts or QE will be launched. Normally, this supports the currency against its rivals. Moreover, in some cases, a better situation in the labor market allows the central bank to hike rates (if they need to fight inflation, for instance), which will provide additional support to the currency.
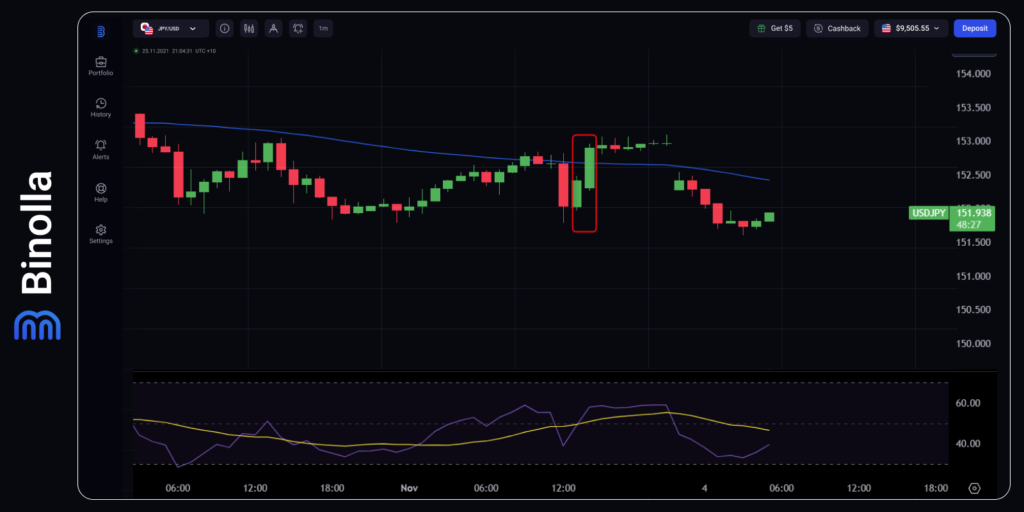
The chart above shows how the USD/JPY currency pair reacted to Friday’s labor market data that was released on November 1, 2024. The unemployment rate remained unchanged at 4.1%, which is a good sign for the US economy allowing the Fed to take time before the next rate cut. Therefore, such data release stimulates traders to buy USD against the yen.
7: Purchase Manager Index
This is an advanced indicator showing the business activity rate in the manufacturing and services sectors. The index demonstrates whether market conditions are expanding or contracting. In the first case, the economic growth is likely to expand, while in the second, a recession is likely to occur.
PMIs above 50 demonstrate economic expansion, while if the index falls below 50, it reflects economic contraction. Traders can use this information to predict whether a central bank is going to hike, cut rates, or make no changes in the monetary policy. Unlike GDP data, which is a lagging indicator, PMIs are released in advance allowing market participants to make their forecasts before they can see the final GDP figures.
A better-than-expected PMI leads to currency growth as it shows that the economy is strong enough (if the PMI is above 50), while a weaker-than-expected PMI reflects economic issues that may make the central bank cut rates or launch the QE in order to stimulate the economic growth. Therefore, traders often go long when the PMI is above 50 and increasing, while when the PMI is decreasing and falls below 50, they go short.
8: Political and Geopolitical Events
Various political and geopolitical events can also have a huge impact on financial markets. One of the recent examples is the US presidential election, which was the reason for significant price fluctuations.
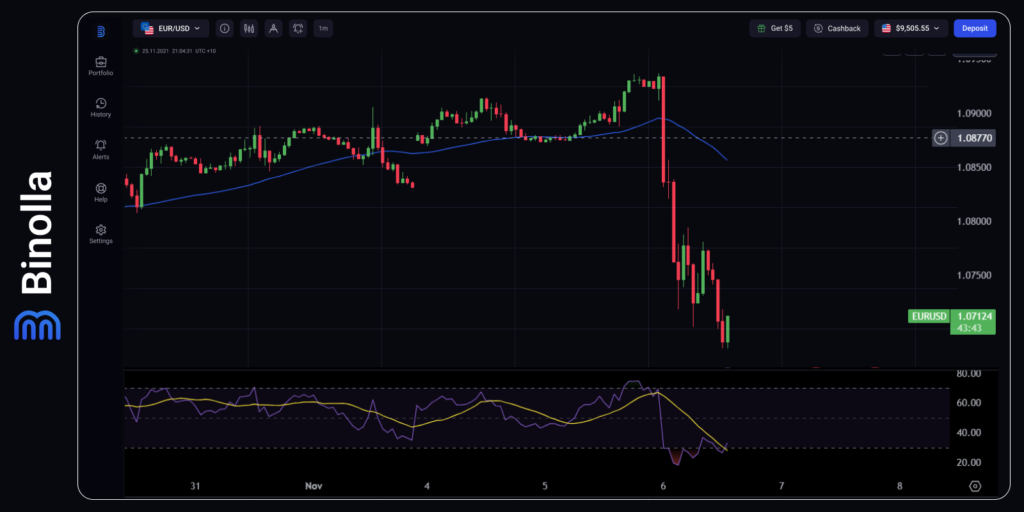
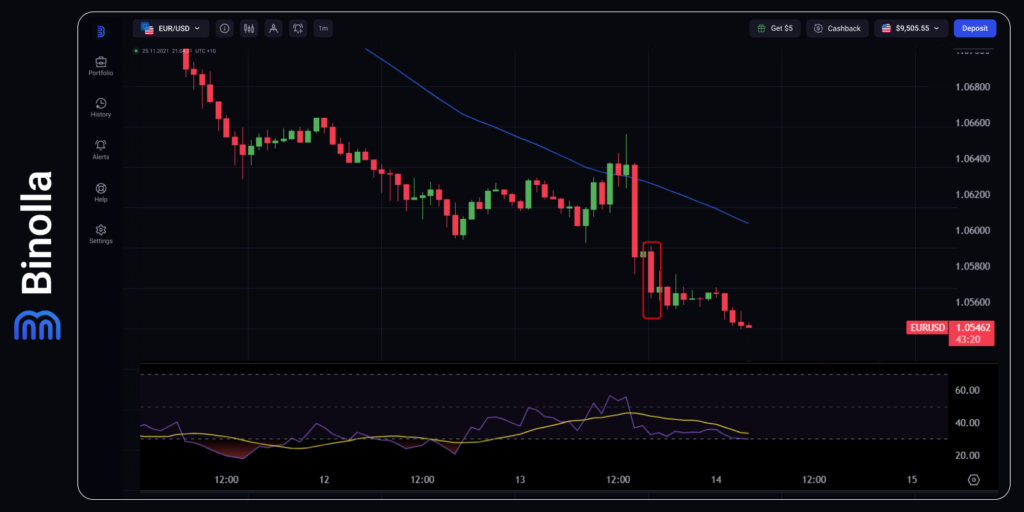
As you can see on the chart, EUR/USD had a significant downside momentum as the Eurozone is among the regions where the tariffs, promised by Trump may have the most negative effect. When it comes to the US dollar, amendments that the politician may apply, may stimulate inflation, which, in turn, will leave less space for the Fed to conduct expansionary policy.
When it comes to geopolitical events, traders should also focus on various tensions and conflicts. They can support some assets while putting significant pressure on others.
To make money on such events, you should think about their consequences first. As it was already mentioned, traders and investors had doubts about the elections in the United States, and the risk-off mode was turned on. It led to gold and the US dollar to rise. Therefore, all political and geopolitical events with a negative context lead to the rising popularity of so-called safe-haven assets. On the other hand, positive political events may stimulate market participants to invest in risky assets, which will support the stock market, commodities, cryptocurrencies, etc.
FAQ

Where to Find Macroeconomic Data?
It can be found in economic calendars. Normally, they allow market participants to see the current readings and forecasts. After a data set is released, traders can also see the final reading.
What Is More Important, Economic Data or Technical Indicators?
Economic data and various events have paramount importance as they influence market participants’ perceptions of a particular asset. They impact the balance between supply and demand and are the key drivers for price fluctuations. Technical indicators and prices reflect the impact of macroeconomic indicators and various events on markets.
Which is the Most Important Event to Move the Price?
Central banks’ decisions are the key events to drive the currency and other asset prices. Such decisions may stimulate demand or inject additional liquidity into the markets.


