Top 5 Trend Indicators in Trading

There are two main concepts in trading that most professional traders follow. They either follow the trend or tend to earn profits on market reversals. Following trends means buying digital contracts or buying/selling Forex CFDs/stocks along the current trend until the direction changes. This is a very simple approach, which, however, requires some deeper knowledge to be applied. To start using trend indicators and trade for real money at Binolla, open an account.
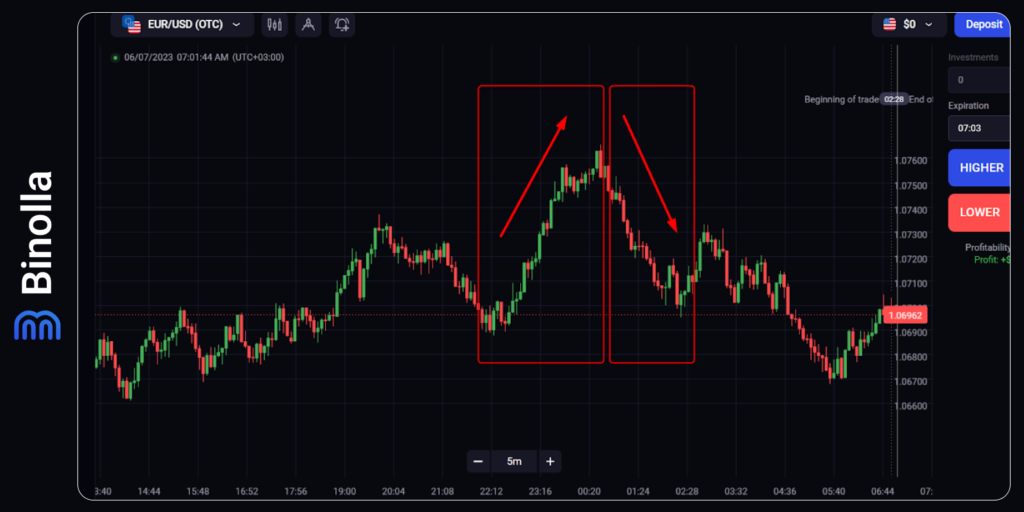
If you look at the image above, you can see that there are two highlighted areas, with the price going upwards and then changing its direction and going downwards. This is a very standard market situation, which allows you to earn money by simply buying a Higher contract when the price goes upwards and buying a Lower one when it plunges later (or buying the currency pair and selling it later when it comes to FX CFD).
All this looks very simple when it comes to history. However, when you are looking at the naked chart, you never know when the trend starts and when it ends. Therefore, you will need some tools that will help you define the current trend and understand where the price is going to reverse in the opposite direction. This is where trend-following indicators come into play.
Contents
- 0.1 Trend-Following or Simply Trend Trading
- 0.2 Three Types of Trends
- 0.3 1: The Moving Average IndicatorThe price going up and down on charts
- 0.4 2: Bollinger Bands
- 0.5 Give these indicators a try!
- 1 3: Ichimoku Cloud
Trend-Following or Simply Trend Trading
As you may guess, trend or trend-following trading is the concept of buying the asset (or buying a Higher fixed-time contract) during the uptrend and selling the asset (or buying a Lower contract) along the downtrend.
This strategy is based on the assumption that the trend is more or less predictable. If there is an uptrend, for instance, the price is likely to increase over time. Therefore, you can buy an asset or buy a Higher contract to benefit from this price movement.
Three Types of Trends
There are three main types of trends that traders are looking for when they are working with any particular underlying asset. They include:
- Uptrend. During the uptrends, the price is consistently growing, and the lows become higher. This is how we can identify the uptrend. If you see that the price establishes higher lows, you can say that it goes upward. If EUR/USD reaches 1.1000, for instance, then falls back to 1.0980, then goes to 1.1015, and falls back again to 1.0990, you can say that the currency pair is developing an uptrend as you can see that the lows become higher with each new cycle;
- Downtrend. Opposite to the uptrend, when the downtrend begins, the price marks lower highs. The price is consistently going down during the downtrend. If we take EUR/USD, for instance, marking 1.1000, then going upwards and reaching 1.1015, then going downwards again to mark 1.0980, then going upwards to hit 1.1000, then falling again to reach 1.0978, we can say that the currency pair goes downwards as we have decreasing highs each new cycle;
- Sideways. While, in general, traders tend to define two main types of trends (uptrend and downtrend), sideways are also trends but with no definite direction. The price fluctuates in the horizontal range sideways, which is also a great opportunity to earn.
1: The Moving Average IndicatorThe price going up and down on charts
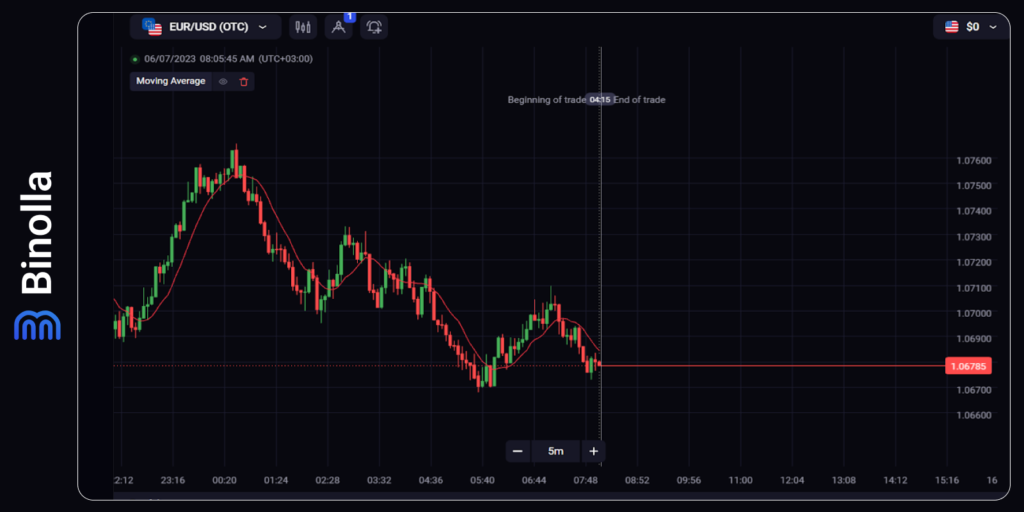
The moving average stands for an indicator that calculates the averages of the market’s price over a particular time interval. When it comes to charts, this indicator represents a line that is located above or below the price, highlighting the current market trend.
The moving average is a very popular indicator, as it allows you to see the current market trend without doing all those calculations on your own. Therefore, you can have a bird’s eye view of the current market situation without wasting your time calculating the average price on your own.
When you deal with the Binolla platform, you can find five types of the moving average there:
- SMA or a simple moving average. As the name suggests, this is the simplest moving average, which is built on the concept of calculating the sum of average prices for a particular period and dividing it by the number of periods (candlesticks);
- WMA or a weighted moving average. This WMA indicator is based on the concept that each particular average price is given a particular weight. If the moving average is calculated for the ten past candlesticks, for instance, the “weight” will be given to the first several candlesticks, while the latest ones will be “lighter”;
- EMA or an exponential moving average. Unlike WMA, EMA gives more weight to the recent candlesticks, which gives you a better view of the latest performance of a particular asset;
- TMA or a triangular moving average. This type of moving average combines a weighted approach with a triangular pattern. Once the simple moving average is calculated, you need to sum all the simple moving averages for a particular period and divide it by the number of periods;
- SMMA or a smoothed moving average. This is a mix of simple and exponential moving averages, but with a longer period.
Now you know all the main types of moving averages. Don’t worry if you still have blank points, as we are going to describe them in a more detailed manner in our special guide to the moving average indicator.
How to Use the Moving Average?
There are plenty of ways to use the moving average, from implying the current trend to different strategies. If you apply the indicator to see the current price direction, you don’t need any additional tools or strategies.
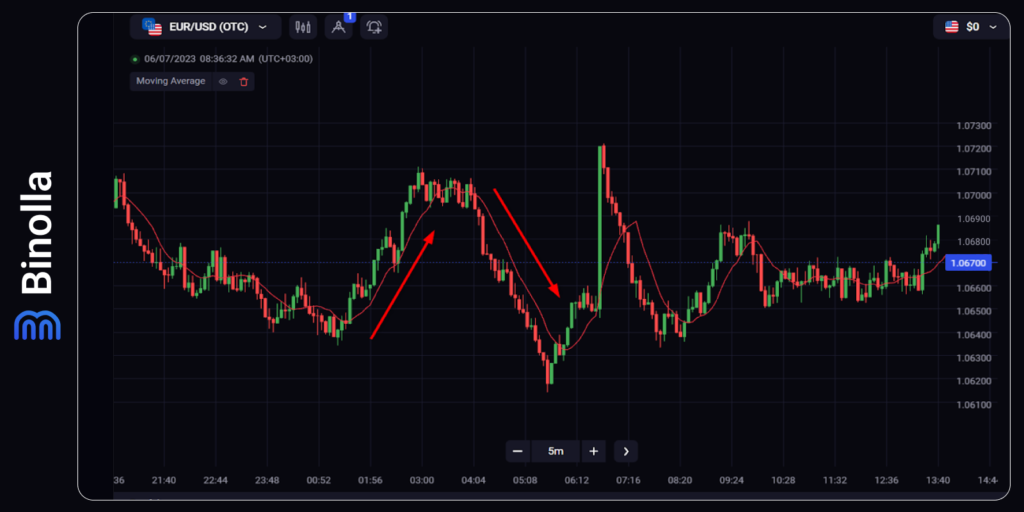
The chart above demonstrates how to use the moving average to define market trends. If the price is above the MA, the asset’s price is in the uptrend, while when the MA is above the price, you can assume that the price goes downwards. This is very simple, but such a strategy gives you only the perspective of the market without providing you with any points from which you can start trading.
Therefore, you can apply more complex strategies to find those entry points. One of the easiest tactics is to add two moving averages with different periods on the chart.
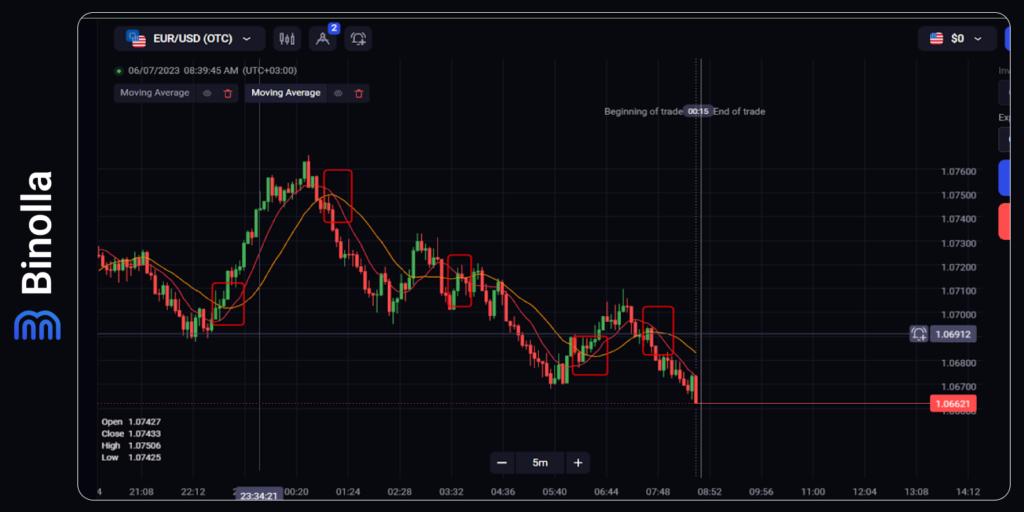
Our next example shows how to use two MAs and benefit from them. We have added one MA with a period of 10 and another one (orange) with a period of 20. The idea of this strategy is very straightforward. If the MA with the period of 10 crosses the MA with the period of 20 from below and both are below the price, you can buy a Higher contract. In the opposite situation, when the faster red MA with a period of 10 crosses the orange one with a period of 20 from above, this is an opportunity for a trader to buy a Lower contract or sell the currency pair.
2: Bollinger Bands
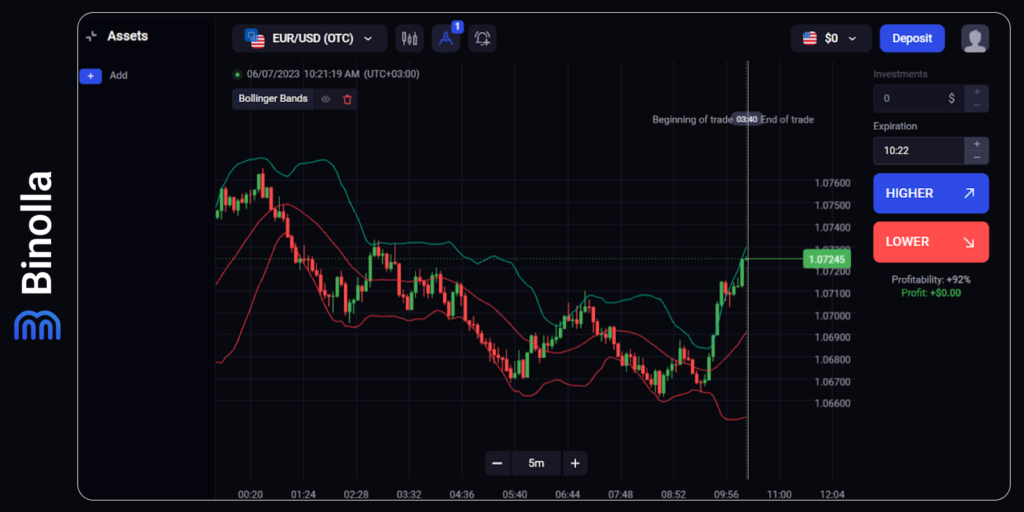
This is the second most popular indicator among traders. Unlike the moving average, Bollinger Bands, or BB, are a ready-made trading system that allows you to find various entry points and even plan when to leave the market.
Bollinger Bands consist of three lines:
- An upper band;
- A moving average;
- A lower band.
If you apply BB on your Binolla chart, you will have an indicator with a period of 5 by default. As for deviation, it is equal to 1. To make it work, you should adjust the period. There is no “right” setting or a “golden rule” for traders to use BB. We have used a period of 20 for this particular example and a deviation, which is equal to 2.
Bollinger Bands is not only about revealing market trends. It is also about measuring volatility. This means that if the indicator is narrow, the market shows low volatility, while when the bands expand in both directions, the market’s volatility is growing.
While there is a separate article dedicated to BB in our blog where you will find out more about the indicator itself and some strategies that you can use, we are going to provide you with one of the simplest tactics here.
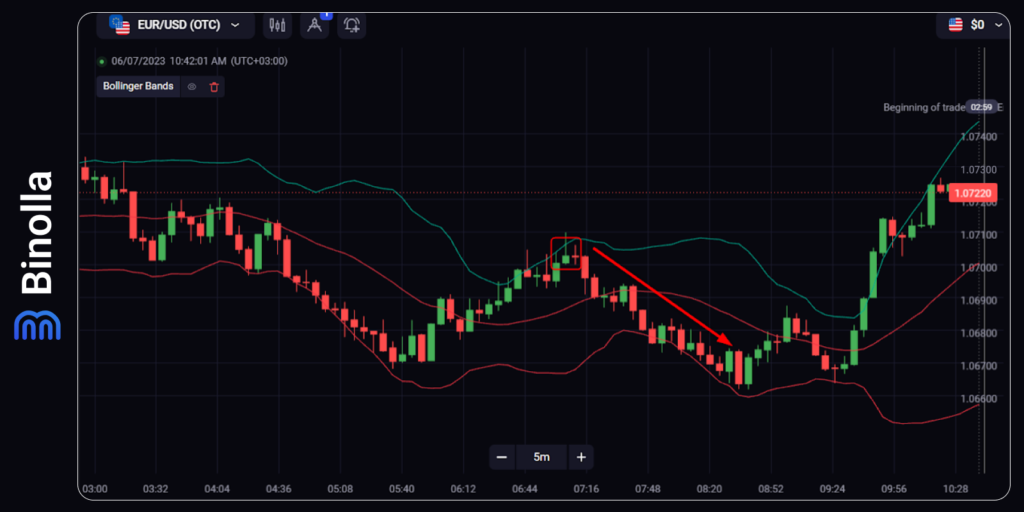
This strategy involves both BB and Japanese candlestick patterns. In the example above, you can see that the price has reached the upper band, which normally means that it has met strong resistance. Moreover, we have a confluence of signals there as the Shooting Star pattern crops up. Therefore, in this particular situation, you can buy a Lower contract or simply sell the currency pair.
3: Ichimoku Cloud
The next one on our list is Ichimoku Cloud, which is also known as Ichimoku Kinko Hyo. This strange name comes from Japanese, as the indicator was developed by Goichi Hosoda, a Japanese journalist, in the 1930s. However, the indicator remained undiscovered for some time and was only revealed to wide masses in 1969.
The Ichimoku Cloud Indicator consists of:
- Tenkan-sen (green line). It represents the sum of the nine-period high and nine-period low, divided by two;
- Kijun-sen. It represents the 26-period high and 26-period low, divided by two;
- Senkou Span A. It represents the sum of Tenkan-sen and Kijun-sen, divided by two. Senkou Span A is the red line of the cloud;
- Senkou Span B. This line is the sum of the 52-period high and 52-period low, divided by two. Senkou Span is the blue line of the cloud.
- The Cloud. This is a special part of Ichimoku Cloud, which helps traders to find out the current trend;
- Chinkou Span. This is a lagging line that demonstrated closing prices 26 periods behind the latest closing price.
Ichimoku Cloud Basic Strategy
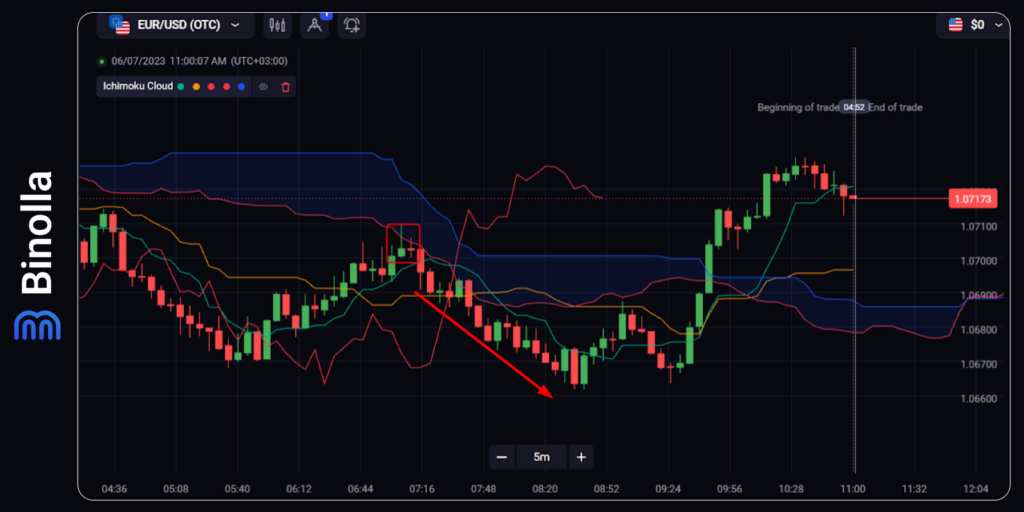
While there are plenty of strategies that you can use and even more that you can create on your own when using this technical indicator, we are going to show you one example of how to use Ichimoku Cloud in your trading routine. A lot more strategies and recommendations can be found in our special article dedicated to Ichimoku Cloud.
The chart above shows the confluence of signals. We have the Shooting Star pattern, which reaches Senkou Span A, the dynamic resistance. The idea behind this strategy is very simple. Once the price reaches such a dynamic resistance and bounces off it, you can sell the currency pair or buy a Lower contract.
4: Parabolic SAR
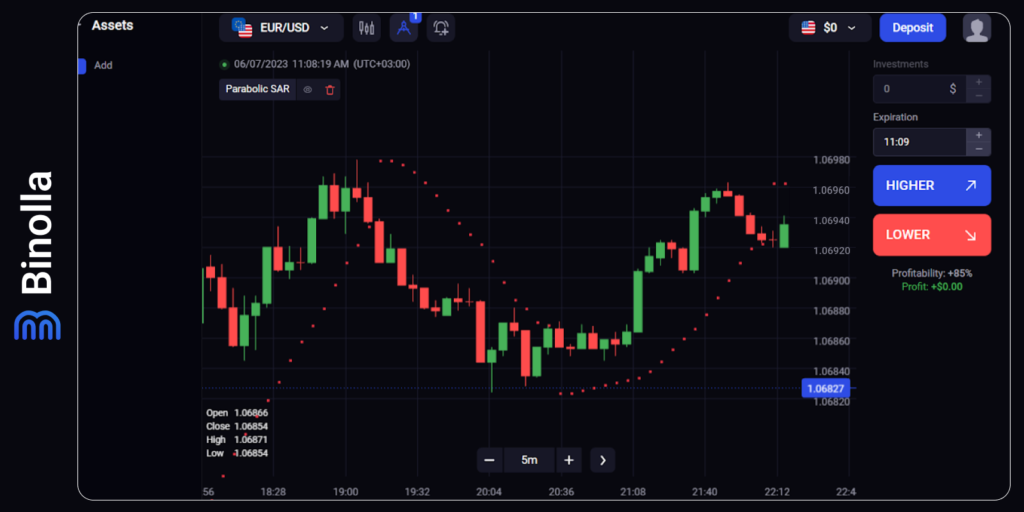
Parabolic SAR, aka Parabolic Stop and Reverse, is quite an interesting technical indicator that is sometimes underestimated by traders. On the other hand, due to what you can see in the chat when you apply this indicator, you can overestimate it easily, as the situation seems to be so evident that it is hard not to react to it.
However, you should keep in mind that with Parabolic SAR nothing is easy and nothing is evident. The indicator was developed by J. Wells Wilder Junior. The idea behind it was to:
- Highlight the current trend;
- To forecast a reversal;
- To provide traders with exit points.
While the indicator is more than good for the first and third, there are questions about the second concept.
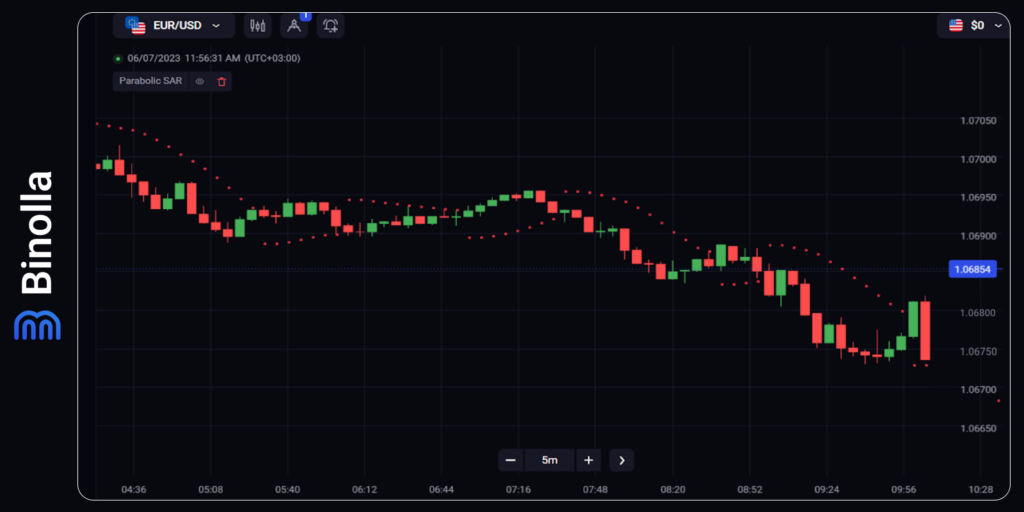
If you take a look at our example, you will see that Parabolic SAR is good for trend identification. Once the dots appear above the price, you can assume that a currency pair or any other asset is in a downtrend, while in the opposite situation, when the dots are below the price, we have an uptrend. This is similar to the moving average trend identification.
Another great strategy for traders is to use Parabolic SAR to find exit points (this concept is relevant for Forex CFD and stock traders). If you want to know when to leave the market and close your current positions, you can use Parabolic Sar. The idea is very simple. If you are trading along with an uptrend with the dots below the price, once the dots crop up above the price, it is a signal that the trend may reverse.
There is also a strategy where Parabolic SAR is used to define entry points. However, this approach has one significant drawback. The Parabolic SAR indicator is infamous for redrawing. This means that even if you see one dot appearing on the other side of the price, this doesn’t mean that the trend is changing. Dots may reappear on the current side again after a couple of candlesticks.
Redrawing is the general problem with most indicators. However, when it comes to a moving average, for instance, if you use them as we have demonstrated above in the Moving Average section, you have a good entry point when both lines have a crossover. When it comes to Parabolic SAR, you can’t see this line, which makes the indicator less informative.
5: Alligator
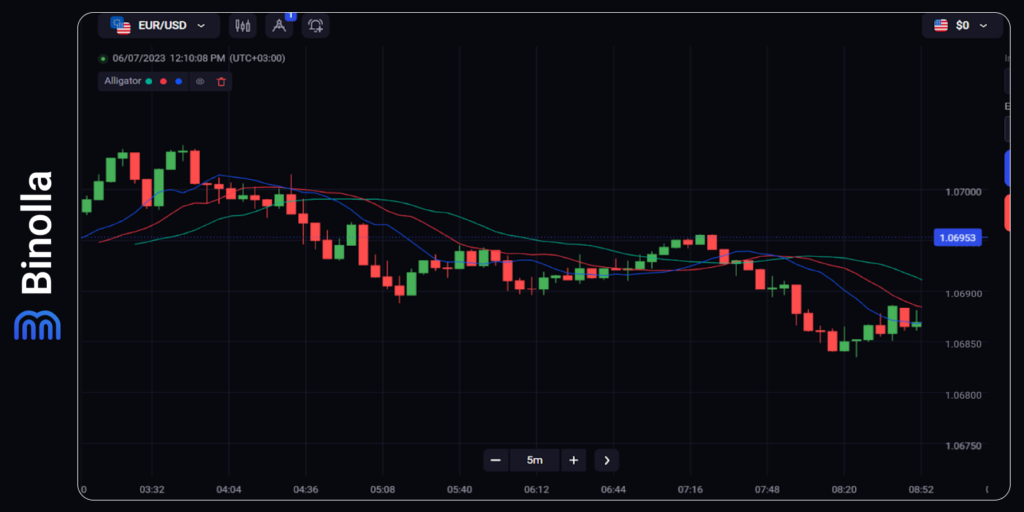
Alligator is a technical indicator developed by Bill Williams. It includes three moving averages with different periods. This too allows traders to predict market trends, see market volatility, and find entry points. Alligator has three main positions:
- Sleeping Alligator. This is a situation when three lines are close to each other and are intertwined. When this happens, Alligator gives no signals, as there is no upward or downward trend at this moment;
- Awakening Alligator. The next Alligator position occurs when all three lines are aligned in the same direction. They are still close to each other, but they are already indicating the future market trend;
- Hungry Alligator. Finally, when all three lines take a definite direction and there is a distance between them, we can say that the market is trading.
The Lines of Alligator
The Alligator indicator is based on three moving averages. They are also known as:
- The blue line, or “Lip”. This is a simple moving average with the lowest period that quickly reacts to any market changes;
- The red line, or “Teeth”. This moving average has a higher period and, therefore, is a slower one as compared to Lips;
- Finally, the green line, or “Jaws”. This is the slowest moving average of all three lines, which has the highest period.
How to Use Alligator
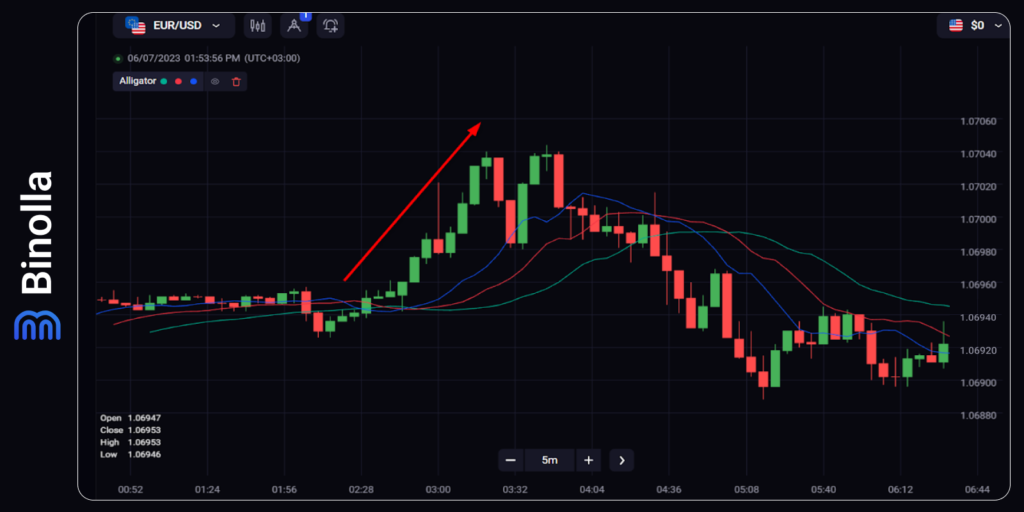
Alligator acts as an indicator that demonstrates the current market trend. Using it alone will not give you any strategy. However, when combined with some other indicators, it may become a strong addition augmentation to your strategy.
In general, when Jaws are below Teeth, and Teeth are below Lips, you can assume that there is an uptrend. Moreover, if the lines expand the distance between each other, the uptrend is strong. On the other hand, when Jaws are above Teeth, and Teeth are above Lips, we can say that there is a downtrend. The indicator may be applied for both intraday and long-term trading.
How to Use Trend Indicators in Trading: Tips and Tricks
While it seems evident how to trade with those and other trend indicators, there are some recommendations that you can follow to improve your results or avoid some crucial mistakes:
- Trend-following indicators are lagging. This is the first thing that you need to know when applying those technical analysis tools. Whatever type of trader you are or whether you are using short-term or long-term strategies, trend indicators will never notify you about the future trend in advance. Therefore, you can use momentum indicators to know about reversals or price corrections in advance;
- Change periods carefully. A period is a certain number of candlesticks that are included in the calculations of the indicator. The higher the periods you set, the more candlesticks will be considered and, thus, the smoother the line of the trend indicator will be. At the same time, the lower the period, the “sharper” the fluctuations of the indicator line will be;
- Think about adding other technical analysis tools to your strategy. While trend indicators can be mostly used as a standalone tactic, you can augment them with other indicators or drawing tools. It would be a good idea to combine Japanese candlesticks with trend indicators to find entry points for trading;
- Do not overload charts with indicators. The problem for many beginner traders is that they put a lot of indicators on charts, thinking that this will make calculations even more precise. However, the effect of such an approach may be totally opposite. You will hardly read the price, and the indicators may give different signals, which will not allow you to find entry points on time;
- Keep in mind that none of the best of the existing trend-following indicators will give you 100% results in trading. Whatever indicator you use or whatever promises you hear from the developers of the newest trend-following indicators, they fail from time to time, depending on the market situation. For instance, those indicators are almost useless during horizontal range trading. Therefore, you should think about how to separate the trend and range periods of the price fluctuations in your strategy.
Conclusion
Those five indicators are the cherry on top. There are plenty of other technical analysis tools that may be helpful to you, and you will find their detailed descriptions in our blog. Keep in mind that whatever indicator you use, there is no guarantee that you will earn money consistently without using a proper money management strategy.
The list of the indicators that are enumerated in this article is not full. While those are the most popular technical analysis tools, you will find a lot more indicators that follow the trend on the Binolla platform.
FAQ

What is the Best Trend Indicator?
It is impossible to say which indicator is the best to define market trends. While the moving average is the all-time classic that is taken by many traders as the basic indicator for their technical analysis tools, it is impossible to state that the MA is the best one. Each trader decides which indicator is best for themselves on their own.
What is the Most Accurate Trend Indicator?
None of the trend indicators can be called “the most accurate.” It depends on a particular situation, your trading strategy, and your settings. For instance, if you put a basic version of the moving average on the chart, you will see that it is almost impossible to trade with it. Moreover, you will hardly be able to define trends using this basic solution. Traders often change the period of the indicator in order to make it more useful to them.
What Is Better, SMA or EMA?
SMA, or a simple moving average, distributes the weight evenly, while EMA, or an exponential moving average, gives more weight to the latest prices, which makes the results of calculations more timely as compared to SMA. Therefore, EMA is preferred among many traders over SMA.

