Top 5 Momentum Indicators in Trading

Momentum indicators are very helpful, as they allow traders to see the speed of price changes. Moreover, they allow market participants to understand the strength of a particular trend. It should be mentioned that momentum indicators are very popular among traders as they provide them with entry points of different kinds. They can be used alone or in combination with other indicators (trend indicators, for instance). Use the variety of momentum indicators when trading with Binolla.
Contents
Momentum Indicators Basics
The main idea behind momentum indicators is to analyze the rate of speed of the asset, regardless of the current market trend. According to the formula that lies behind these tools, they compare the recent closing price with the previous closing price. In most cases, momentum indicators are presented with a single line, which fluctuates within a range between 0 and 100.
Main Types of Momentum Indicators
All indicators of this type can be divided into the following categories:
- The closing price compared to the previous price in momentum indicators. As it comes from the name, indicators of momentum in this category compare the most recent closing market prices with the previous closing price to identify potentially oversold and overbought assets. Such indicators are often used to find market reversals and are very helpful for short-term traders. The most popular indicators of this type are RSI and Momentum;
- The closing price compared to range. The formula behind this type of indicator compares the current price to a range of high, low, open, and close prices. With this type of indicator, traders can measure market strength. Moreover, such tools are also useful to find price reversals and breakouts;
- The closing price compared to the moving average. With this type of indicator, traders can understand the speed of price action in the financial markets. Unlike the previous two types, this one relies on the moving average and, therefore, is considered lagging. One of the most popular examples of this indicator is MACD.
Main Types of Signals
As mentioned above, the main idea behind this indicator is to provide traders with information about potential price reversals and price movement strength. Therefore, there are three types of signals that momentum indicators produce.
Crossover Signals
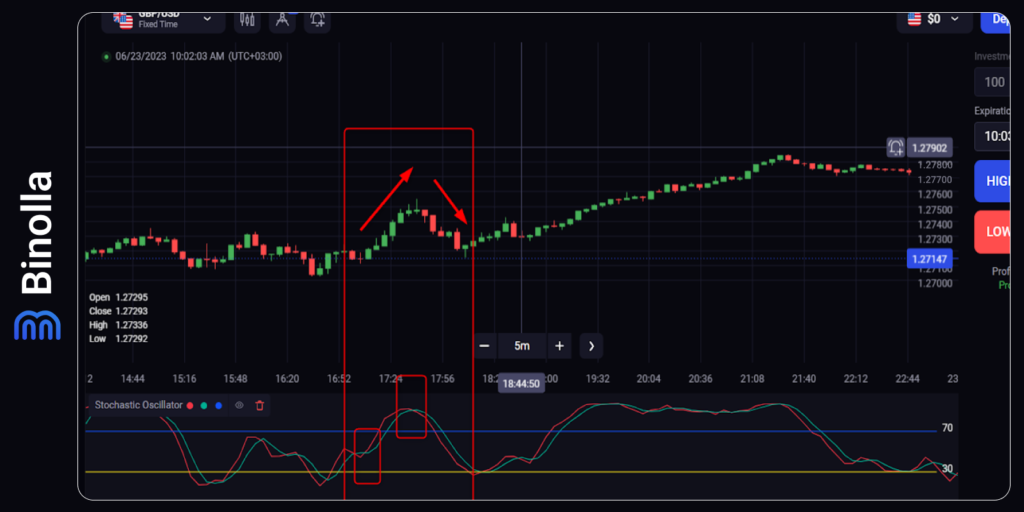
This type of signal is applicable when an indicator has two lines (Stochastic Oscillator, for instance). The idea is to find the crossover between both lines. In the example above, those crossovers allow you to both buy Higher and Lower contracts (or purchase and sell the currency pair) when using momentum indicators. This is one of the best strategies for day and long-term trading.
Divergence Concept
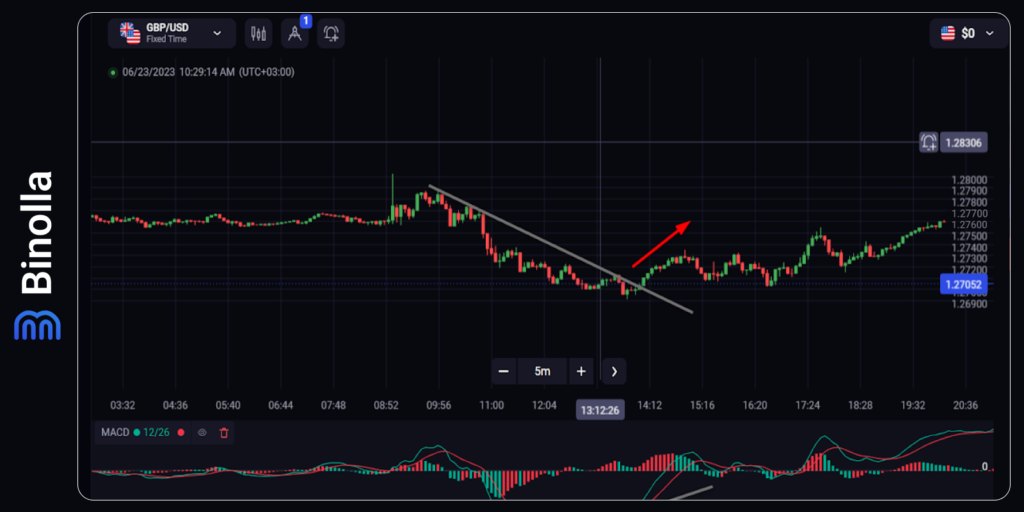
Divergence is the concept of the divergence between the indicator and the price. As you can see on the chart above, the price establishes new lower highs while the indicator is in an uptrend. The divergence ends with a small uptrend. This signal is relevant for Forex and stock trading only. It is not a good solution for digital options as it does not provide you with clear signals. Divergences may accumulate for some time, which is not good for digital options traders.
Overbought/Oversold
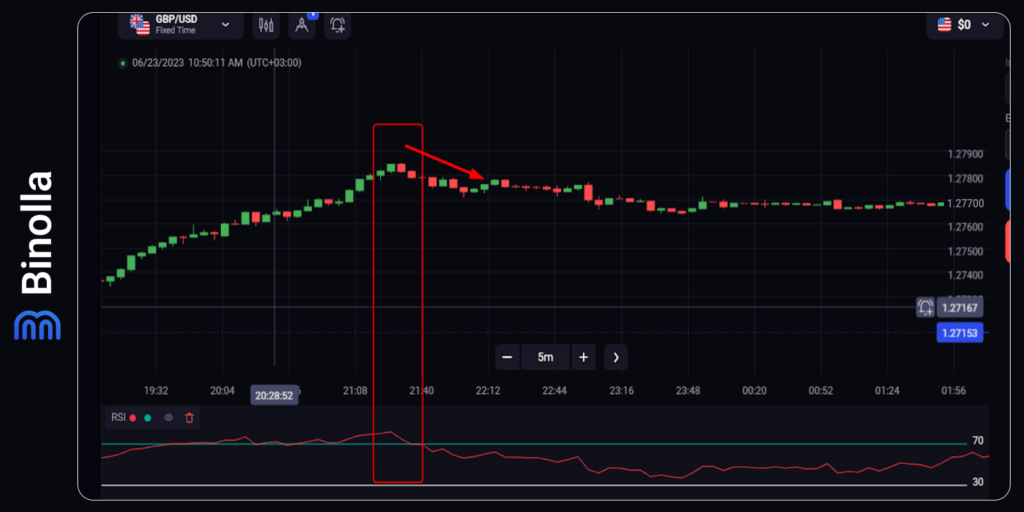
The third type of signal refers to situations when the indicator line leaves 30 or 70 oversold and overbought areas. The example above shows the overbought signal when the indicator leaves the area above 70 and goes below this level. You can buy Lower contracts or sell the currency pair in this case.
The Most Popular Momentum Indicators
There are plenty of momentum indicators nowadays. Some of them are so-called “classics” that were designed decades ago, while others were developed recently. Our top 5 momentum indicators include the most popular and interesting solutions for trading in the financial markets.
RSI or Relative Strength Index
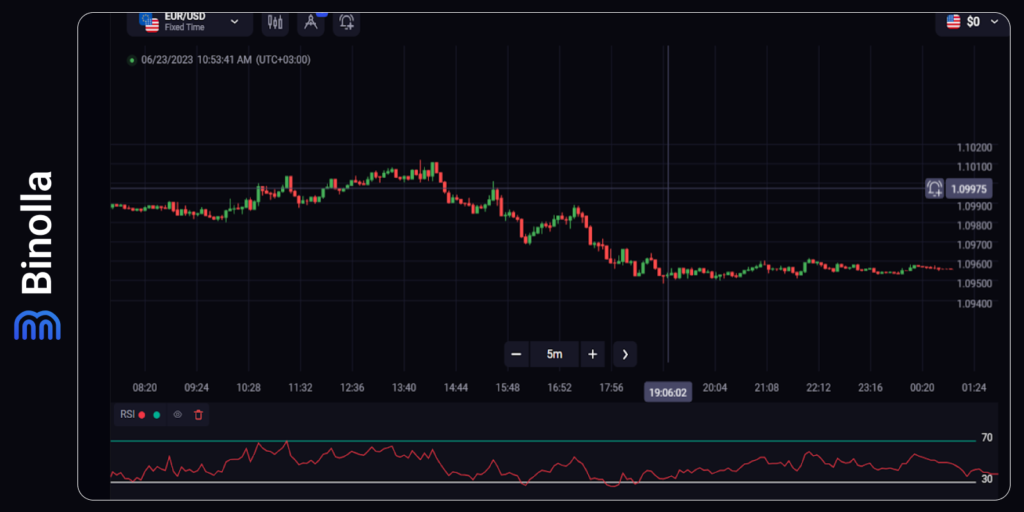
The relative strength index, aka RSI, is one of the most interesting momentum solutions. It measures the speed of price movements and their changes over a pre-set time interval. RSI has a 14 period by default, which is enough in most cases for various trading purposes.
The indicator fluctuates in a separate window in a range between 0 and 100. It has two additional horizontal lines (30 and 70, but you can change them to 20 and 80 if you want) that mark overbought and oversold areas.
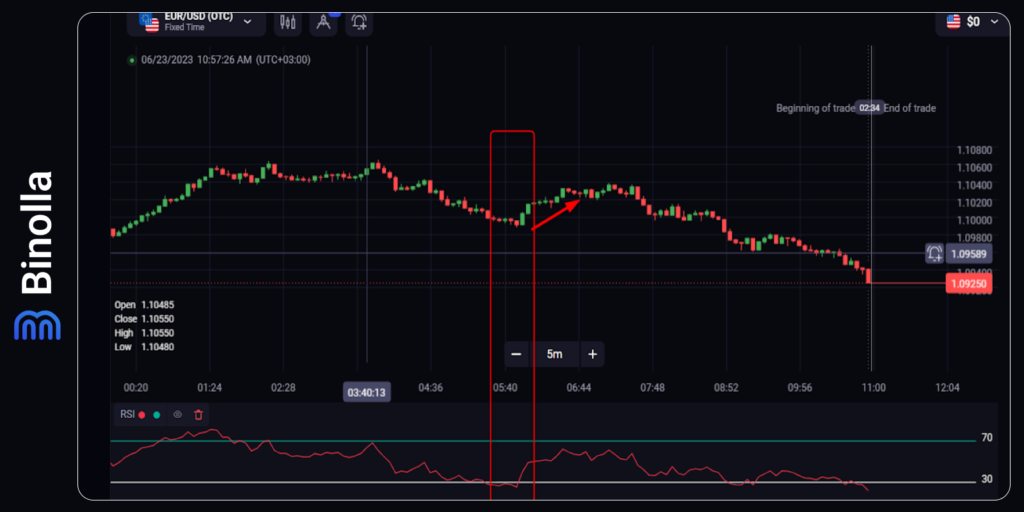
As for trading signals, RSI is mostly used by traders to find market reversals. The example above shows a situation when the indicator goes below 30 (reaches the oversold area) and then goes above 30, which is a signal to buy Higher digital options contracts or purchase the currency pair if you are trading Forex CFD contracts.
ADX or Average Directional Index
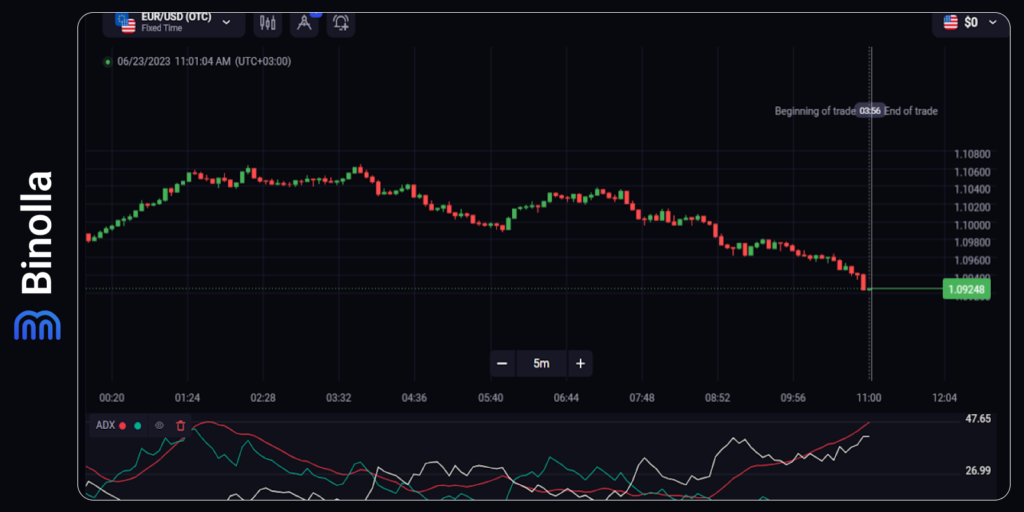
Unlike the RSI, Average Directional Index does not give you any idea about market reversals or even the current trend. It provides you with information about the strength of the trend movement instead.
The formula for this indicator is complicated. It includes positive and negative directional indicators (+DI and -DI). There is also a third line that is smoother and divided by the average true range.
The ADX line provides you with information about the current trend strength. However, some traders mistakenly think that ADX shows the trend direction itself. It is not true. As you can see in the screenshot above, ADX may rise during both uptrends and downtrends.
Due to its nature, the indicator is useless when applied alone. However, it can be combined with other technical indicators to augment various strategies.
Commodity Channel Index or CCI
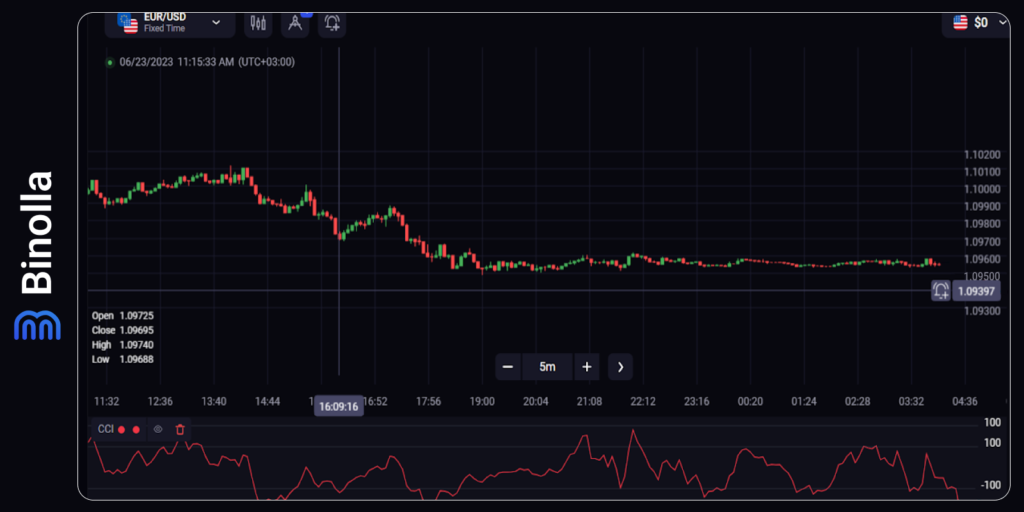
By applying this indicator, you can measure the deviation between the average price and the asset’s current price. CCI uses a more sophisticated formula, which allows it to find even some visually unidentifiable tendencies. However, using Commodity Channel Index alone is not a good idea, as this indicator can confirm signals from other indicators.
MACD
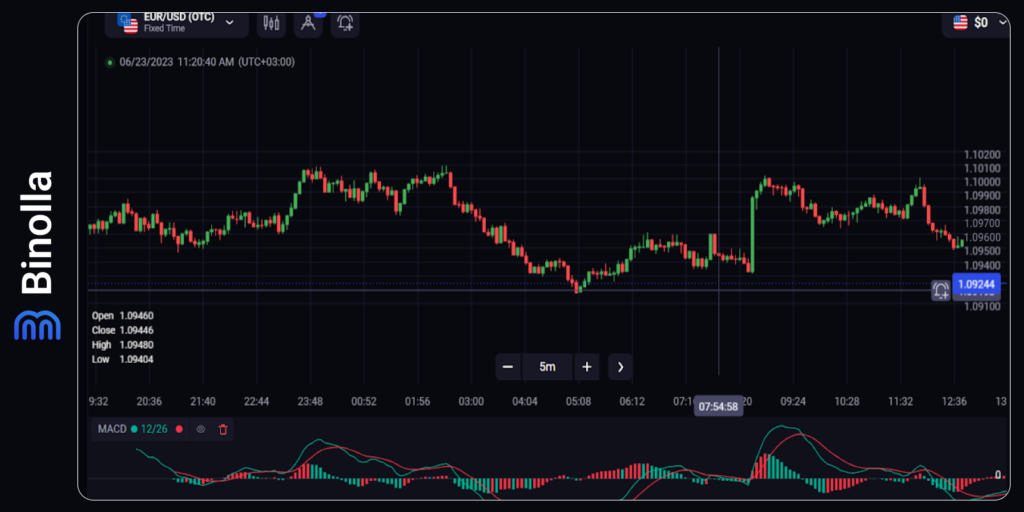
Moving Average Convergence Divergence is another popular momentum indicator that can be found in many strategies. It is considered a trend-following oscillator, which allows you to both find current price directions and entry points to buy or sell various types of assets. It should be mentioned that MACD is not of great importance for digital options traders as its signals are not clear.
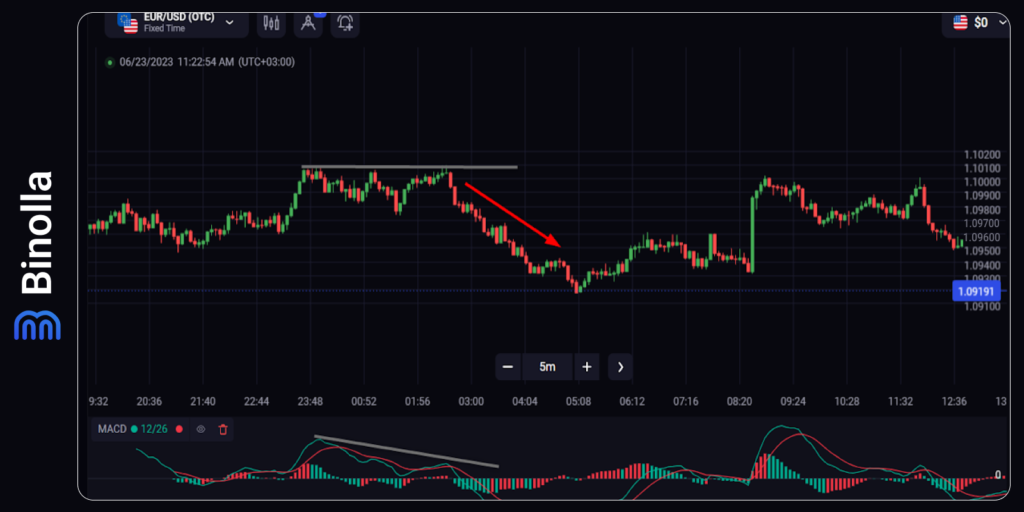
Divergence in trading occurs when the price and the indicator direction do not coincide. In the example above, you can see that the price establishes the same highs for some time, while the indicator’s highs are lower. Later, the price goes down, which is a good signal for Forex CFD traders to sell the currency pair.
Momentum Indicator
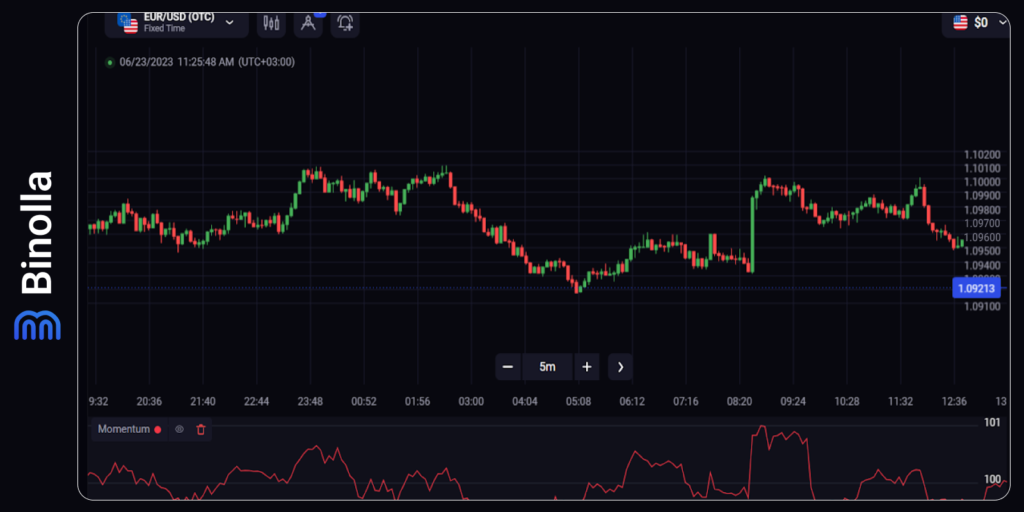
Momentum is a good indicator to measure the rate of change of the asset’s price over time. According to the formula, the indicator compares the current closing price with the closing price for a specific time interval. While it gives no clear overbought and oversold signals, the indicator can be useful to find market divergences.
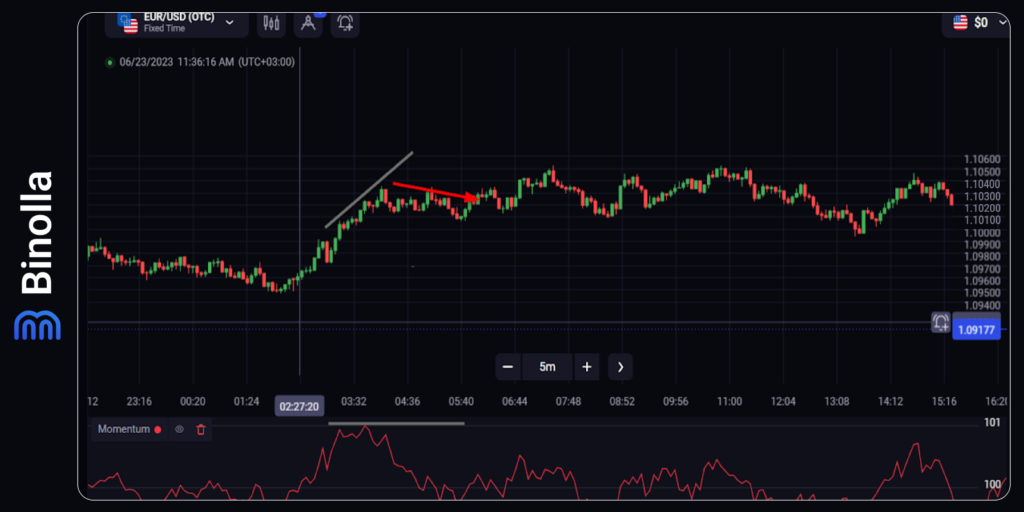
In the example above, you can see the bearish divergence when the indicator establishes equal highs while the price still goes upward. This signal is good for Forex CFD traders, allowing them to sell the currency pair. However, for digital options traders, this indicator is almost useless.
Some Useful Tips When Trading with Momentum Indicators
Momentum indicators are very useful, especially RSI or Stochastic Oscillator. However, even if their signals may seem evident, there are some tips that may be useful for you and increase your chances of success:
- Open trades in the trend direction. While it may seem tempting to buy a Higher contract during the downtrend or a Lower contract during the uptrend, it is better to trade along the current trend;
- Combine indicators in your trading strategy. Not all trading indicators can be used separately. If you are working with RSI, for instance, you can use it autonomously, as it allows you to find entry points during reversals. However, it would be a good idea to add support and resistance levels to augment a strategy. Moreover, you can add a trend line or a moving average to understand the global price direction;
- Try to avoid false signals. Adding more indicators or drawing tools to the chart will help you avoid false signals. While RSI and other oscillators are great during market trends, they may give you false signals during sideways markets;
- Don’t rely too much on indicators. While momentum indicators are good at defining market reversals, you can add a price action system to your trading in order to confirm trading signals.
Conclusion
Momentum indicators are very helpful, as they allow traders to see the points where the price may start a reversal. Inline trend-following indicators, which are lagging, oscillators show you a signal beforehand, meaning you can be right in time to place a trade.
FAQ

How Does a Momentum Indicator Work?
The momentum indicator compares the most recent closing price with the previous closing price. You can choose how many of the recent closing prices will be involved by changing the period.
Is Momentum Indicator Good?
It depends on how you work with it and your strategy. Moreover, the usefulness of a momentum indicator is defined by how you understand its formula and signals.
Which Indicator Has the Highest Accuracy?
There are no indicators that provide you with 100% accuracy in trading. Moreover, you can adjust the period of the indicator to make it work better for you in different situations.
Can I Use Momentum Indicators for Scalping?
Yes, you can. Momentum indicators are good for short-term fluctuations as they show you reversals beforehand. Therefore, when trading scalping strategies, you can use such tools with a high level of efficiency.


