The Week Ahead: US CPI Data, UK Labor Market, and GDP Statistics Are On the Way

The yearly US consumer price index is set to rise by 3.1%, which matches January’s inflation growth. When it comes to core monthly CPI, it is likely to slow down as the rise is expected to rise by 0.3% in February as compared to 0.4% in January. The inflation data in the United States that will be published on Tuesday, March 12 is likely to be the key price mover this week as this may bring clarity to the further Fed decisions on the monetary policy.
According to the latest FOMC head Jerome Powell comments, the Fed is going to start cutting rates “at some point this year”. However, the central bank officials are still looking for more confirmations of stable inflation. Moreover, the US inflation data is still above the targeted 2% level.
Contents
US Retail Data Ahead
Along with inflation, investors are likely to pay attention to the retail sales data this week, which will be released on Thursday, March 14. According to economists, retail sales are likely to rebound in February to post 0.8% growth against a -0.8% nosedive that was marked in January.
The UK GDP and Labor Market Data
Another set of data that may bring more volatility will come from the UK this week. Claimant Count Change which will be published on Tuesday is going to show how many new unemployed claimed unemployment benefits in the UK. According to the latest forecasts, the number of those looking for a new job increased by 20,300 in February as compared to 14,100 in January.
When it comes to the Average Earnings Index, it is likely to demonstrate a slightly lower growth in February (5.7%) as compared to January (5.8%).
It should be mentioned that the British economy suffered from a technical recession after GDP fell for two consecutive quarters. However, economists expect GDP to show moderate growth of 0.2% m/m during the upcoming release on Wednesday.
EUR/USD Weekly Review

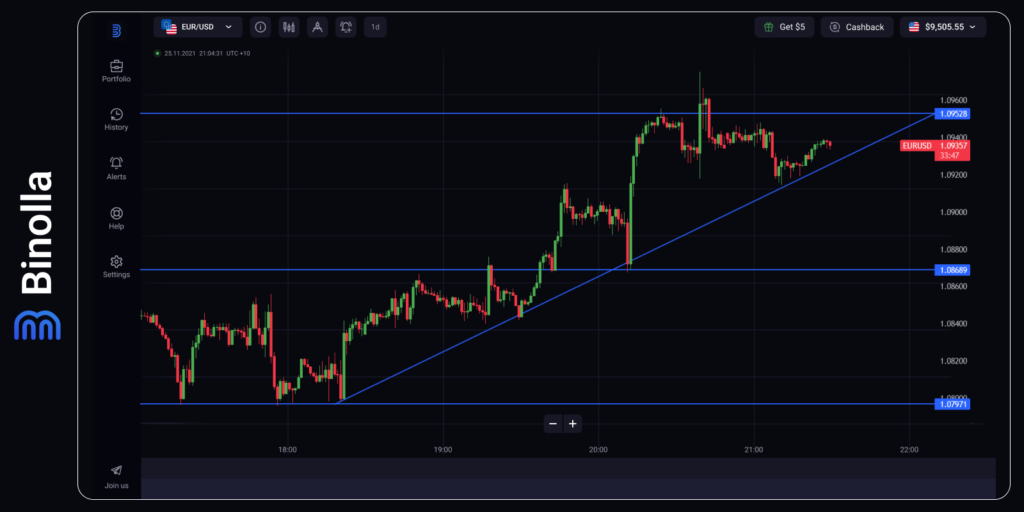
EUR/USD continues to set new yearly highs as the currency pair climbs along the upside trendline. After hitting 1.0980 on Friday, EUR/USD had a slight retracement towards the ascending trendline and resumed the uptrend on Tuesday. The closest resistance level on the hourly chart is 1.0952. If EUR/USD breaks it, the next target for the currency pair will be 1.0980, which is the yearly high.

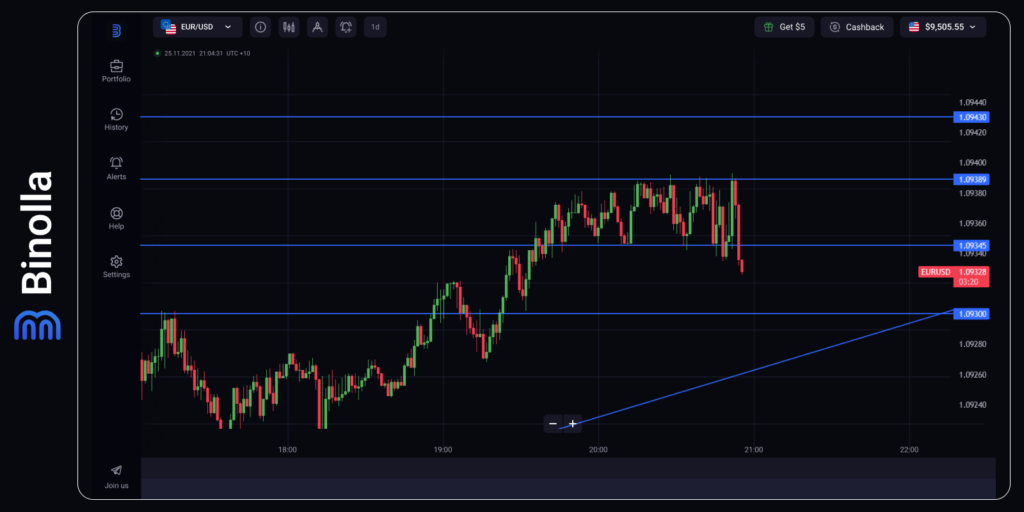
When going down to the 5-minute timeframe we can see that EUR/USD stays within a tight range between 1.0938 and 1.0934. Assuming that we have a general uptrend on the hourly chart, you can find reversal points from the support level. If the price plunges deeper, traders can expect it to test 1.0930.
GBP/USD Weekly Review

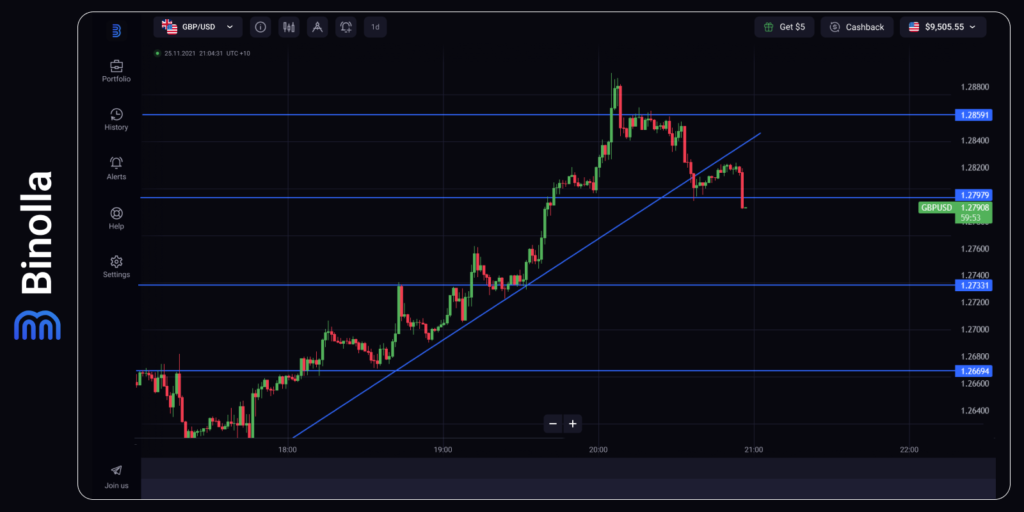
GBP/USD was traded along with ascending trendline as well. However, this line was broken on Tuesday. Currently, it stays slightly below 1.2800 and the price retests this level again. There is something alike a Head and Shoulders pattern and the price is close to the neckline. The upcoming hours will decide the further movements.

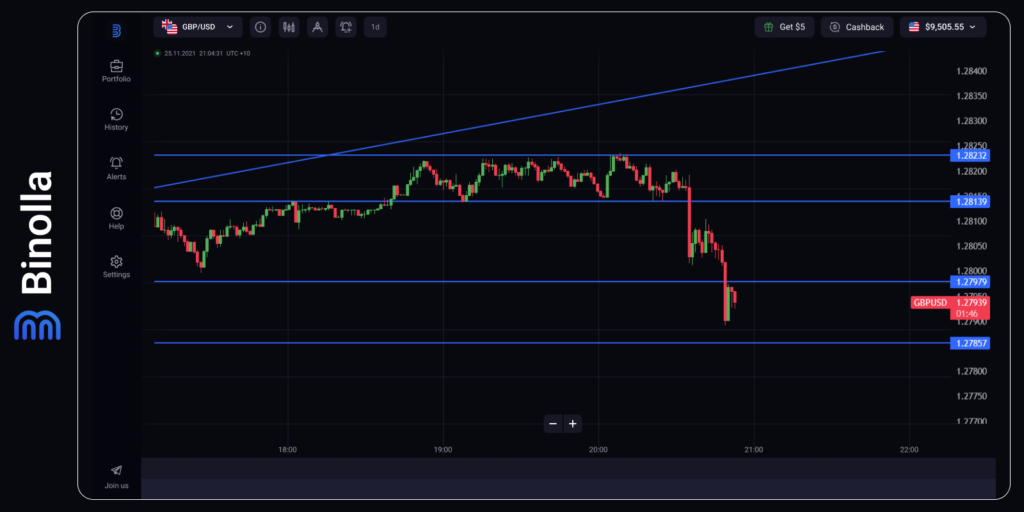
The 5-minute GBP/USD chart shows a slightly different picture. The price left the range between 1.2823 and 1.2813 and continues to plunge further targeting 1.2785. This level may be a reversal point for the price meaning you can try to find reversal signals there.


