The US Dollar Makes It Higher on the Post US ISM Manufacturing PMI Effect

The US ISM Manufacturing PMI was significantly better than expected on Monday supporting the US dollar against other assets. The American currency managed to make new gains on Monday and during the Asian session on Tuesday. However, later, the US dollar went on a correction allowing EUR and other assets to gain some positions.
Currently, financial markets are looking forward to seeing the results of Friday’s US labor market data releases to make decisions on whether to buy or sell USD.
Contents
- 1 EUR/USD: Fresh ECB Comments Press Euro Down
- 2 GBP/USD: Markets Are Waiting for the BoE Gov Bailey Comments
- 3 Your Strategy Starts with Market Knowledge!
- 4 BTC/USD: Bitcoin Buyers Are Waiting for New Price Drivers
- 5 USD/JPY: Japanese Yes Is Getting Stronger on the Latest Inflation Data
- 6 XAU/USD: Gold Loses Support
EUR/USD: Fresh ECB Comments Press Euro Down
The latest comments from ECB members changed traders’ and investors’ opinions about the European currency. Martins Kazaks, the head of the Central Bank of Latvia mentioned that the ECB should cut rates in 2025 as inflation is close to target levels.
Moreover, the latest Eurozone PMI data is in agreement with this opinion as the business activity in both the manufacturing and services sectors continues to contract in the whole region and in the major economies (France and Germany).
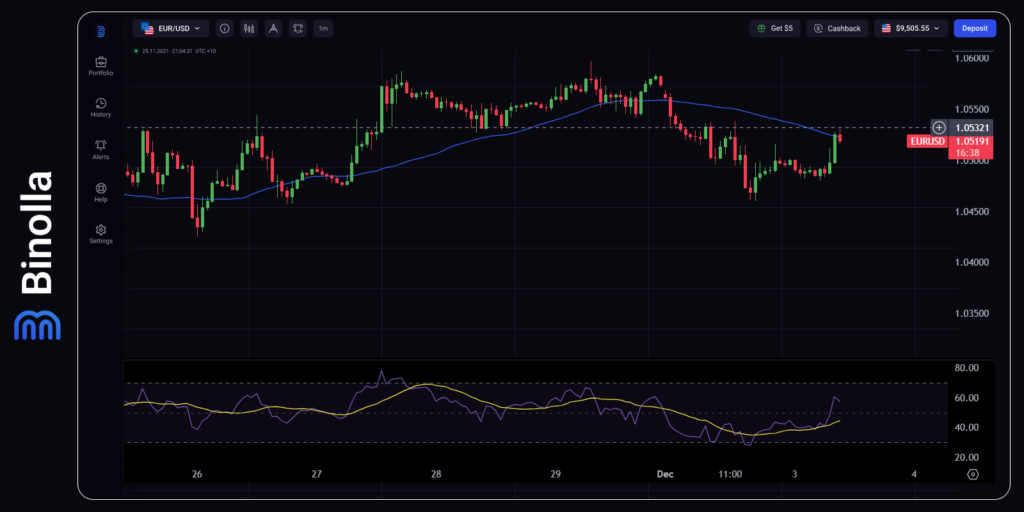
From a technical perspective, EUR/USD is trading right below the SMA50, which means that bears are still dominating the market. The targets below are at 1.0480 and 1.0435. On the upside, if EUR/USD manages to break above the SMA50, the closest target will be at 1.0580. The RSI indicator is neutral showing no momentum.
GBP/USD: Markets Are Waiting for the BoE Gov Bailey Comments
While the general agenda for this week is the US labor market data and the US ISM Services PMI, those who trade GBP/USD are looking forward to hearing some updates from the BoE gov Andrew Bailey.
According to the latest data, the Bank of England is ready to conduct more rate cuts in 2025. However, the Labor budget that was adopted recently may increase the inflation pressure the next year, which, in turn, will leave less room for the BoE to conduct more easing. Therefore, the British pound is supported by one side and under pressure by the other.
When it comes to USD, market participants are anticipating Friday’s US labor market data, which may give more drivers for price fluctuations. Moreover, the comments by Andrew Bailey may shed light on future monetary policy decisions by the Bank of England.
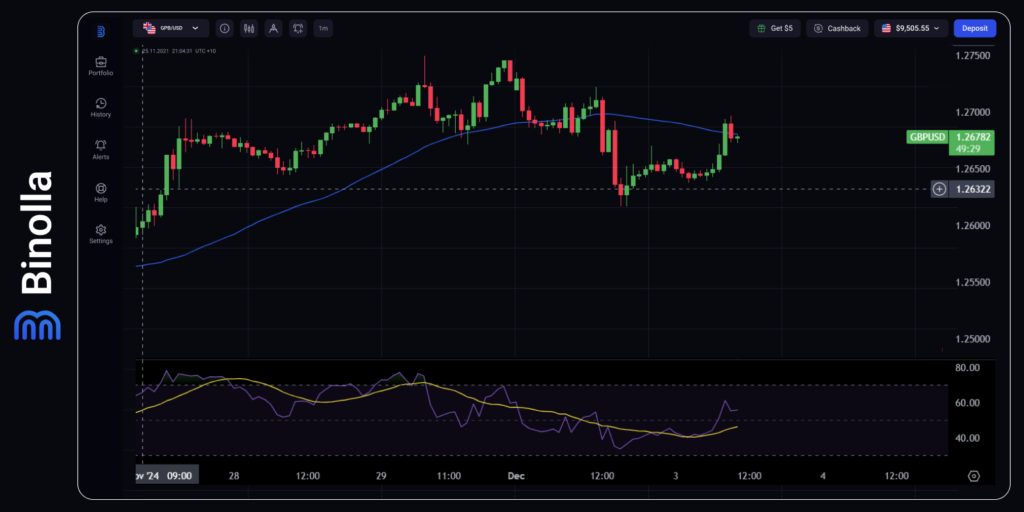
On the technical side, the currency pair made an attempt to break above the SMA50 but failed to create a strong upside momentum. Currently, it stays below the moving average, which means the bears are dominating the market. On the downside, the closest targets are at 1.2640 and 1.2610. On the upside, the closest target is at 1.2710.
BTC/USD: Bitcoin Buyers Are Waiting for New Price Drivers
Bitcoin is stuck below 100,000 as bulls are waiting for news and updates that should come from the new White House administration. This means that the resistance level, which is a round psychological number is unlikely to be breached until January 20, when the inauguration will take place.
Moreover, the currency pair is under pressure currently due to the stronger US dollar. Better economic figures leave more room for the Fed to avoid aggressive rate cuts. The latest comments from Fed officials were more hawkish and cautious, which supported the American currency. Currently, markets are anticipating Friday’s US labor market data to make decisions.
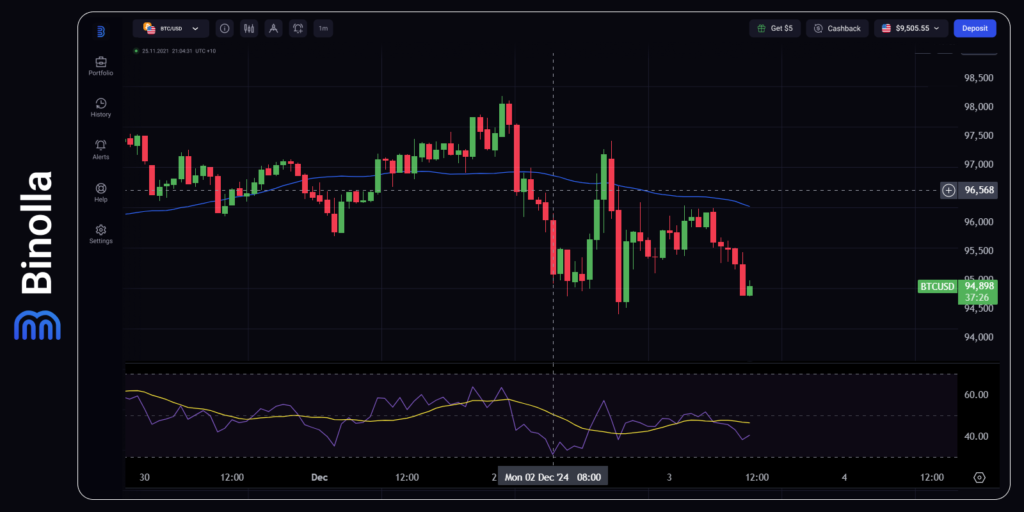
When it comes to technical analysis, BTC/USD is fluctuating below the SMA50, which means that bearish pressure is currently dominating. However, we have a local support level of 94,500, which can prevent the currency pair from moving lower. If BTC/USD manages to break below this support, the next target will be around 93,000. The upside is limited by the SMA50, which means that long positions will be preferable if the currency pair breaks above 96,000.
USD/JPY: Japanese Yes Is Getting Stronger on the Latest Inflation Data
The Japanese yen has got support from traders and investors following the Tokio CPI index, which showed that inflation is accelerating. Core Tokyo CPI y/y jumped over 2.0% and reached 2.2% on Friday, which means that the Bank of Japan will have to step in and hike rates again in December. This provides additional support to the Japanese currency.
Moreover, being a safe-haven asset, the Japanese yen is getting support from geopolitical tensions and future tariffs that Donald Trump has promised during the election campaign. These tariffs may unleash another global trade war and result in a global recession.
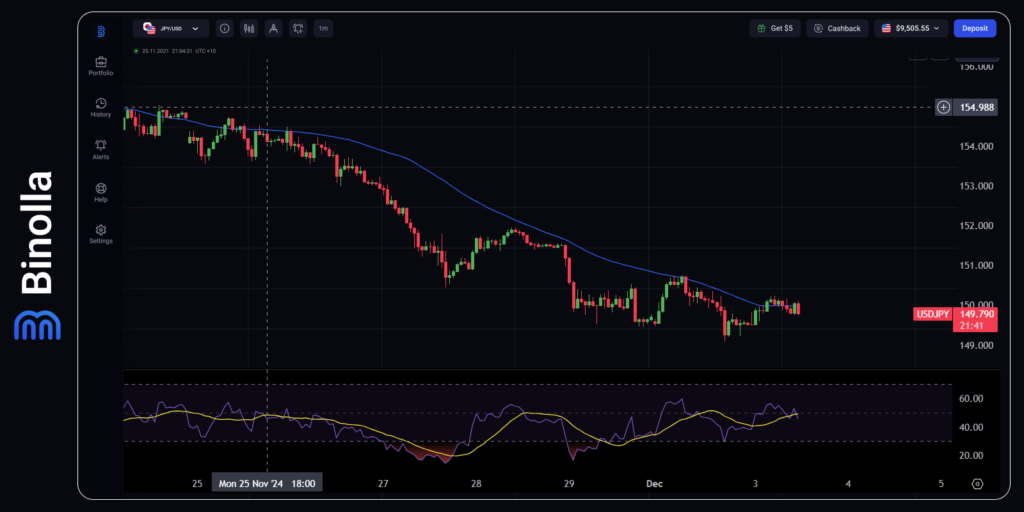
When it comes to technical analysis, the hourly chart shows a long downtrend that started in late November. The currency pair is trying to break above SMA50 but fails to make it and it is likely that the downtrend will continue. The RSI indicator is currently in the neutral position. On the downside, the closest support level is at 149.00. If the currency pair manages to break below it, we are likely to see USD/JPY testing 148.30. On the upside, the currency pair is limited by the SMA50. If it breaks it, the next target will be at 150.80.
XAU/USD: Gold Loses Support
Gold is losing support as the precious metal is no longer the focus of traders and investors who buy USD, JPY, and other assets. While there are still some supportive factors such as geopolitical tensions, fears of new trade wars, and others, market participants choose other financial instruments. Moreover, Gold is shadowed by the US dollar, which is growing on the better-than-expected US economic data and cautious comments from Fed officials. While the Federal Reserve is still likely to cut rates in December, the future expansionary steps are in question.
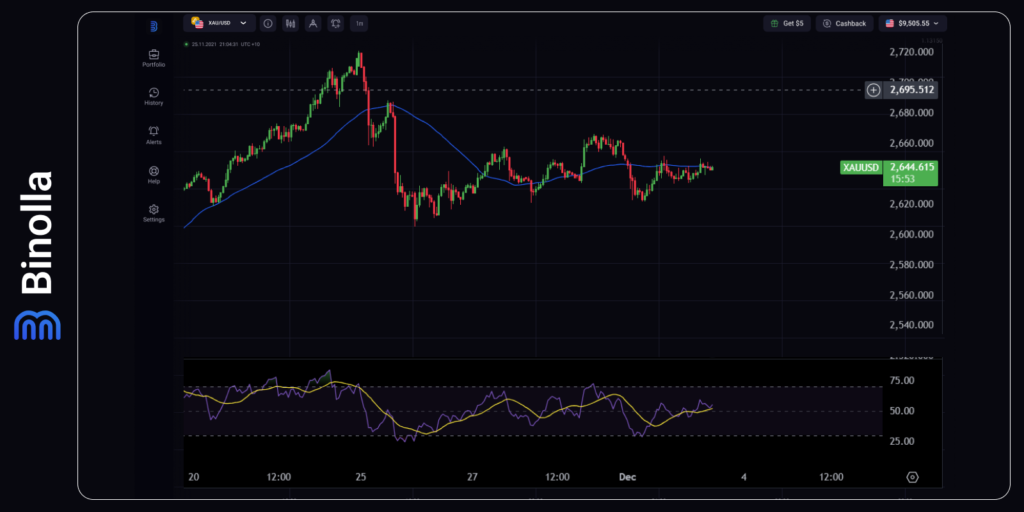
Technically, Gold is trading within a horizontal range with no clear direction. XAU/USD is located right below the SMA50, which means that bears are still in control, but the range includes the SMA50 and the price is capped at 2.660. If gold fails to break above the SMA50, then it is likely to move downwards to test 2,640 and then 2,620.


