The US Dollar Gains Momentum After the Better-than-Expected US Labor Market Data

The US labor market data released on Friday was better than expected, which supported the US dollar. The Fed now has more space before the next interest rate cut as the labor market is recovering. The next important data set will be released this week. Market participants anticipate the US inflation data as it can provide guidance to any further monetary policy changes.
Will the US dollar continue its rally? It depends totally on the inflation figures now. If CPI indexes show that the price dynamics continue to slow down, then the possibility of the next round of interest rate cuts will increase. Otherwise, the US dollar will likely resume its uptrend.
Contents
EUR/USD Technical Review
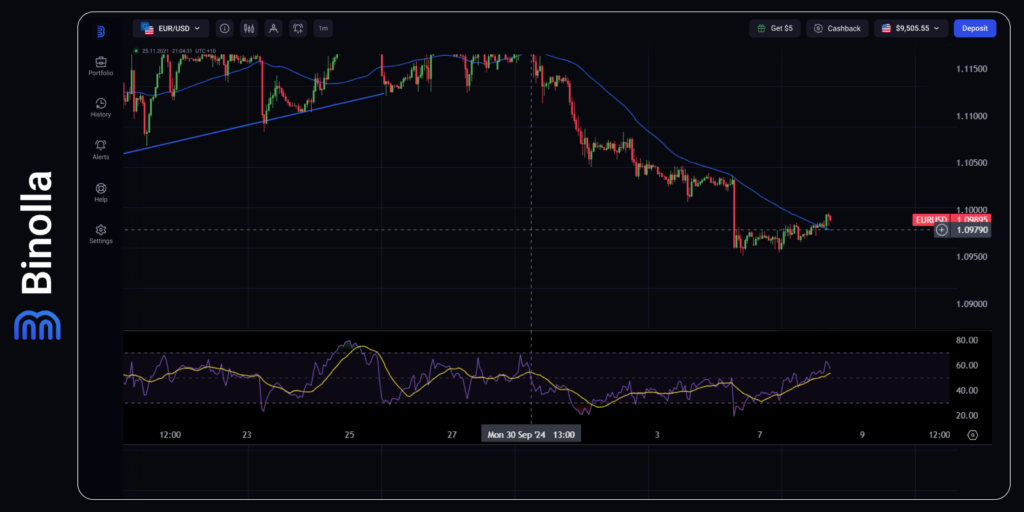
The currency pair develops the downtrend currently as it stays below the SMA50. After testing the dynamic resistance on Friday, October 4, EUR/USD resumed the downtrend as the US labor market data was better than expected.
When it comes to the RSI indicator, the line is moving towards 70 as an upside correction is currently developing. However, if no important shifts in fundamentals take place, EUR/USD is expected to make another downside movement after breaking 1.0950, which is the closest support level at the moment.
The closest target for another leg of the downtrend will be at 1.0910, while in case if EUR/USD breaks the downtrend and begins to rise, the closest target will be at 1.1034.
GBP/USD Technical Analysis
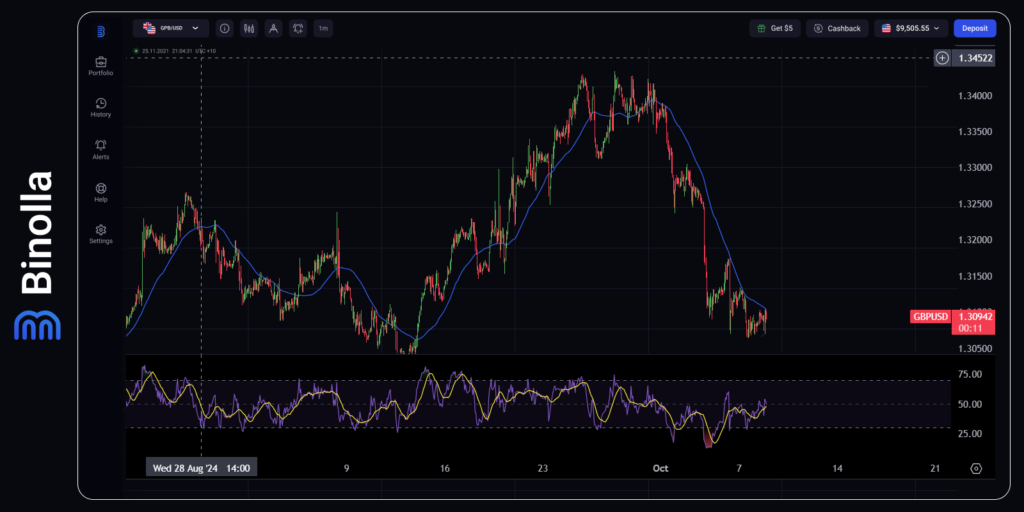
GBP/USD is trading below the SMA50, which indicates that the currency pair is in a downtrend currently. The asset has tested the descending dynamic trend line several times but still stays below it. The RSI indicator moves below 50 but is likely to break this level and reach the overbought area from where a correction may begin.
The closest support level is at 1.3060, which means that here buyers are still powerful, while sellers currently can’t break below. However, the next test of this level may allow bears to break lower and reach 1.3030, which is the next support level.
On the upside, 1.3105 acts as the closest resistance level. It aligns with the SMA50 and if GBP/USD manages to break it and move higher, the next resistance level will be at 1.3130. Moreover, if the breakout takes place, the currency pair may begin an uptrend.
AUD/USD Technical Review
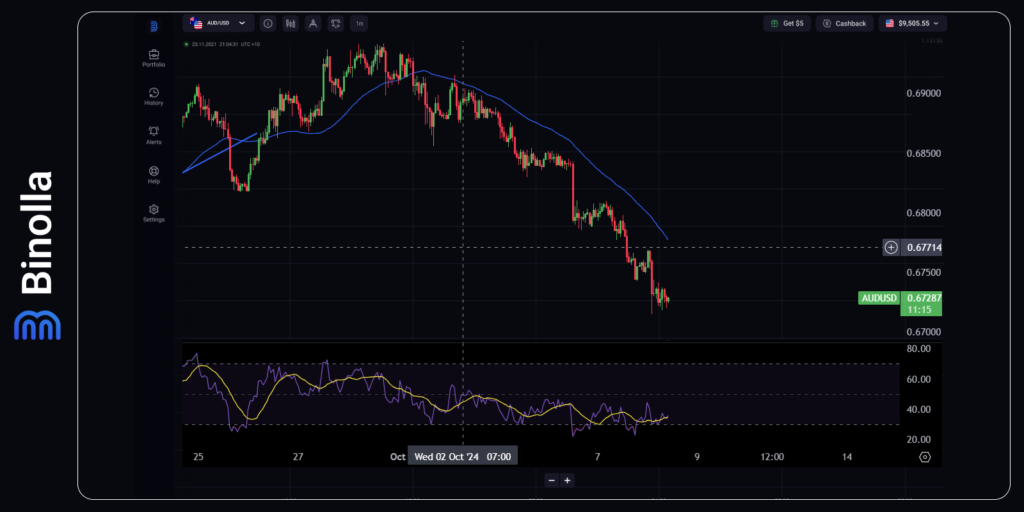
The currency pair develops the downtrend that was initiated on the first day of October. Currently, AUD/USD fluctuates below the SMA50, which indicates that the downtrend is developing. The RSI is neutral and below 50.
The closest support level is at 0.6724, which prevents the currency pair from plunging lower. The next support level is at 0.6700, which is a round number. On the upside, 0.6737 prevents the currency pair from moving higher. If bulls manage to move it to the SMA50 and even break it, AUD/USD is likely to start an uptrend. However, current fundamentals favor the US Dollar and we expect the currency pair to resume its downtrend from current levels or from SMA50.
XAU/USD Technical Review
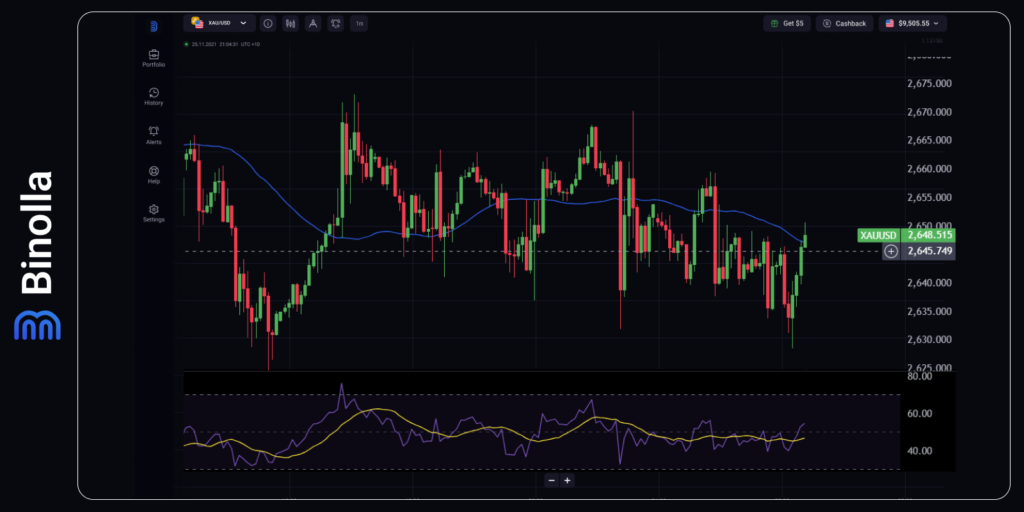
Gold is trading sideways as there is no current trend. The SMA50 is neutral without a clear direction. XAU/USD is testing the SMA50 and if this testing is successful, an uptrend may begin. The RSI indicator is also neutral, which means that there is no trend currently.
The current support level is at 2,633. On the downside, the next support level will be at 2,625. On the upside, traders can wait until the price breaks above 2,651. In general, Gold is under pressure as the US dollar may move higher due to the latest US labor market data.
Bitcoin Technical Analysis
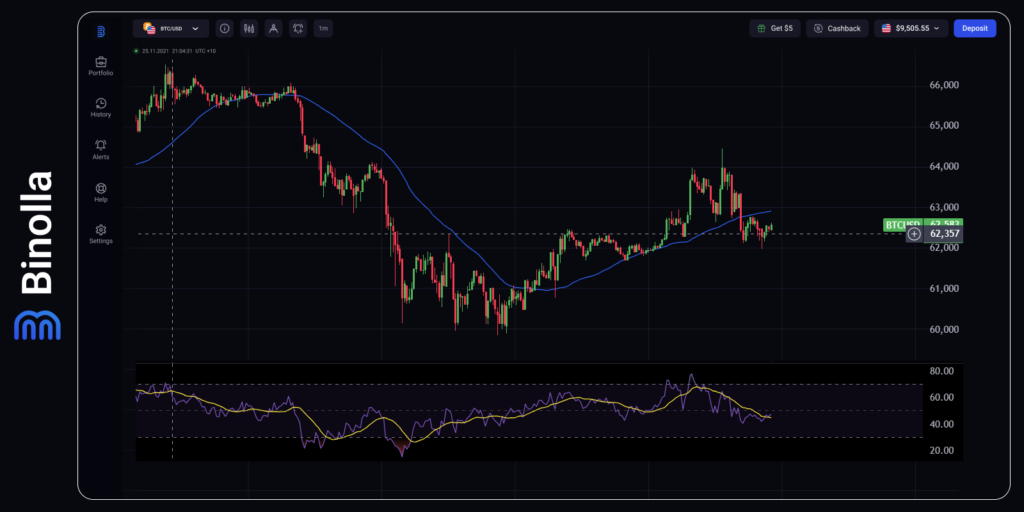
Bitcoin was trading in the uptrend until BTC/USD broke below the SMA50. Currently, the currency pair stays below the SMA50, which means that there is a possibility of a market shift. The RSI indicator moves lower and is testing 50 currently.
On the downside, the closest support level is at 62,160. This level protects the next support at 61,690. On the upside, Bitcoin faces 62,750, which is the closest resistance level. The next one is located at 63,770.


