The US Dollar Continues to Plunge Amid the Fed Decision

The Fed decided to cut rates by 50 bps last week which increased pressure on the US Dollar. Moreover, the Federal Reserve seems to be looking for more opportunities to extend its expansionary steps this year as the inflation rate is stable and close to the FOMC targets.
The key macroeconomic indicator to watch this week is the US Core PCE price index, which is expected to remain unchanged at 0.2%. The markets are likely to not react to this data if the final readings meet the forecast. However, this inflation indicator may have a long-term influence on USD as stable inflation will allow the Fed to make further expansionary steps.
Contents
- 1 EUR/USD Is Trying to Push Higher
- 2 GBP/USD Targets New Levels After the Fed and BoE Meetings
- 3 Market Movements Create Opportunities—Will You Take Them?
- 4 AUD/USD Is in the Uptrend after the RBA Decision
- 5 XAU/USD Makes New Highs, But a Correction is Possible
- 6 Bitcoin Is Trading Sideways, But the Upside is Possible.
EUR/USD Is Trying to Push Higher
The currency pair is moving along the trendline with the initial point at 1.1000, which started last week. Currently, EUR/USD is testing the trendline and if the latter keeps the price from moving lower, the currency pair is likely to resume its uptrend.
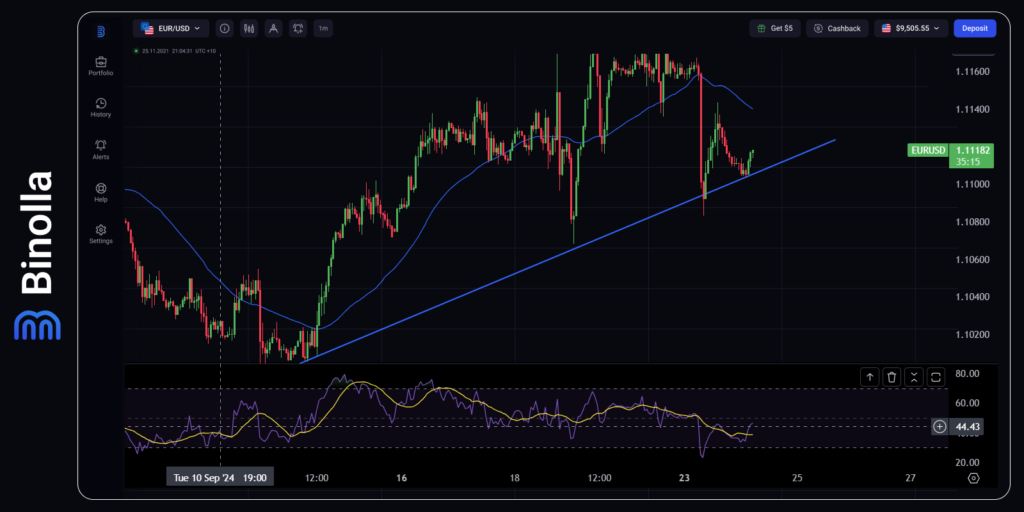
EUR/USD hourly chart
The currency pair stays below the SMA50, but it is likely to test it shortly. The closest resistance is at 1.1132 and EUR/USD is likely to test it today. When it comes to RSI, it is still neutral as the indicator is above 30. The average yellow line of the indicator moves downwards.
On the upside, the target is 1.1180, which will open the way to the 1.1200 round level. On the downside, if the currency pair breaks below 1.1100, EUR/USD will likely target 1.1000 through 1.1092 and 1.1082.
GBP/USD Targets New Levels After the Fed and BoE Meetings
The Bank of England left the rate unchanged last week with only one voting member supporting the rate cut. This event provided additional support to GBP as the Fed cut rates by 50 bps last week.
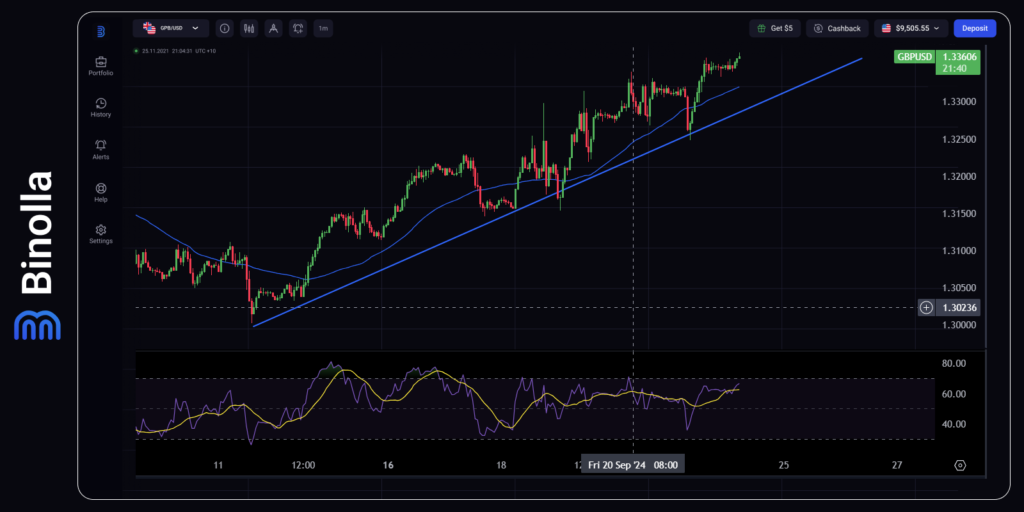
The currency pair is currently trading above the ascending trendline and the SMA50, which means that GBP/USD is targeting higher levels. The ascending trendline was tested yesterday and then the price moved higher to the local extremes at 1.3365, which is the resistance area at the moment. The RSI stays close to 70, which means that a correction is likely to occur shortly.
On the upside, we have the resistance area at 1.3365 where the price is fluctuating at the moment. By breaking it, GBP/USD will be able to test 1.3400, which is a round number. On the downside, 1.3325 is the closest support area. If the currency pair manages to break it, the next support will be at 1.3260.
AUD/USD Is in the Uptrend after the RBA Decision
The Reserve Bank of Australia has decided not to make any changes to the monetary policy today. It should be mentioned that AUD/USD is supported by the Fed’s decision to cut rates by 50 bps.
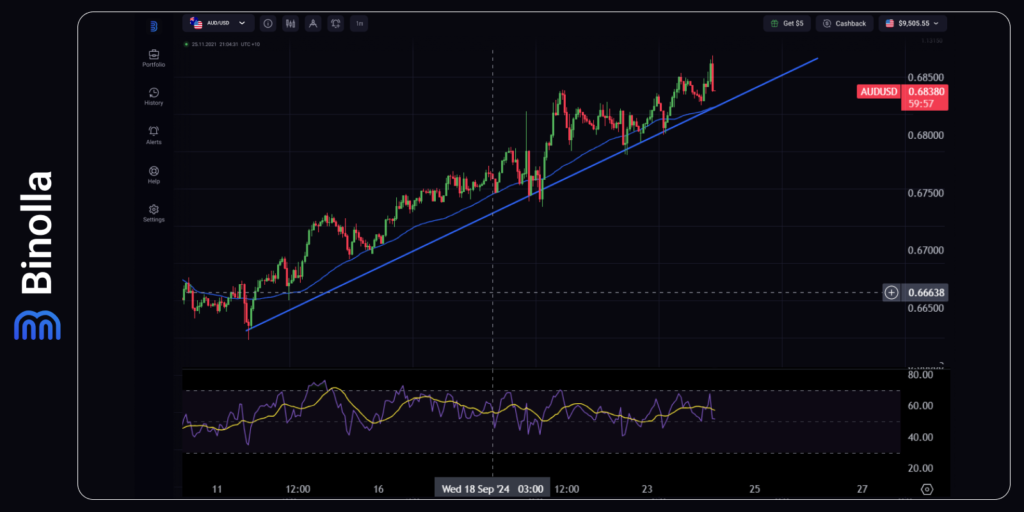
The currency pair stays above the ascending trendline and the SMA50. The uptrend is also confirmed by the position of the RSI indicator, which is above 50. AUD/USD can test the ascending trendline shortly and if the trendline keeps the price from moving lower, the closest target will be at 0.6860.
On the upside, the currency pair will target a 0.6900 round number if it manages to break above 0.6860. On the downside, the currency pair is testing 0.6824, which lies at the trendline. If it manages to break the line, then AUD/USD is likely to test 0.6800, a round level. The RSI indicator is below the overbought area and shows no signals currently.
XAU/USD Makes New Highs, But a Correction is Possible
The Fed’s decision to cut rates last week provided support to Gold. The price of precious metals saw new highs, but the uptrend was unstable as the market participants anticipated news from the Federal Reserve about the possibility of further expansionary decisions.
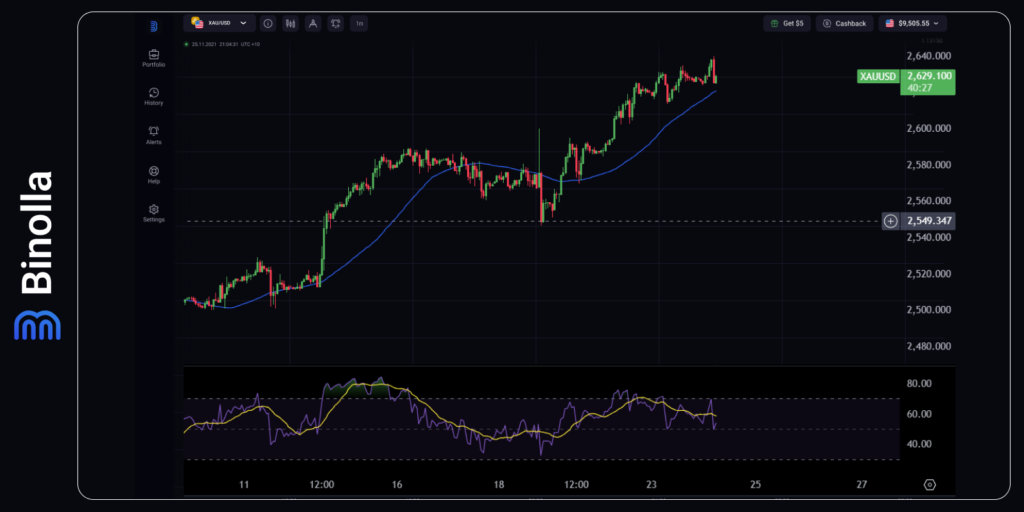
After reaching the new extremes, XAU/USD moved downwards to test the SMA50. As you can see, the price is currently close to the moving average and the RSI is sloping downwards, Moreover, there is a bearish divergence between the RSI’s yellow moving average and the price, which is signaling the upcoming downside correction.
On the upside, the resistance level is at 2.640. The price is above the SMA50, which means that the uptrend is developing. However, if it breaks below 2,625, XAU/USD is likely to have a deeper correction targeting 2,615 and then 2,590.
Bitcoin Is Trading Sideways, But the Upside is Possible.
BTC/USD is trading within a narrow range currently after a long uptrend that started on September 6. After the Fed meeting that took place last week, Bitcoin surged again, but currently, the uptrend has stopped and the currency pair is trading sideways.
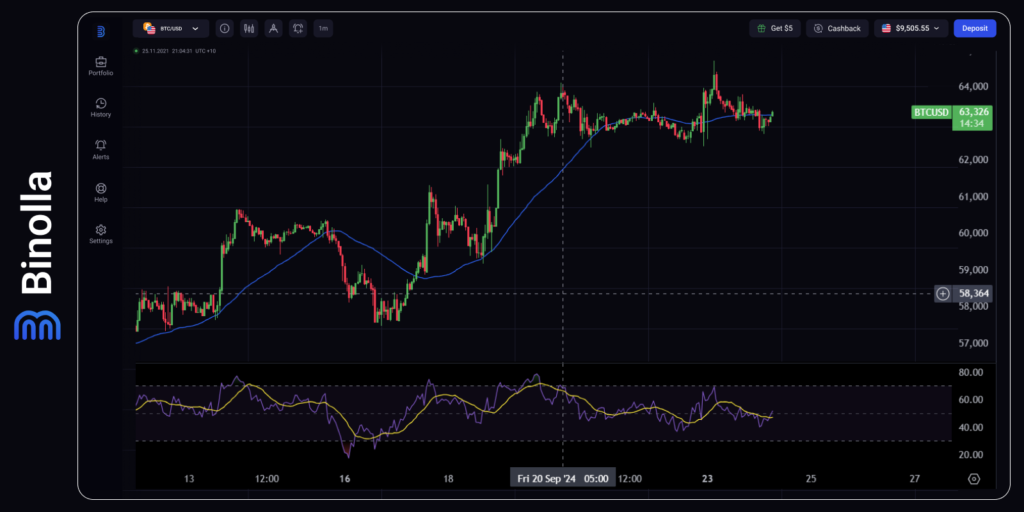
Technically, Bitcoin still has some space to move higher as it will be supported by the anticipation of further Fed expansionary steps. The SMA50 is neutral currently, which means that there is no trend at the moment. However, we expect BTC/USD to test 64,340 today and try to move higher.
On the other hand, the RSI indicator is sloping downward, which means that the sideways movement is able to continue for a while.


