The Shooting Star Pattern: Secrets and Strategies for Successful Trading This Candlestick Formation

The shooting star is among the simplest trading patterns so far, allowing market participants to catch downside reversals and capitalize on them. This formation is among the most popular ones as it has clear conditions and entry rules, which makes it a good strategy for both beginner and professional traders. In this article, we delve into the specifics of this trading pattern. You will learn more about the basics of the formation and discover some interesting strategies that will help you master it in trading.
Start using the shooting star pattern and other strategies when trading with Binolla. Join the brokerage company now!
Contents
- 1 Key Takeaways
- 2 Shooting Star Basics
- 3 Psychological Aspect Behind Shooting Stars
- 4 The Shooting Star vs Inverted Hammer
- 5 The Shooting Star Pattern and Forex Trading
- 6 The Shooting Star Pattern and Digital Options Trading
- 7 Start using this indicator in your trading sessions!
- 8 The Shooting Star Strategies
- 9 Trading the Shooting Star Pattern Alone
- 10 Combining the Shooting Star Pattern with RSI
- 11 Trading the Shooting Star Pattern with the Ichimoku Indicator
- 12 The Shooting Star Pattern Recommendations
- 13 Conclusion
- 14 FAQ
Key Takeaways
- The shooting star is a candlestick pattern that tells market participants that the price can reverse after the uptrend;
- The pattern can be both red and green;
- The shooting star pattern should not be confused with the inverted hammer;
- To be sure about the reliability of the pattern, check whether it is located close to the resistance level;
- The basic strategy allows you to use the pattern without adding any technical analysis tools to the chart;
- Always use risk and money management strategies to trade with the shooting star pattern.
Shooting Star Basics
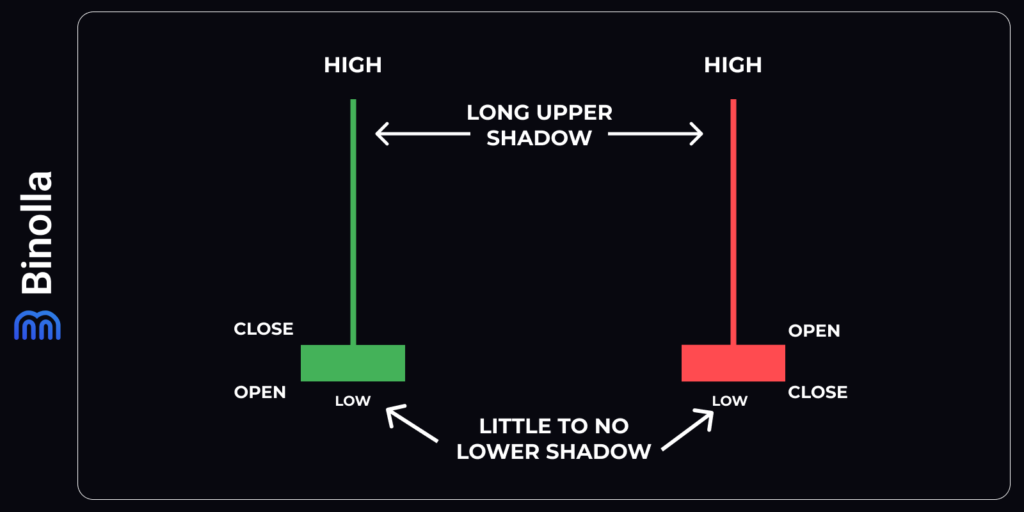
The shooting star pattern is a candlestick formation with a small body and a long wick. Unlike the hammer pattern, this one tells traders that the market is likely to reverse downside or will at least start a downside correction. The shooting star can be of both colors. In a classic candlestick palette, these are black and white, but as we are using green and red, they can be either red or green.
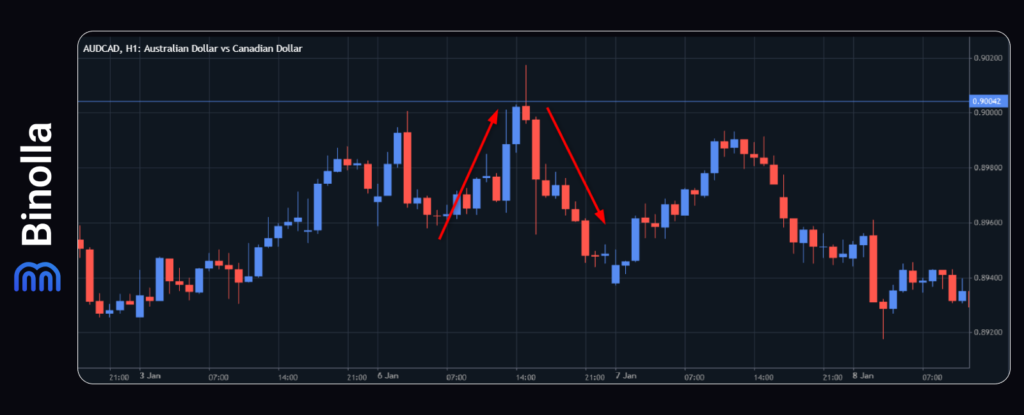
Shooting stars have two basic rules that you should know before you can start using them:
- This candle appears right after the uptrend. This is a very important rule that helps traders identify the shooting star. If it appears somewhere at the bottom of the market, then this is an inverted hammer pattern, and mirror trading strategies should be applied;
- The shooring star formation should always be on the resistance level. If not (it can appear in the middle of the uptrend), this can lead to false signals, and the price may continue its upward movement after the shooting star is closed.
A Trading TIp from Alan – Top Trader at Binolla
I highly recommend using only the red shooting star pattern, as it demonstrates that the reversal has already taken place. The candlestick closes below the opening level, which means that bears have already taken control. The position of the formation can vary, but it should be close to the resistance level. I understand that finding an ideal position is almost impossible and is unnecessary. Most red shooting star patterns that pierce the resistance level or are positioned close to it can be traded.
Psychological Aspect Behind Shooting Stars
Like any other candle pattern that you will find on charts, the shooting star can tell you more about the price movement and the balance between buyers and sellers. The upside tail is an attempt by buyers to push the price higher. However, they fail at some moment and the price moves lower and closes slightly above or even below the open level.
What is important here to understand is that the shooting star shows the change in market sentiment. It should be mentioned that the position of the pattern, which is close to the resistance level, is a kind of confirmation. The bulls failed to maintain the uptrend through the resistance area. Therefore, the price reverses and moves lower.
The Shooting Star vs Inverted Hammer
Before delving into strategies that you can use when trading Forex or digital option contracts with the shooting star pattern, it should be mentioned that this formation has a lot in common with the inverted hammer. Both have a small body at the bottom and a long upside wick. However, there is one thing that you should know that will help you distinguish the formations and not get confused.
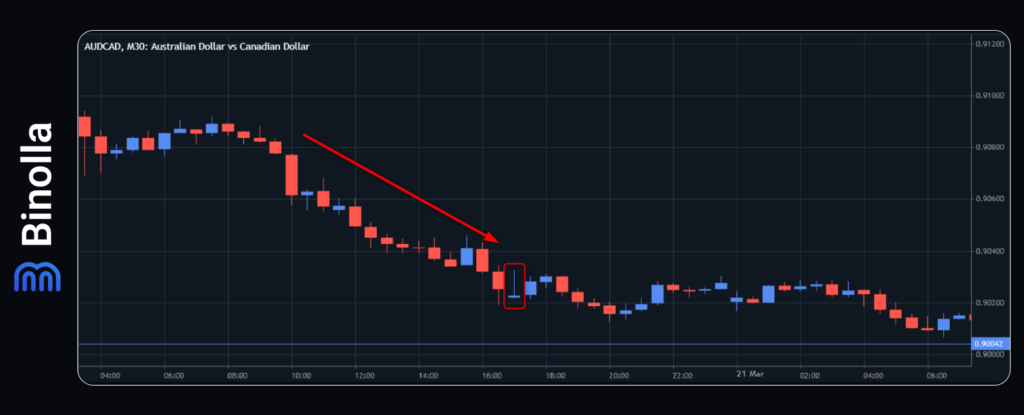
The shooting star is formed at the top of the market. To consider it a reliable pattern, you should check whether it is close to the resistance level or even pierce it. When it comes to the inverted hammer, this pattern can be found at the support level at the bottom of the market.
The Shooting Star Pattern and Forex Trading
The shooting star pattern is a reliable formation that can be used by Forex and stock traders. It allows market participants to find reversals and capitalize on them. Apart from providing traders with entry points, this pattern can be used to set stop losses. Some risk and money management strategies suggest that you can use the upper point of the candle to set stop losses.
A Trading Tip from VIhaan – Top Trader at Binolla
According to some classic money and risk management rules, you can place stop losses above the tail of the shooting star pattern. However, you should keep in mind the size of the wick. I saw a lot of shooting star formations that had long tails (especially in Bitcoin, where the tail can reach several thousands of US dollars). This means that you have set even higher goals and lowered your position size considerably.
What I recommend at this point is that you use the classic risk/reward ratio approach. I use the 3-to-1 ratio, which means that I expect 3 pips of profit per one pip of risk. For instance, if I expect 60 pips of profit, I can risk no more than 20 pips per such trade.
The Shooting Star Pattern and Digital Options Trading
Traders can equally use this formation to buy digital option contracts. The idea is the same. Once you see this pattern on charts, you can expect that the price will reverse and move downward. Therefore, the strategy is to buy a Lower contract after the pattern is formed on the charts.
The Shooting Star Strategies
While the shooting star pattern provides signals even when used solely on charts, there are several methods that allow you to augment your strategies and improve your trading results. Some of the basic ones can be found in the following paragraphs.
Trading the Shooting Star Pattern Alone
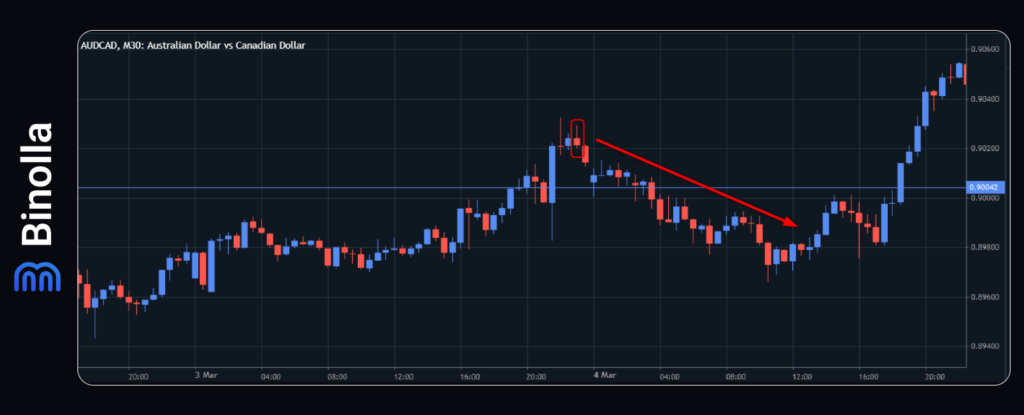
The first strategy is to use the shooting star pattern alone without adding any other tools. As you can see in the example above, after the formation appears, the price moves downwards. The signal comes when the candle closes. Therefore, you can buy a Lower contract or sell an asset at this moment.
Let’s check some more examples of the shooting star pattern.
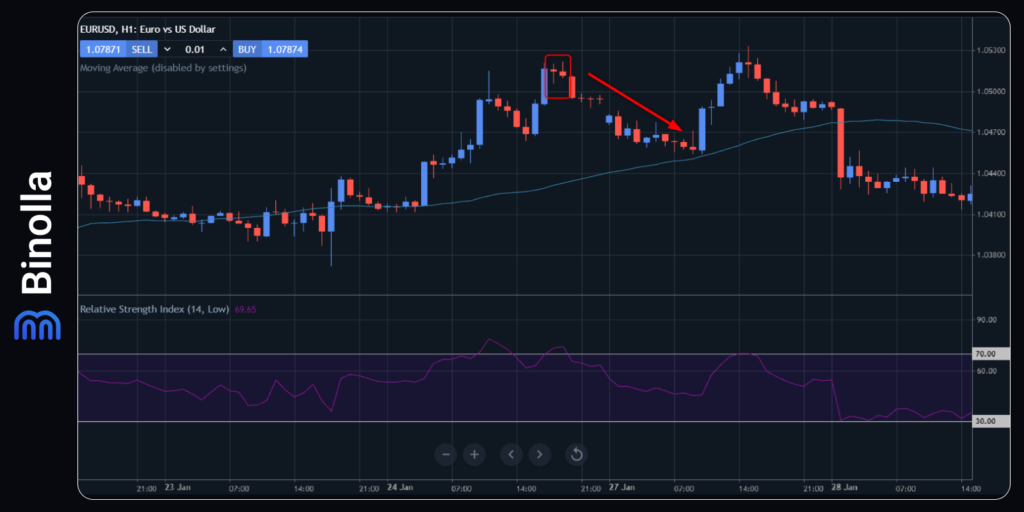
This is a very interesting example as it combines the doji pattern and the shooting star formation. The signal comes after the shooting star candle closes. However, you can expect this signal in advance after the red doji candle.
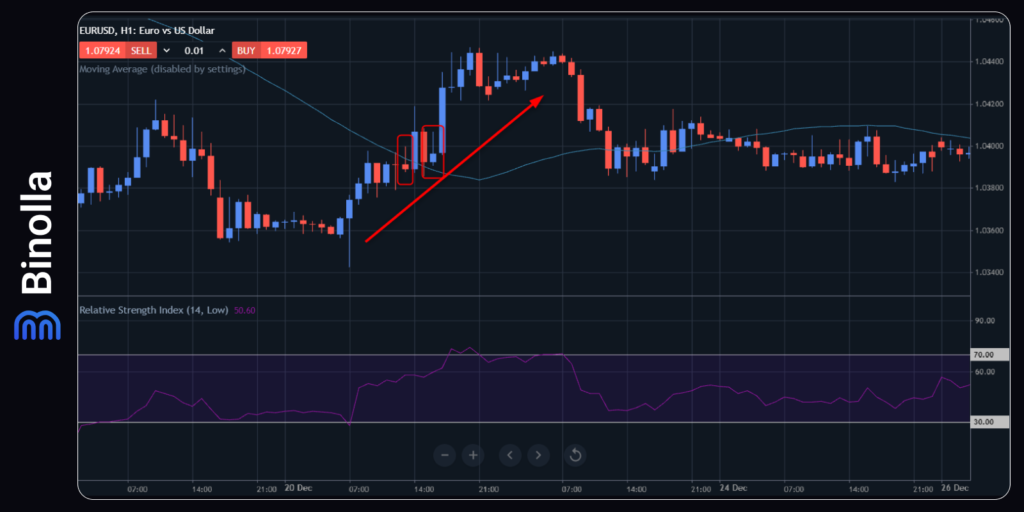
Not all shooting star patterns are good enough for trading. In some cases, you will find fake ones. First of all, even if this pattern is reliable enough, not all shooting stars work well. In this particular example, you can see two of them close to the dynamic resistance level. However, none of these shooting star formations led to a reversal. What is important here is to add another indicator for signal confirmation. For instance, you can use RSI or other momentum indicators to see whether the asset is overbought or not at the moment when the shooting star appears. If it is overbought, then the chances of making profit are significantly higher.
A Trading Tip from Andy – Top Trader at Binolla
I prefer this strategy for its simplicity and reliability. However, before using it, you should know that there are two ways of using it. What is described above is a classic strategy that works once the candlestick closes. What I suggest here is to start trading when the next candle breaks that lower point of the shooting star pattern.
The method I suggest is more effective as by using it, you can have a confirmation of the reversal. While there is still no 100% guarantee, the chances of profiting with this method are significantly higher. The only drawback of this conservative approach is that when you use it in Forex or CFD trading, you will lose some points that you could gain if you start right away, especially if the price moves higher for some time before moving downwards.
Combining the Shooting Star Pattern with RSI
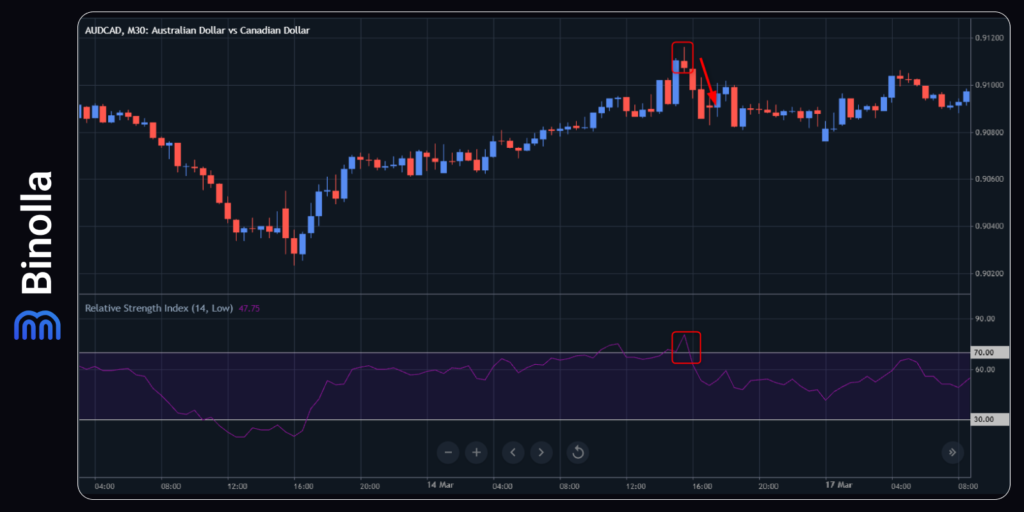
Using the shooting star alone can be effective, but you can also augment this strategy with some technical indicators. The RSI here is among the best choices as this technical analysis tool is often used by traders to pinpoint reversals. Therefore, you can double-check your candle pattern signal and be more sure about the decision you are going to make.
The idea of this strategy is simple. After you meet the shooting star pattern at the resistance level, you should check the current status of the RSI indicator. It should be above 70/80 and then leave the overbought area. At this moment, you can buy a Lower contract or sell an asset (currency pair, stock, cryptocurrency, and others).
A Trading Tip from Fernando – Top Trader at Binolla
I highly recommend this particular strategy as I use it most of the time. What I like about it is that I can have double confirmation of the signal coming from the shooting star pattern. Moreover, I often open positions even if the price only touches 70/80 without going above this level. However, if the RSI line stays below 70/80 and does not touch it, then I prefer to wait as the upside movement may continue. If you prefer a more conservative approach, you can wait for the RSI indicator to move above 70/80 and open the position when the indicator moves below again and the next candle closes there.
Trading the Shooting Star Pattern with the Ichimoku Indicator
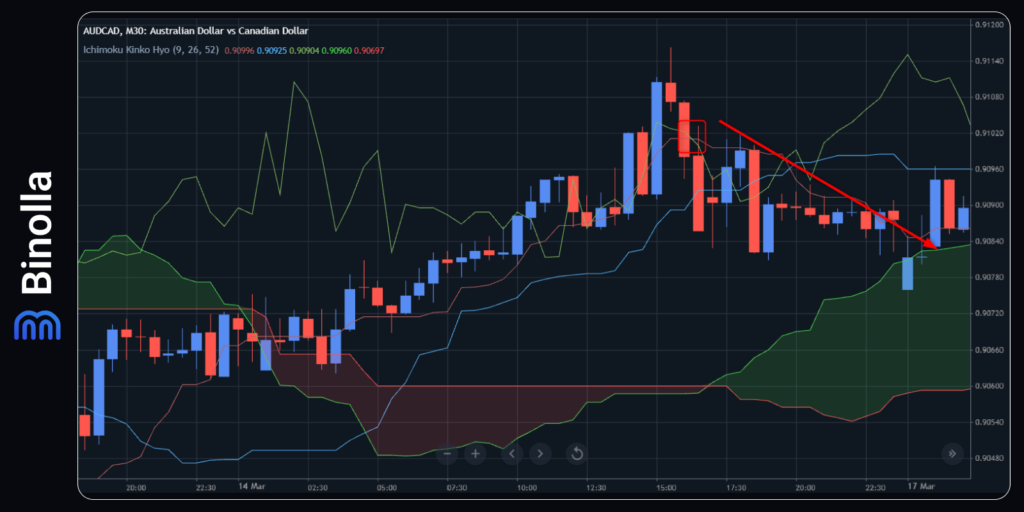
The next method allows you to combine the shooting star pattern and an indicator, allowing you to find a reversal. Here you will use two lines of the Ichimoku indicator – Tenkan and Chikou span. The idea is to buy a Lower contract or to sell an asset when the shooting star pattern candle closes and there is a crossover of both lines.
A Trading Recommendation from Muhammed – Top Trader at Binolla
I saw this strategy long ago, and I use it sometimes when market conditions allow it. The idea here is not only about the crossover but also about the position of the Chikou span. In the example above, the Chikou span is far above the Ichimoku Cloud, which means that at least a downside correction may occur. However, I would recommend this strategy to those traders who have already had some previous experience as the Ichimoku indicator is a complex system that requires understanding its main features before starting to use it.
The Shooting Star Pattern Recommendations
Now that you know some basic strategies, you can start using the pattern. However, before placing your first trade, read some of my recommendations to improve your trading results:
- Choose only key resistance levels. While the shooting star may appear at different resistance levels, I suggest using only those that have had several confirmations. A strong resistance level is an area where the price stalls for a long time without the possibility of moving higher. To understand whether the level is strong or not, you can simply check the history. Also, round numbers, as well as psychological levels, are strong most of the time;
- Check the trend. Before using the shooting star, check the previous trend. As I mentioned in this article, the pattern appears after the uptrend, which means that every time you see a candle that looks like a shooting star, check the previous price movement to confirm it;
- Check market context. When using the shooting star pattern in trading, you can watch the broader market context. Use the economic calendar to see the events that may cause price reversal. This will help you confirm the signal and make informed decisions in trading;
- Monitor different timeframes. When trading the shooting star pattern, I always check the situation on various timeframes to understand whether the signal is confirmed by major market trends. For instance, if the shooting star forms on the hourly chart but there is a strong uptrend on the 4-hour chart, then the following downside price movement can be nothing more than a simple correction, and the price will resume the uptrend after a while. This is especially important for CFD traders who aim to capitalize on larger price movements instead of catching several pips;
- Know how to manage your risks in trading. Whatever strategy you use, you can’t be 100% successful in all trades you open. With years of trading experience, I can say that even the most visually reliable patterns fail in some situations. Therefore, instead of completely trusting them and investing large amounts in a single trade, market participants should allocate their funds according to their risk and money management systems.
Conclusion
The shooting star pattern is a reliable trading formation based on the Japanese candlestick concept. It consists of a small body and a long wick at the top and demonstrates that the market can switch direction from upside to downside. To trade with the pattern, you can use a variety of strategies, including those with technical indicators.
FAQ

Is Shooting Star a Bullish Pattern?
No, the shooting star is a bearish pattern telling traders that the upside tendency is over and a downside trend may occur.
Can This Pattern Be Bullish?
No, the shooting star is only a bearish pattern. However, there is a similar candle known as the “Inverted hammer”, which is a bullish signal. The difference between them is that the shooting star is formed at the resistance level, while the inverted hammer can be found at the support level only.
Can a Shooting Star Be Green?
Yes, a shooting star can be either green or red.
How Rare is a Shooting Star?
This depends on the market context and current situation. The pattern is frequent, which means that you will find a lot of shooting star formations on minute charts.

