The Most Profitable Candlestick Patterns: How to Spot and Trade Them

Candlestick patterns are very popular nowadays due to their simplicity and the possibility of using them independently from other technical analysis tools. The method was created in the 18th century in Japan, and it is still relevant, allowing market participants in the 21st century to try to get inside the market sentiment and outplay it. In this article, you will learn more about the most profitable candlestick patterns. We’ll show you how to spot them and use such formations.
Looking for a reliable trading platform? Join Binolla and start using these most profitable candlestick patterns right now!
Contents
- 1 Key Takeaways
- 2 Candlestick Pattern Basics
- 3 How to Trade with Candlestick Patterns: A Step-by-Step Guide
- 4 Why Do Candlestick Patterns Work?
- 5 Avoid False Candlestick Patterns
- 6 The Most Profitable Candlestick Patterns
- 7 Practice trading with these patterns!
- 8 Strategies to Trade The Most Popular Candlestick Patterns
- 9 Common Mistakes that Traders Make When Using the Most Popular Candlestick Patterns
- 10 Conclusion
- 11 FAQ
- 11.1 Are Candlestick Patterns Reliable Enough?
- 11.2 Which Patterns Are the Most Profitable?
- 11.3 Can I Apply Candlestick Patterns with All Assets?
- 11.4 Which Timeframes Are Best for Using Candlestick Patterns?
- 11.5 Can I Use Indicators with Candlestick Patterns?
- 11.6 Can a Beginner Trader Use Candlestick Patterns Effectively?
Key Takeaways
- The most profitable candlestick patterns frequently appear on charts.
- When trading such patterns, you need to check the market context.
- Traders often use technical indicators to empower their strategies.
- Place stop losses above the resistance level and below the support level when trading with the most profitable candlestick patterns.
- Always use the context before trading with a specific candlestick pattern.
Candlestick Pattern Basics
A candlestick pattern is a visual price formation that is created by the price movement over a specific period. Each candlestick represents the following data:
- Open price
- Highest price
- Lowest price
- Close price
A standard candlestick has a body and wicks. The body represents the range between the open and close prices. When it comes to the tails, they show the maximum and minimum price of the asset for a specific period. One or several candlesticks can form special patterns that help traders understand the market sentiment.
There are two types of patterns in trading – reversal and trend continuation. The first is more popular and even powerful, especially for those who trade digital options. This is due to the fact that they provide traders with clear trading opportunities when the market is correcting or reversing.
Candlestick patterns can be used in isolation. However, most traders add various tools to confirm trading signals. The most popular strategies are based on the combination of candlestick patterns and support/resistance levels.
How to Trade with Candlestick Patterns: A Step-by-Step Guide
Those who are new to trading with candlestick patterns can be confused at first. However, there is nothing difficult about using them. We have prepared a detailed guide on how to apply this method to your trading strategies:
- Learn the most popular and profitable candlestick patterns. This article represents some of the most frequent models that will help you make your first gains in the financial markets.
- Open the chart and identify the trend. Now your task is to find which price movement direction prevails. This is necessary to see the market context.
- Switch between timeframes to find a signal. You should pick a timeframe that provides a reliable trading signal at a specific moment.
- Draw levels. Once you have identified a pattern, you should understand whether it is located on a key level or not. Use only these patterns that are close to support and resistance levels.
- Use confirmation tools. The best strategy is to confirm every candle pattern with technical indicators like RSI to make more informed decisions.
- Set Stop Losses. Protect your risks in every trade by placing Stop Losses.
- Review your every trade and work on your mistakes.
Why Do Candlestick Patterns Work?
Candlestick patterns demonstrate the current market sentiment and the psychology of both bulls and bears. For instance, if you have a candle with a long upside tail and a small body, it tells you that buyers are exhausted and the reversal may come soon.
When the body of a red candle is engulfed by the body of a bigger green candle at the support level, this means that buyers are taking over with aggressive buying, and the price may continue to grow in the future.
Technical indicators derive from price. Candlesticks are the price. They tell you more about current and future market movements than any other tool. However, you should keep in mind that using candlesticks solely is risky. You should learn the market context and understand major price movements to succeed.
Avoid False Candlestick Patterns
False candlestick patterns are a common mistake that most beginner traders make when they start using Japanese candlesticks in their analysis. These formations may look like true ones, but they trap traders and provide them with false information about the upcoming price movements.
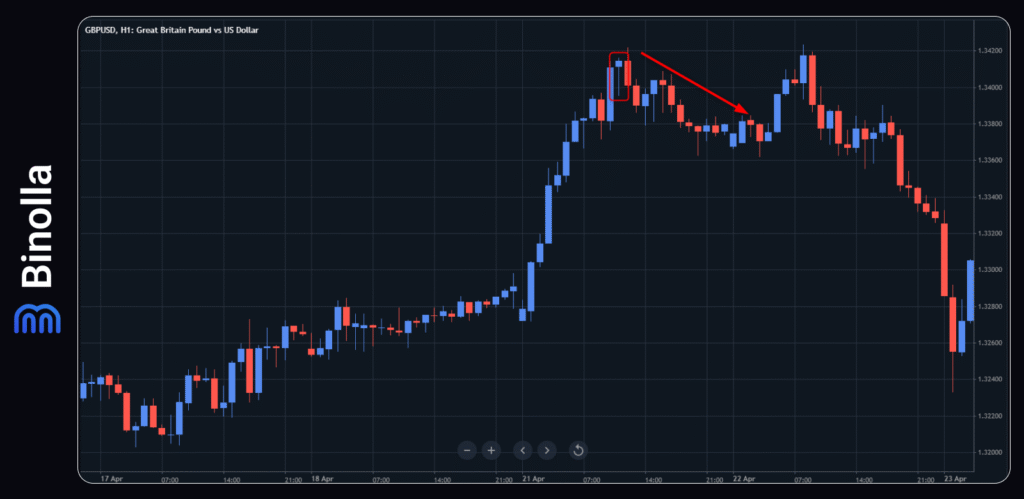
The most frequent mistake that many beginners make is that they try to trade such patterns without the context. Look at this beautiful hammer in the image above. It is formed at the top of the market, which means that you should not treat it like a hammer pattern.
This one is called hanging man, and it tells a trader that buyers can’t push higher and a correction or a full-fledged reversal is around the corner. To succeed in trading with the most profitable candlestick patterns, you should be on guards and learn not only how these models look like, but also where they are located on charts.
The Most Profitable Candlestick Patterns
The most profitable candlestick patterns are time-tested. Many traders have used them for decades and revealed that they are reliable and trustworthy. Here are some of the best formations that are used by professional market participants.
1: Bullish and Bearish Engulfing
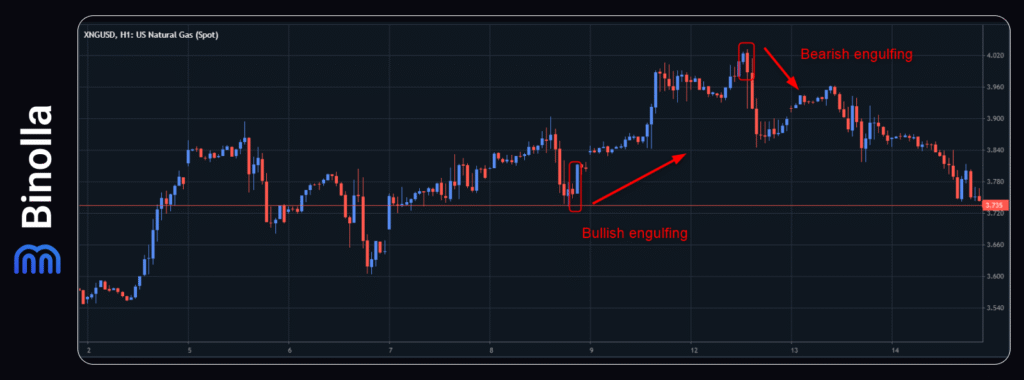
Bullish and bearish engulfing patterns are among the top priorities when it comes to the most profitable candlestick formations. Both comprise two candlesticks. The bullish engulfing pattern consists of a bearish and a bullish candle, with the second engulfing the body of the first. If you see this combination on the chart, you can buy or purchase a Higher contract once the second candlestick of the pattern closes.
One of the secrets of using this pattern is that it should be located at the support line, not in between levels. The stop loss in this case can be placed below the support line at some distance. For instance, you can protect your risks by cutting them below the lowest point of the first candle in the pattern.
The bearish engulfing, as you may guess, can be found at the top of the chart, testing the resistance level. This formation includes a bullish candle and a bearish one. The second should engulf the body of the first. Once this pattern appears and the second candle closes, you can sell the asset or buy a Lower contract.
CFD traders try to protect their risks by placing stop losses. In this particular case, you can place a stop loss above the highest point of the first bullish candle.
2: Hammer and Inverted Hammer
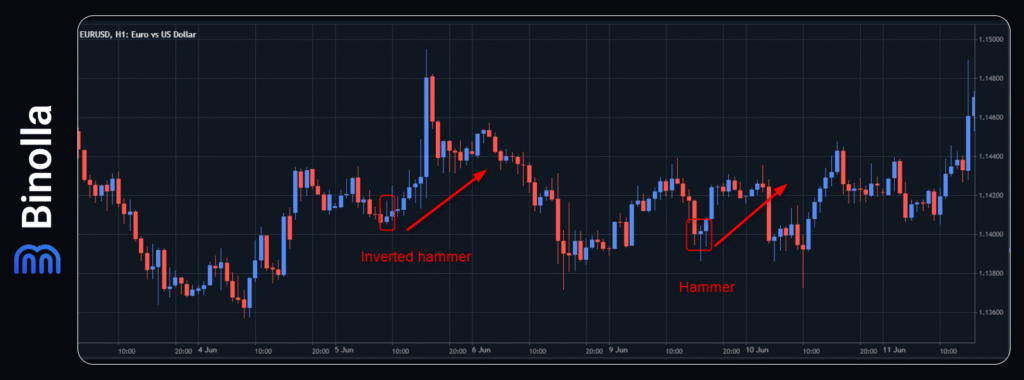
The next most popular patterns that should be considered are hammer and inverted hammer. Both are formed at the support level. The hammer pattern is a single candlestick with a long downside tail and a small body. The inverted hammer pattern has a long upside tail and a small body.
Once you spot any of them, you need to wait until the candle closes and buy an asset (or purchase a Higher contract if you trade digital options). There is also a less aggressive strategy that suggests opening a trade when the price breaks above the highest point of a hammer or an inverted hammer.
The stop loss can be placed below the lowest point of both patterns. Keep in mind that if the hammer tail is too long, you can place a stop loss depending on your risk-to-reward ratio.
3: Shooting Star and Hanging Man
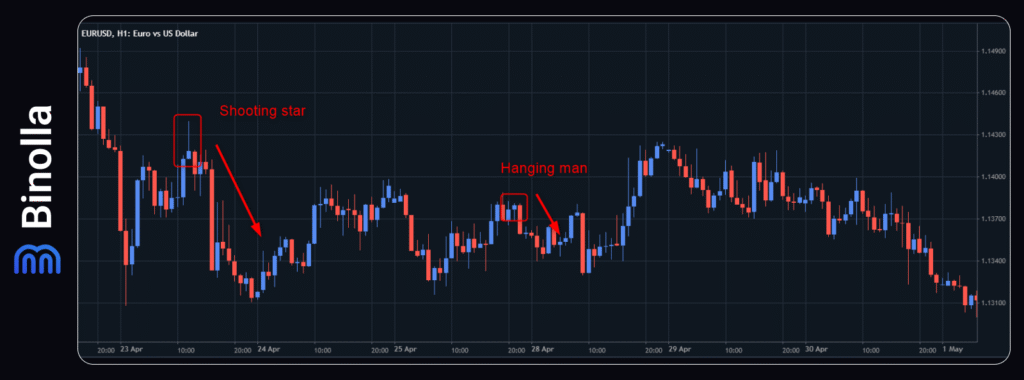
These patterns can be found at the top of the market. Both signal that the price is likely to reverse in the near future (or at least a correction is going to happen). The shooting star pattern is a candlestick with a long upside tail and a small body at the bottom, while the hanging man pattern is a candlestick with a long downside tail and a small body at the top.
Once you spot them, you need to wait for the candle to close to sell an asset or buy a Lower contract. A less aggressive strategy suggests opening a trade when the second candle breaks below the minimum level of the pattern.
4: Doji
An example of a doji pattern in trading
The next popular candlestick pattern is the doji. It is known for having no body and tails on both sides. While a doji is a pattern of uncertainty, when it appears at the support or resistance levels, traders can expect the price to reverse.
A doji that appears at the top tells a trader that they can sell an asset or buy a Lower contract. Conversely, a doji at the bottom of the market suggests that a market participant can buy an asset or open a Higher trade. Dojis are among the most popular candlestick patterns for their frequency. You can find a lot of candlesticks of this type on each timeframe.
To trade a doji, you need to wait until the candle closes. Stop losses can be placed above the doji candlestick when the pattern is at the top, while you can place a stop loss below the doji at the bottom of the market when you buy.
5: Tweezers
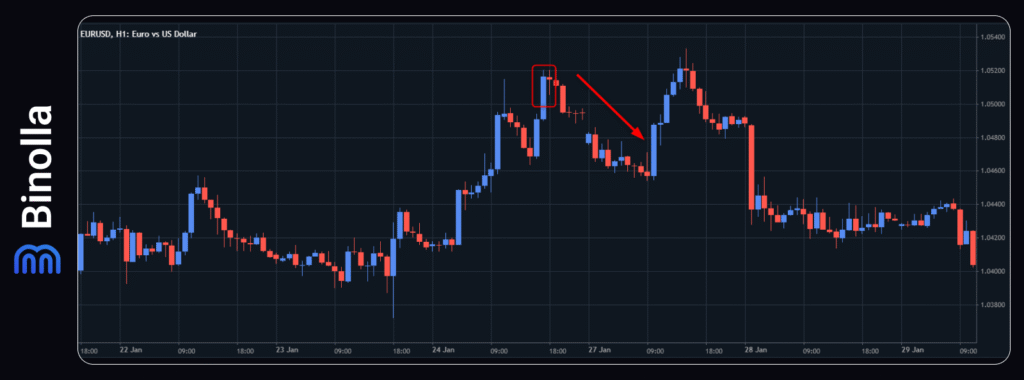
The tweezers pattern is a very simple structure that consists of two candlesticks. The idea behind it is that both should have similar tops or bottoms. If you see that, you can expect the price to correct or reverse.
Tweezers at the resistance level tell you that the quotes are likely to plunge, while if this pattern is formed at the bottom of the market, you can expect the price to surge.
Strategies to Trade The Most Popular Candlestick Patterns
To master these patterns and get the most out of them, it is recommended to stick to some common strategies. Here are some of the most important recommendations for market participants who want to capitalize on financial markets using these formations.
Conservative and Aggressive Entries
There are two ways of entering a trade when using candlestick patterns. The aggressive one is when a trader places a trade right after the formation candlestick (or candlesticks) closes. The risks are higher as there is no confirmation, but the eventual profit is also higher as you buy or sell at a better price.
When it comes to the conservative method, traders wait for confirmation before entering the market. For instance, they place a trade after the next candlestick closes, or they use additional indicators like RSI, Bollinger Bands, and others to find confluence.
Placing Stop Losses
When trading candlestick patterns, it is recommended to place stop losses to mitigate your trading risks. The most common approach is to set this pending order below the pattern’s low at the bottom of the market and above the formation’s high at the top of the market. Keep in mind that placing tight stop losses may lead to losses, especially in highly volatile markets.
Using Various Additional Tools
We have already mentioned that traders can use various tools, such as technical indicators or drawing instruments, to augment their chances of making a profit. For instance, most patterns work only if they are located at the support or resistance levels. Moreover, you can also use trendlines to find reversal candlestick signals along major trends.
Common Mistakes that Traders Make When Using the Most Popular Candlestick Patterns
Candlestick patterns trading is not the clean path. Sometimes, even professional traders make mistakes. Some of them can be found below:
- Trading every pattern without checking the context. Not every pattern that you see on charts is worth your attention. Some of them may appear randomly during the market noise. To avoid this mistake, you should check the market context first and use confirmation tools.
- Using these patterns in sideways markets. Keep in mind that every market move is confirmed by volume. In choppy markets, such patterns may also appear, but the movement is unlikely to bring you much money. It is better to wait for higher volatility and market volume before placing a trade.
- Ignoring major trends. While candlestick patterns can be traded alone, market participants should check major trends before placing trades. For instance, if you want to sell at a shooting star, which appears at a swing during the uptrend, then you should not expect a large downside movement.
- Misreading patterns. When trading a hammer, for instance, you can confuse it with a hanging man, which appears at the resistance level. Therefore, in order to avoid such mistakes, always look at the current position of the pattern.
To make it clearer, we have prepared a special candlestick patterns cheat sheet that you can use to improve your chances of making money.
| Pattern | Direction | What It Looks Like | Market Signal | Best Location | Confirmation Tip |
| Hammer | Bullish | Small body, long lower wick | Reversal from a downtrend | Support zone or after decline | The next candle closes bullish above the body |
| Inverted Hammer | Bullish | Small body, long upper wick | Potential reversal | End of downtrend or strong support | Bullish close on next candle |
| Shooting Star | Bearish | Small body, long upper wick | Reversal from an uptrend | Resistance zone or top of the rally | A bearish candle follows |
| Hanging Man | Bearish | Small body, long lower wick | Weakening uptrend | At the top of the uptrend or near resistance | Bearish confirmation candle |
| Bullish Engulfing | Bullish | The large green candle fully engulfs the red candle | Strong bullish reversal | Bottom of a downtrend | Volume rise + breakout candle |
| Bearish Engulfing | Bearish | A large red candle engulfs the prior green candle | Strong bearish reversal | Top of uptrend or near resistance | Follow-through selling a candle |
| Doji (Dragonfly) | Bullish | Open & close at top, long lower wick | Possible bullish reversal | Strong support | Bullish candle closes above the doji |
| Doji (Gravestone) | Bearish | Open & close at the bottom, long upper wick | Potential bearish reversal | Resistance or market top | Bearish close below the doji |
| Tweezer Bottoms | Bullish | 2 candles with the same low | Short-term reversal | Support zone or swing low | Break of local high confirms |
| Tweezer Tops | Bearish | 2 candles of the same height | Short-term bearish signal | Resistance or swing high | Break below the local low |
Conclusion
The most profitable candlestick patterns allow you to make money during your trading sessions. They frequently appear on charts and provide market participants with a lot of opportunities throughout the day. By using them, you can increase your chances of predicting the upcoming price movement and maximize your profits.
FAQ

Are Candlestick Patterns Reliable Enough?
Yes, they are. Candlestick patterns are used by many professional traders to provide them with information about future price fluctuations.
Which Patterns Are the Most Profitable?
There is no single most profitable pattern. All of them are reliable enough, and depending on the context, you can use various candlestick formations.
Can I Apply Candlestick Patterns with All Assets?
Yes, you can. Traders can use candlestick patterns with various types of assets.
Which Timeframes Are Best for Using Candlestick Patterns?
While you can use these patterns on various timeframes, including even seconds, it is better to apply such strategies on higher periods. This will allow you to avoid market noise.
Can I Use Indicators with Candlestick Patterns?
Yes, you can. Sometimes using indicators will help you empower your strategies with useful tools and improve your trading results.
Can a Beginner Trader Use Candlestick Patterns Effectively?
Yes, they can. Whether you are a beginner or a skilled trader, you can use these patterns effectively.
