The FOMC Meeting: How This Event Will Impact Various Assets This Week

The FOMC meeting that will take place this week, is likely to bring a lot of volatility due to a couple of factors. First, the Fed is likely to cut the Federal Funds rate by 25 basis points, which is currently one of the key reasons for USD to tremble. The second is the forecast and future monetary policy guidance that will be announced by the Federal Reserve.
The upcoming events influence price fluctuations already as we can see on the charts. However, we expect the volatility to rise significantly by the end of the American session on Wednesday.
Contents
EUR/USD: Sideways Trading Ahead of the FOMC Meeting
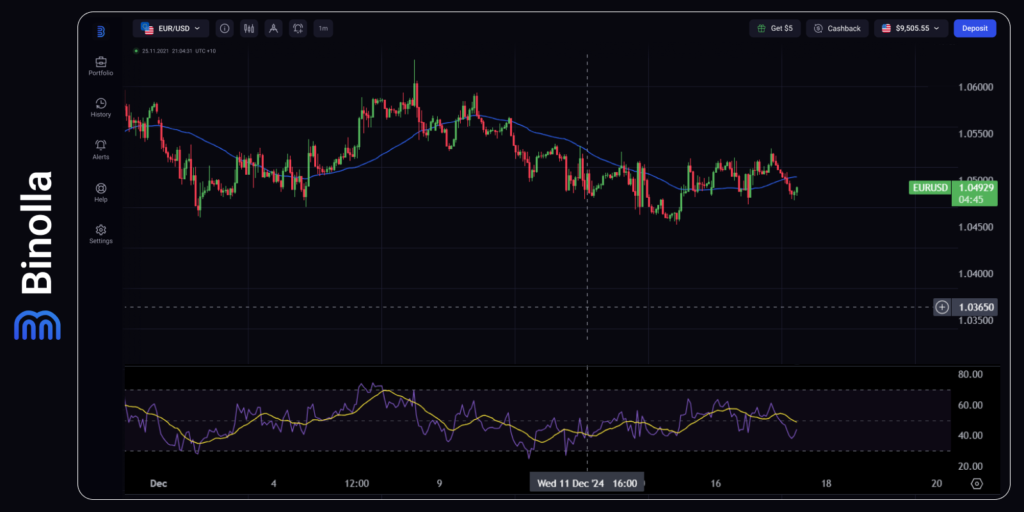
The currency pair is trading sideways ahead of the FOMC meeting. The recent Eurozone data released on Monday was mixed. While the services sector in Germany jumped over 50, which means that it was expanding in November, the manufacturing sector continued its downside and hit another historic low of 41.9, which put some short-term pressure on the EUR.
According to the ECB head Christine Lagarde, The European Central Bank is ready to react and cut rates in 2025, but they need more data, including inflation to be sure they are on the right way. EURUSD is currently supported by the fact that the FOMC is expected to but rates by 25 basis points. However, after the meeting, the situation may change as the Fed’s comments were more cautious recently.

When it comes to the technical side, EUR/USD is trading within a narrow horizontal range. The currency pair is currently below the SMA50 but it moves higher to test the indicator. The upside is limited by 1.0520, while the downside is protected by 1.0480. We expect the currency pair to widen this range a bit, but it is unlikely that a new trend to appear before the FOMC meeting results are announced.
GBP/USD: The UK Inflation in Focus
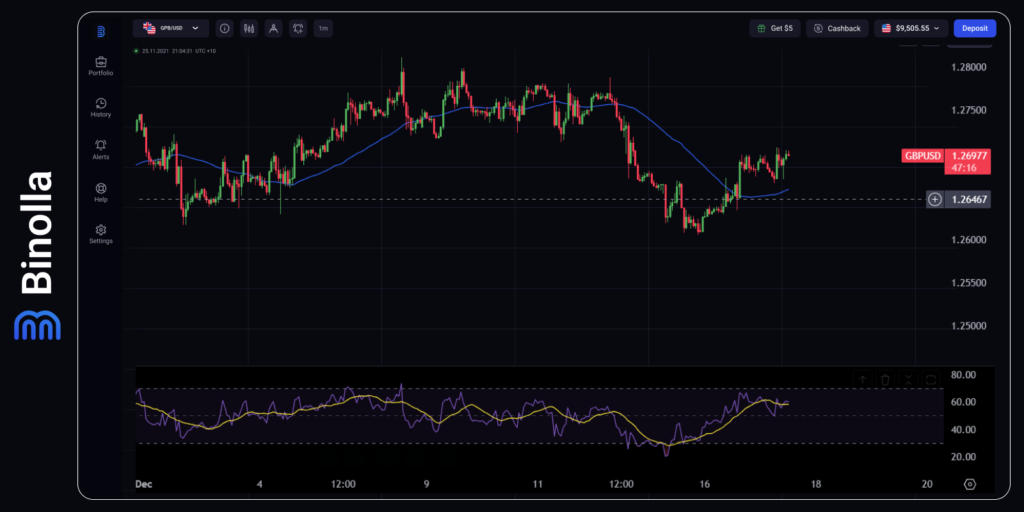
The UK inflation data supports GBP currently as it is expected that yearly CPI will rise from 2.3% to 2.6%, which will prevent the BoE from taking more expansionary steps in the near future. According to the latest economic data, the British economy is still fit with some negative figures, but the inflation data is the key parameter to watch currently.
On the other hand, the currency pair is supported by the fact that the FOMC is likely to cut rates by 25 basis points.

When it comes to technical analysis, GBP/USD is trading above the SMA50 but in quite a tight range, which means that the volatility is low ahead of the UK and US data. The support level is at the SMA50, from where traders can go long targeting 1.2700 and then 1.2770. On the downside, the currency pair should break below the SMA50 in order to target 1.2605.
USD/JPY: Ahead of the BoJ Meeting
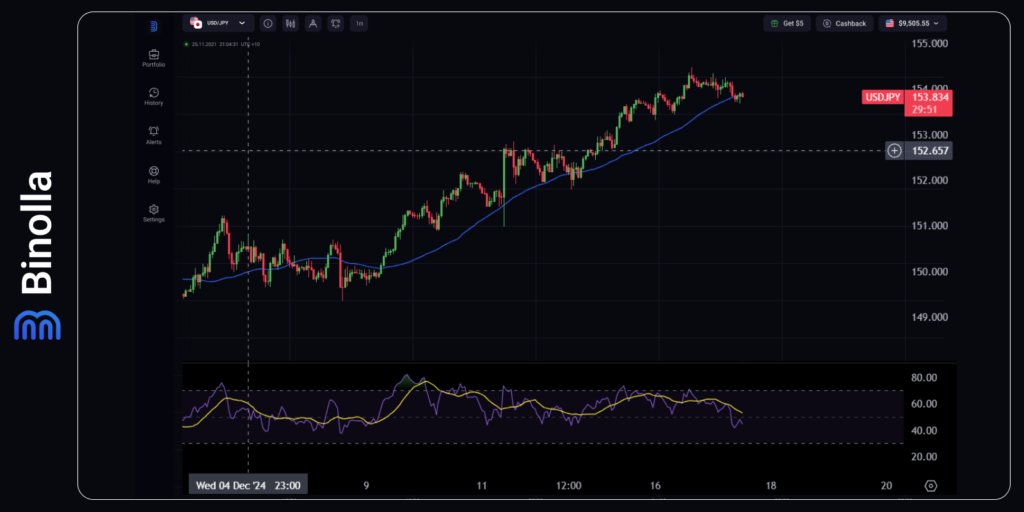
The Japanese yen fails to find support as market participants do not expect the Bank of Japan to hike rates during the BoJ meeting this week. While the rate is expected to remain unchanged, this is not a supportive factor anymore as it is already included in the price. Moreover, some dovish comments from the BoJ representatives have put pressure on the currency recently. On the other hand, the US dollar loses support as well, but the upcoming meeting results are already priced in, while the FOMC members are unlikely to stick to the expansionary policy in the beginning of 2025.

When it comes to technical analysis, USD/JPY is gaining strength as it stays above the SMA50. Currently, the currency pair is testing this support area. On the upside, it should go beyond above 154.50 in order to resume the uptrend. On the downside, if USD/JPY breaks below the SMA50, the closest support level will be at 152.70.
XAU/USD: Gold Remains Under Pressure
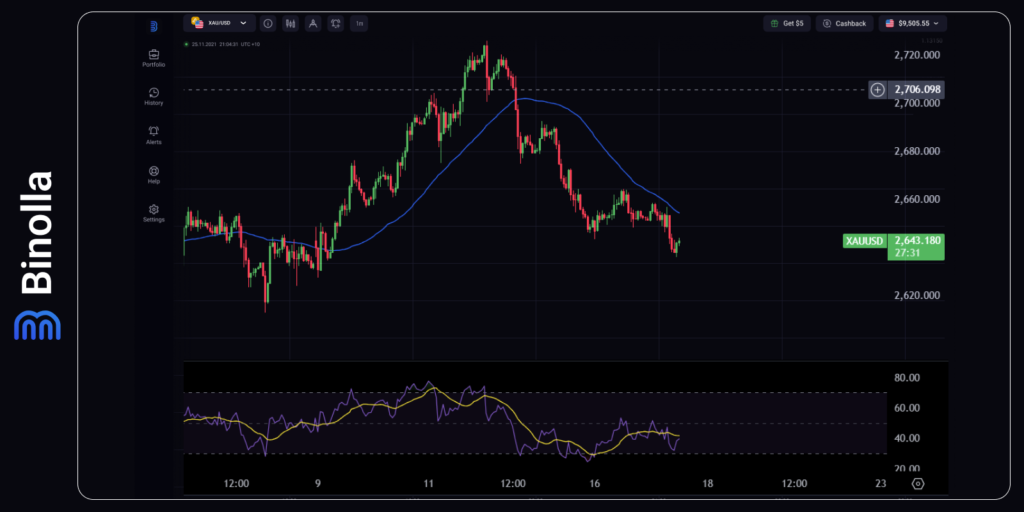
The situation with gold is still unclear as it is supported by the geopolitical instability from one side and the interest in risky assets on the other. The situation in the Middle East remains complex. Moreover, the upcoming tariffs on China’s goods in the United States do not support gold as Beijing is one of the major consumers of the precious metal. When it comes to the US dollar, it was already mentioned that the Federal Funds rate cut was almost priced in and currently market participants look into future and evaluate the probabilities of the next steps by the Fed.

Gold remains under the SMA50 on the hourly chart, which is the closest resistance level currently. On the downside, XAU/USD can reach 2615 as the closest target, while on the upside the nearest resistance is at 2665 if gold manages to break above the simple moving average.


