The EUR/USD Remains Stable Around 1.0800 Ahead of Significant Upcoming Events.

EUR/USD remains within a consolidation phase near the 1.0800 level early on Tuesday, following a positive close on Monday. The currency pair maintains stability as market attention shifts towards crucial upcoming events.
The region between 1.0790 and 1.0800, marked by the Fibonacci 50% retracement of the recent downtrend and a static level, acts as the initial resistance for EUR/USD. Should the pair breach this zone and establish it as support, potential targets include 1.0830 (Fibonacci 61.8% retracement) and 1.0900 (Fibonacci 78.6% retracement).
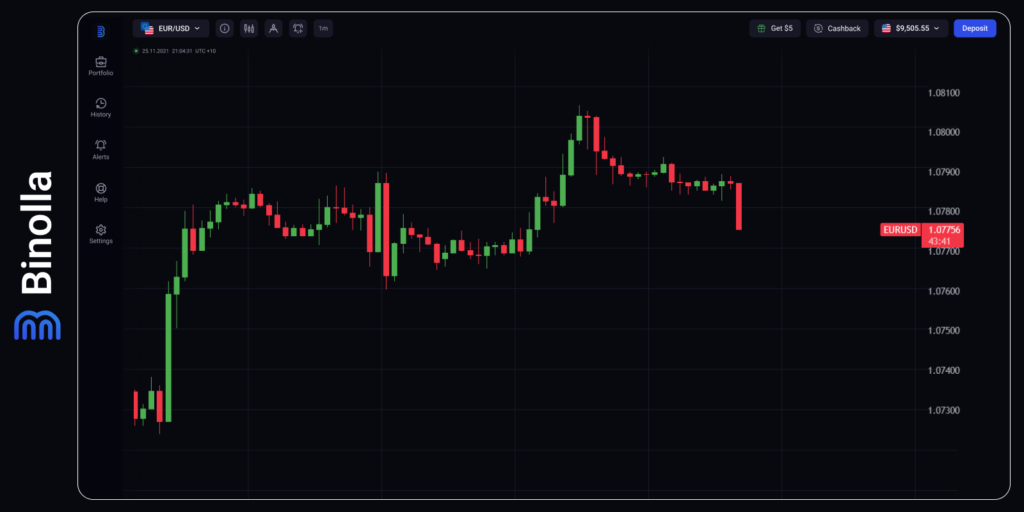
Conversely, support levels are identified at 1.0751-1.0740 (Fibonacci 38.2% retracement, 200-period Simple Moving Average on the 4-hour chart), 1.0720 (100-period SMA), and 1.0700 (Fibonacci 23.6% retracement).
EUR/USD saw modest gains on Monday, buoyed by subdued selling pressure on the US Dollar (USD). The pair continues to trade cautiously below the 1.0800 mark ahead of significant market-moving events.
Improvements in risk sentiment at the start of the week tempered demand for the USD, allowing EUR/USD to edge higher. Federal Reserve Vice-Chairman Philip Jefferson’s comments advocating for maintaining current interest rates until signs of easing price pressures supported the USD to some extent.
Later today, the US Bureau of Labor Statistics will release April’s Producer Price Index (PPI) data. Expectations for a 0.3% monthly increase in PPI could potentially strengthen the USD, impacting EUR/USD’s direction. Conversely, a softer-than-expected PPI print could fuel risk appetite, weakening the USD and aiding EUR/USD’s upward movement.
Furthermore, market participants keenly await Federal Reserve Chairman Jerome Powell’s speech. Any indication from Powell regarding a delay in policy adjustments could bolster the USD against its counterparts. Currently, market expectations suggest a 40% probability of the Fed maintaining the policy rate unchanged in September, as per the CME FedWatch Tool.
GBP/USD is Hovering Around the 1.2550 Mark Following the Release of UK Jobs Data
GBP/USD struggles to extend gains from Monday and remains around 1.2550 during Tuesday’s European session. Despite UK jobs data showing an as-expected rise in the Unemployment Rate to 4.3% for the three months ending in March, the currency pair fails to react significantly.
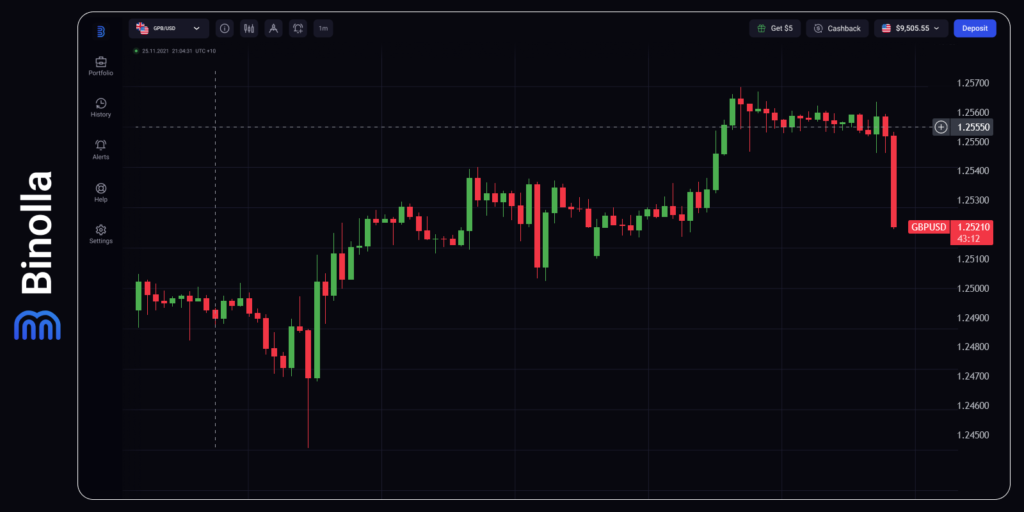
The 20-day and 200-day Simple Moving Averages converge at the pivotal level of 1.2550. GBP/USD may attract bullish interest upon establishing support above this level, targeting 1.2590-1.2600 and 1.2635 subsequently.
Conversely, downside support levels include 1.2500, 1.2450, and 1.2400.
In London’s Tuesday session, the Pound Sterling maintained a narrow range near 1.2560 as investors digest the latest UK employment data. The Office for National Statistics reports a third consecutive decline in the labor market, with 177,000 job losses compared to 156,000 in the previous quarter. The Unemployment Rate reaches 4.3%, in line with expectations, reflecting the economic strain amidst the Bank of England’s tightening monetary policy.
The current data environment suggests a conducive atmosphere for the BoE to consider interest rate reductions, given the consistent softening in price pressures. However, robust wage growth remains a key concern for policymakers, fueling service inflation.
Annual Average Earnings, excluding and including bonuses, maintained steady growth at 6.0% and 5.7%, respectively, for the March quarter. Expectations for a slowdown in Average Earnings, including bonuses, to 5.3% were not met.
As the UK economy navigates through these dynamics, investors remain attentive to further developments, particularly regarding monetary policy adjustments and their impact on GBP/USD movement.
USD/CAD Maintains Levels Above 1.3650 as Investors Await US PPI Data
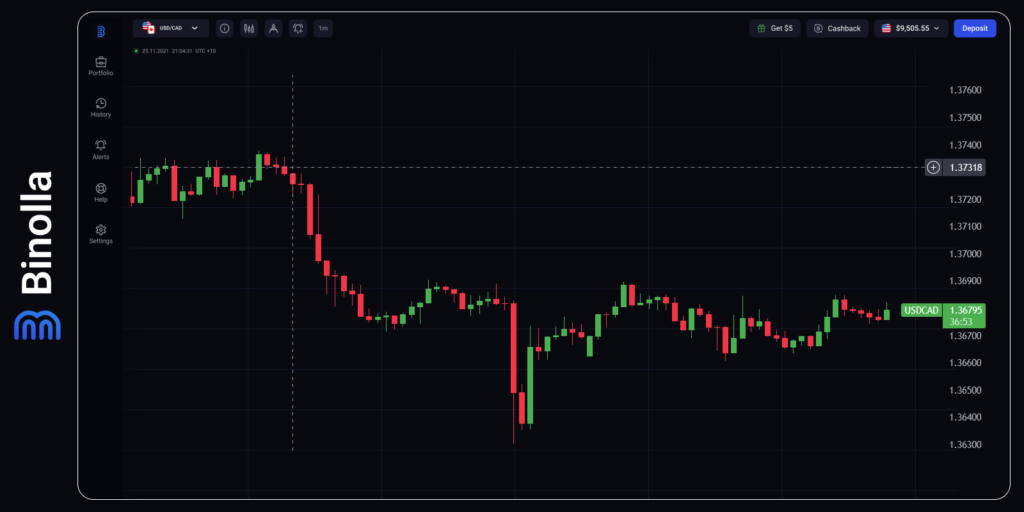
During Tuesday’s Asian session, the USD/CAD pair shows strength around 1.3675. With minimal Canadian economic data scheduled for the week, attention turns to the US Producer Price Index (PPI) on Tuesday and the Consumer Price Index (CPI) on Wednesday.
Recent statements from various Federal Reserve (Fed) officials suggest a preference for maintaining higher interest rates to curb inflation. Fed Chair Jerome Powell, while stating an interest rate hike as “unlikely,” didn’t completely dismiss the possibility, emphasizing the need for increased confidence in inflation trends aligning with the Fed’s 2% target.
Dallas Fed President Lorie Logan echoed concerns of inflation risks, advocating against premature interest rate cuts. This narrative supports the US Dollar, potentially benefiting the USD/CAD pair in the near term.
Conversely, declining crude oil prices weigh on the commodity-linked Canadian Dollar (CAD), given Canada’s significant role as a US oil exporter. However, upbeat Canadian employment data for April may prompt the Bank of Canada (BoC) to delay policy adjustments, potentially limiting CAD downside pressure.
The Price of Gold Inches Up as Investors Anticipate US PPI Data and a Speech by Fed Chair Powell
Despite the US Dollar (USD) consolidating on Tuesday, the price of gold (XAU/USD) rebounds. However, the upside potential for the yellow metal could be limited as traders await key US inflation data later this week.
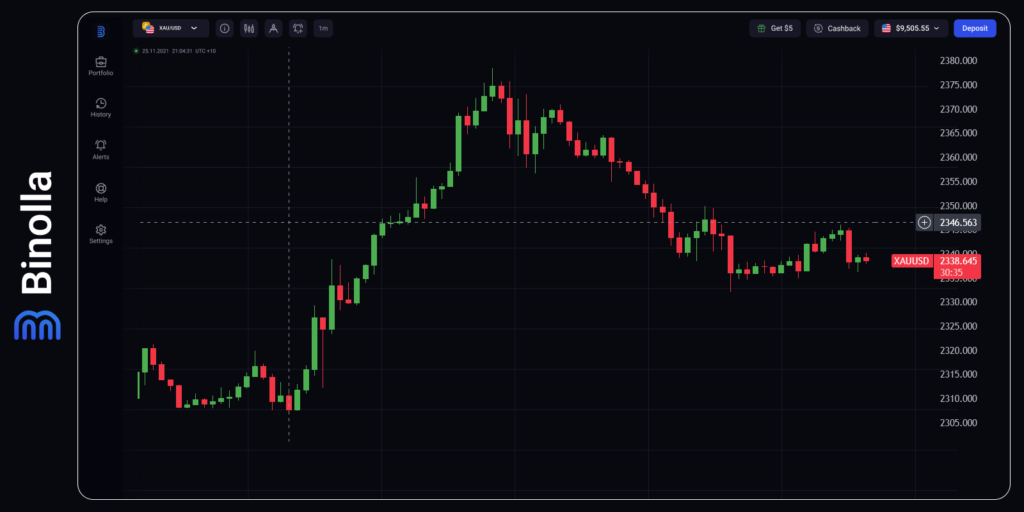
Gold prices continue their upward trend, maintaining above the significant 100-day Exponential Moving Average (EMA) on the four-hour chart. Supported by the bullish territory of the 14-day Relative Strength Index (RSI), currently at 52.70, there’s an indication that the support level is likely to hold.
Immediate resistance for gold is seen at $2,378, followed by the psychological barrier of $2,400. Further gains could lead to a rally towards the all-time high near $2,432, with potential milestones at the $2,500 mark.
Conversely, crucial support is expected in the $2,325–$2,340 zone, marked by the resistance-turned-support level and the 100-period EMA. A breach of this level may expose a downside towards the May 2 low at $2,281.
The Price of Bitcoin Makes Efforts to Reverse Its Market Structure
In the H4 time frame, the Bitcoin price demonstrates a bullish bias, consolidating along an ascending trendline. The Relative Strength Index (RSI) indicates several higher highs, signaling an increasing bullish momentum.
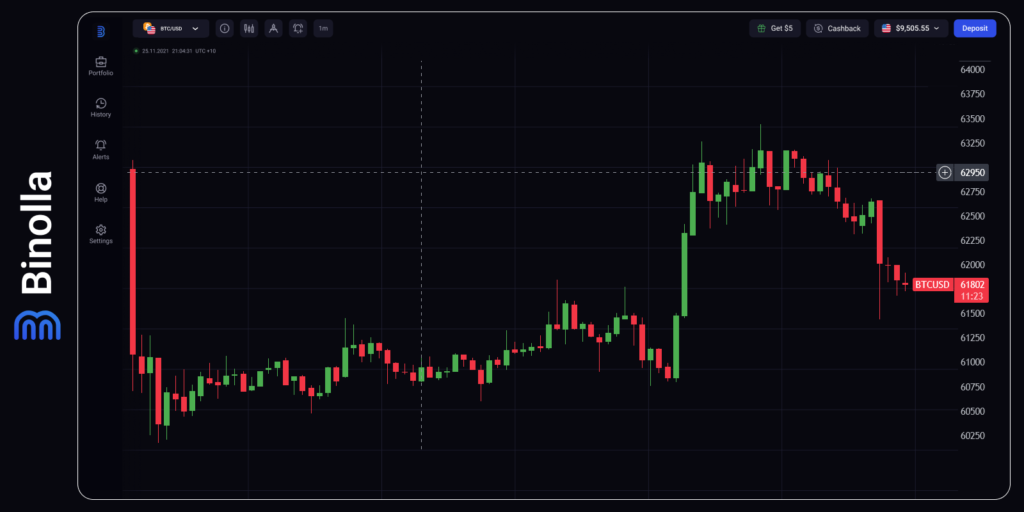
To alter the current market structure, the bulls need to propel BTC above $65,500 and sustain a stable candlestick above this level on the four-hour chart. Such a breakthrough would open the path towards the $72,797 threshold, with potential further gains towards reclaiming the all-time high at $73,777.
Alternatively, if the bears gain control, Bitcoin’s price might decline, breaking below the support confluence formed by the ascending trendline and the horizontal line at $60,630. A breach of the psychological level at $60,000 could trigger panic selling, potentially driving the price down to the $56,552 support level before any potential recovery.
The 26% Target Objective for Ethereum Price Might not be Achieved
The consolidation of Ethereum price within a falling wedge pattern persists, accompanied by indications of a bullish reversal technical formation that could lead to a potential 26% target objective. However, uncertainty arises as Bitcoin conceals its directional bias, weakening this potential.
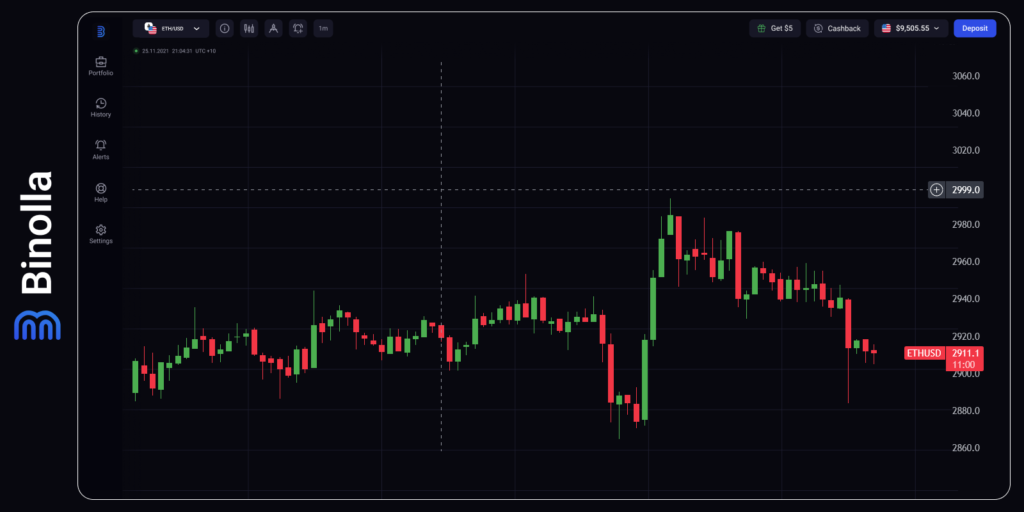
Notably, Ethereum price has breached the ascending trendline, exacerbated by equal lows on the RSI. A breakdown of RSI support could result in further decline, potentially extending the downtrend below the $2,900 threshold.
Conversely, strengthened buyer momentum above current levels might propel Ethereum’s price above the $3,212 resistance level. A decisive close above this level in the one-day timeframe could trigger a breakout, potentially driving ETH up by 26% to $4,083.


