The Alligator Indicator: How to Use It in Trading
The Alligator indicator belongs to the trend category, which means that you can use it to follow price movement directions. This technical analysis tool was designed by Bill Williams, a famous US trader. When using it, you can find the moment when a new trend is born and when a price movement is at the point of exhaustion. By reading this article, you will learn more about Alligator and how to use it. Enjoy trading with Binolla and apply Alligator to your strategies.
Contents
- 1 Why Alligator?
- 2 The Lines of the Alligator Indicator
- 3 How to Add Alligator to the Binolla Platform
- 4 The Phases of the Alligator Indicator
- 5 Test Alligator on the Binolla Platform!
- 6 Various Strategies with the Alligator Indicator
- 7 Alligator and Risk Management
- 8 Pros and Cons of Using Alligator in Trading
- 9 Conclusion
- 10 FAQ
Why Alligator?
The indicator is named after an African animal. The analogy comes from how it works and what you can see on the chart when you apply it. The idea here is when there is no trend and the price fluctuates in a narrow range, the animal is sleeping. However, once a trend begins to show up, the alligator wakes up and opens up his mouth.
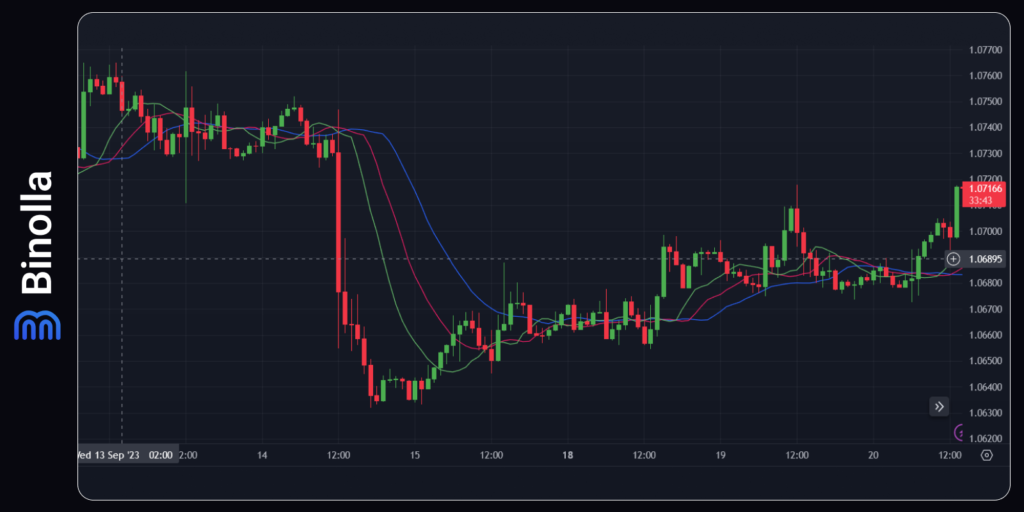
As you can see in the image above, the indicator has two main positions. When the blue, red, and green lines are intertwined, there is no trend and the price has minor fluctuations. However, once the lines take a direction and the distance between them widens, you can expect the price to make a decision about the trend.
If we go back to this analogy with the alligator, the sleeping phase starts when the lines cross each other. The animal remains dormant for a while until the moment when moving averages choose a direction and the distance between them increases. This is the exact moment when a trend begins. They say the alligator awakes at this point. The animal is hungry. Three lines align and go in the same direction, which indicates the current trend.
The Lines of the Alligator Indicator
The Alligator indicator comprises three lines—green, red, and blue—that represent three moving averages of different periods. Similar to the whole indicator, these lines have poetic names themselves:
- Jaw. This is the slowest moving average, with a period of 13 and a shift of 8 bars. The color of this line is blue;
- Teeth. This red line is located in the middle and has a period of 8 with a 5-bar shift forward;
- Lips. This is the fastest moving average with a period of 5 and a 3-bar shift forward. The line is colored green.
Now that you know the basics of the indicator, it is time to see how to apply it when you are trading with Binolla and watch how the technical tools behave in different situations.
How to Add Alligator to the Binolla Platform
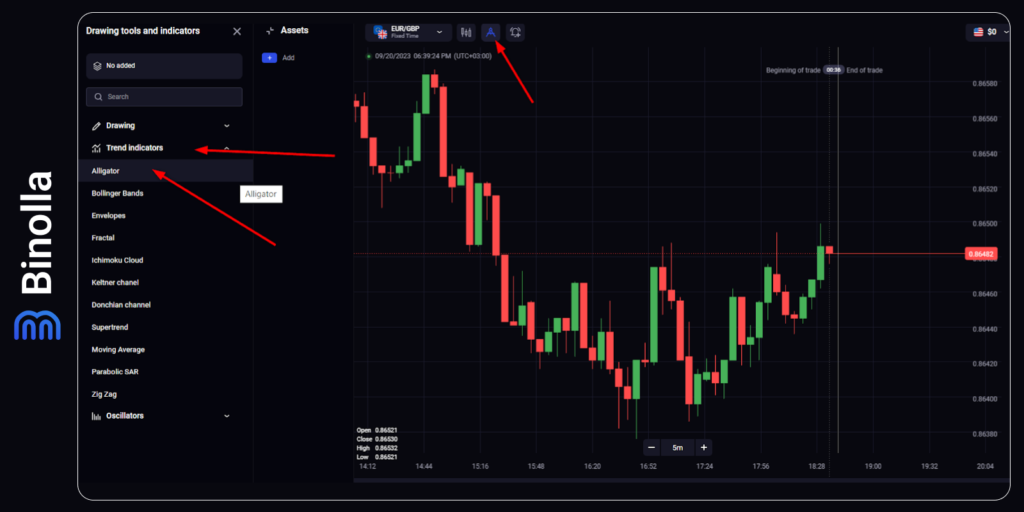
To start using the Alligator indicator, you need to add it first to the chart. When trading with Binolla, you can do it quite simply. Here is a guide on how to apply Alligator to any chart:
- Log in to the platform and click on the tools icon at the top of the screen.
- Choose Trend Indicators at the left part of the screen.
- Pick Alligator once the dropdown menu opens up.
The Phases of the Alligator Indicator
One of the main goals of using this trend-following technical indicator is to define the current state of the market. You can do it easily by simply looking at the chart.
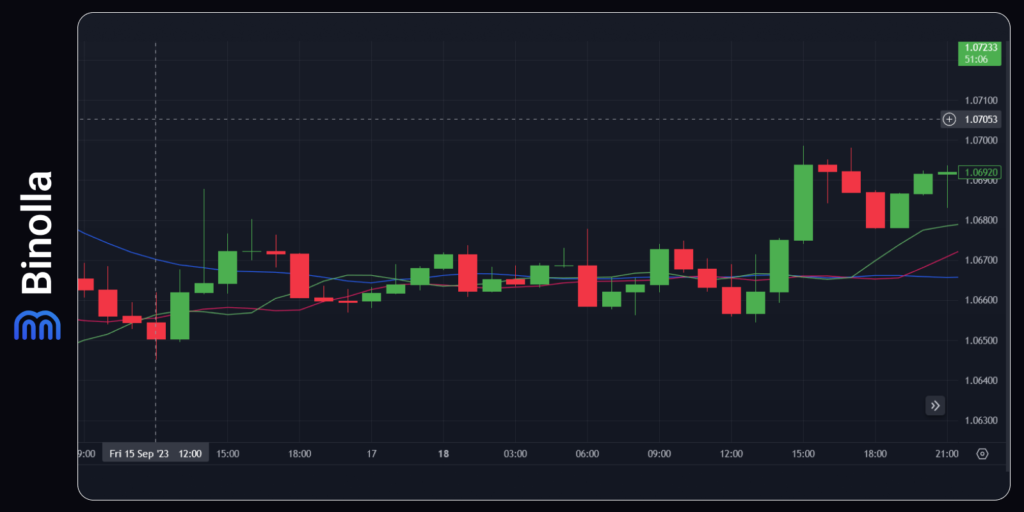
The example above is very illustrative as we have a clear “sleeping” situation here. All three moving averages are intertwined and the price has no clear direction. This phase indicates a period of low volatility and volume. When you see something of a kind on charts, you can avoid trading if you are hunting for massive trends.
However, if you are trading digital options, stocks, or FX CFDs for a shorter period of time like intraday or scalping, you can benefit from such small fluctuations.
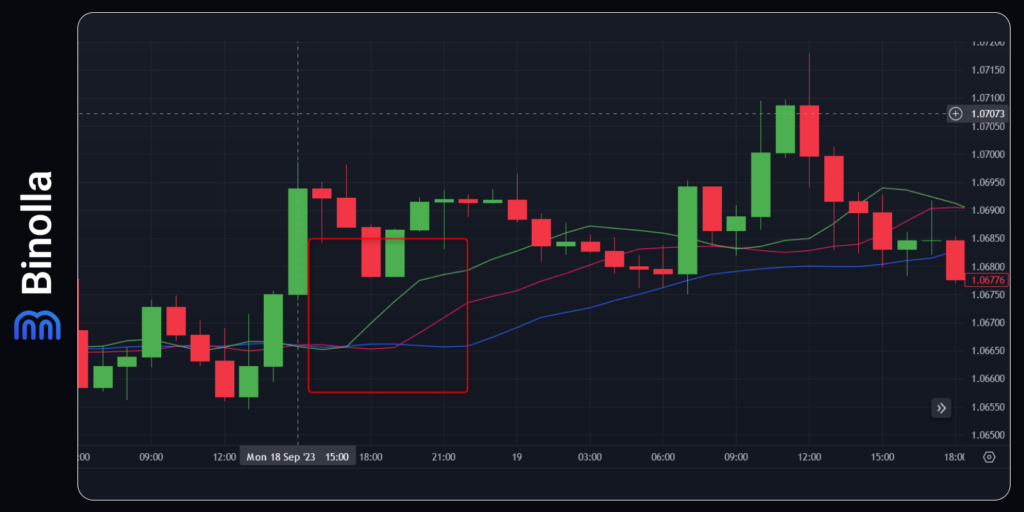
The next important phase of the indicator is awakening. After a sleeping period, the lines spread and become straight. When it comes to price, it can make a breakout of the range where it stood for a while.
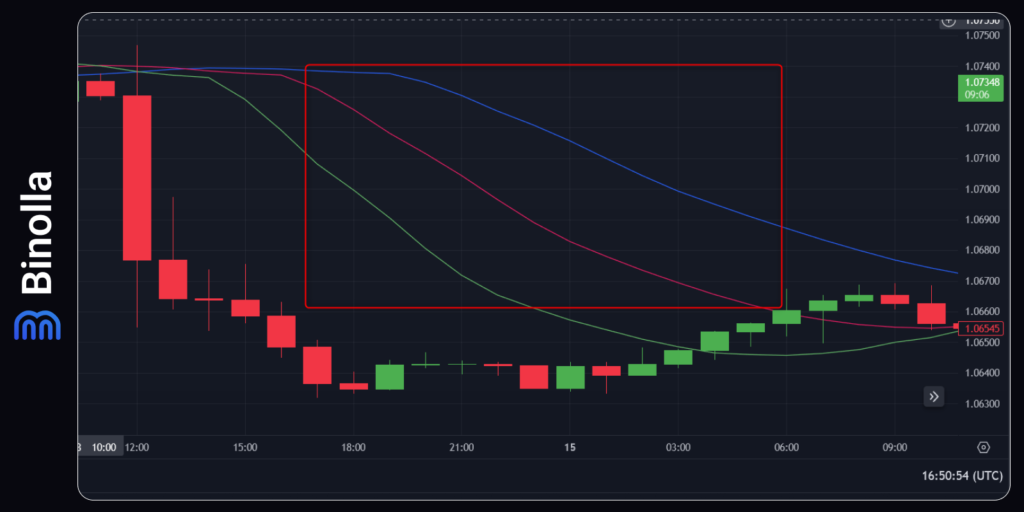
The next phase is known as eating. We have a full-fledged trend, and the volatility is the highest as compared to the sleeping stage. This phase offers a lot of trading opportunities for traders using digital options, stocks, and Forex CFDs.
Various Strategies with the Alligator Indicator
Alligator is a very popular technical indicator, but it comes with both advantages and disadvantages. While this is a powerful tool, most strategies require additional technical indicators to unleash its true power. Trading solely with Alligator will provide you with no clear entry points.
The only simple strategy that you can use with this indicator without blending it with other technical analysis tools is when the alligator is eating. You can buy an asset when all the lines are straight and go upwards and sell when the lines go downwards.
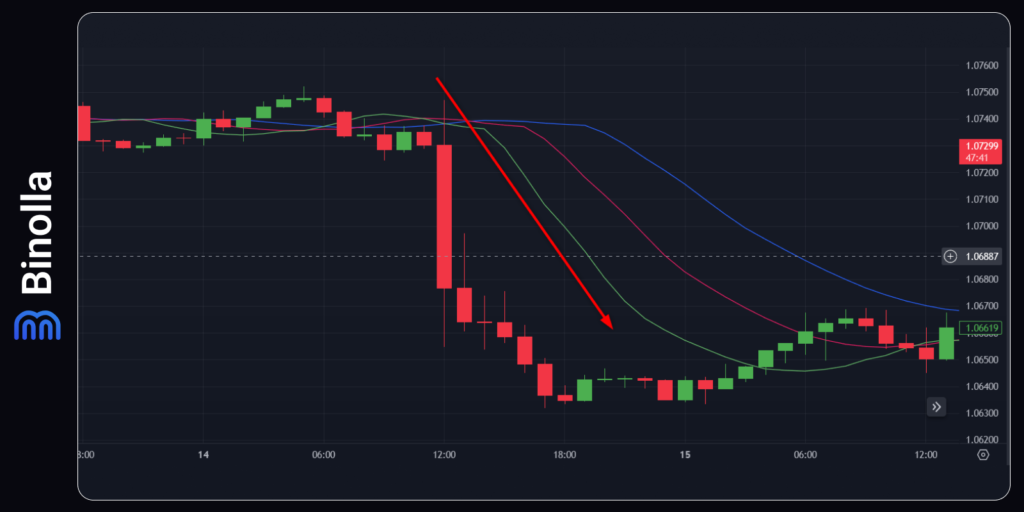
One of the most popular strategies that you can use when trading with Alligator is to add MACD.
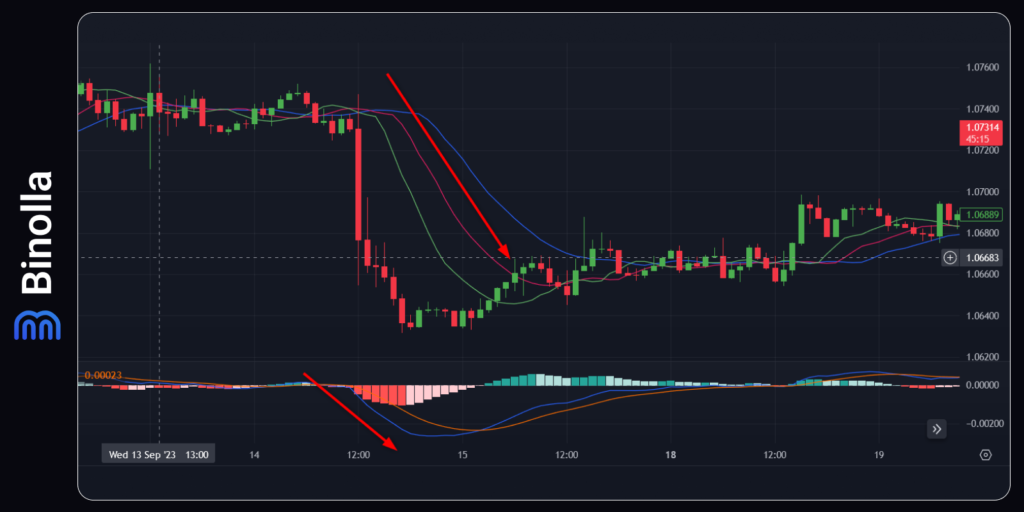
You can use both indicators to find signal confluences and then trade. Whether you are buying digital options contracts or trading stocks/CFDs, this strategy may be interesting to you. The idea here is to look at MACD, and if its histogram goes below 0 and both moving averages move downward, which is confirmed by the Alligator indicator going south as well, then you can buy a Lower digital option contract or sell a currency pair/stock.
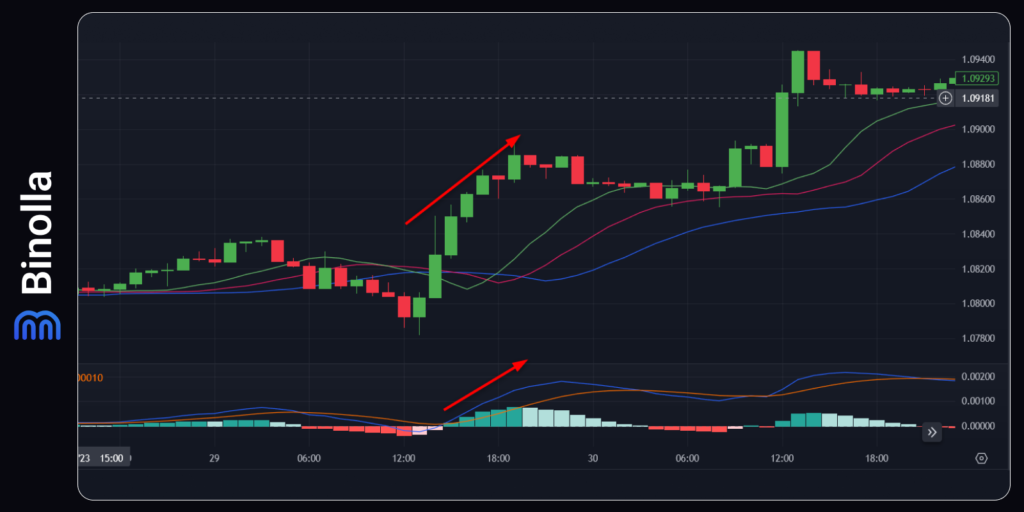
The next example allows you to evaluate how both indicators performed during the uptrend. Once the MACD histogram appears above zero and both moving averages go north, you should have a look at Alligator as well. When all the lines spread and head north, you can buy a Higher contract or simply buy an asset.
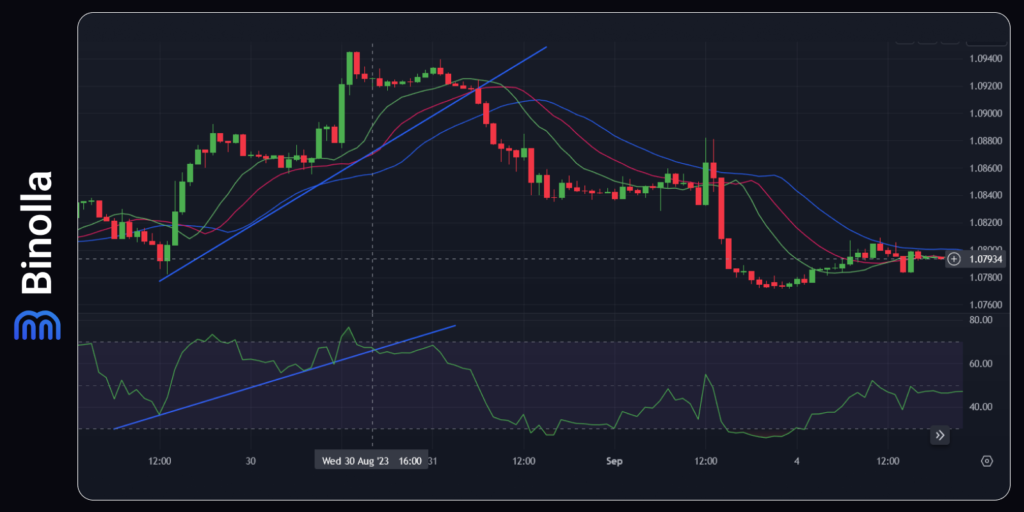
Another strategy that you can use when trading with Alligator is to add RSI. While they are part of different groups, they can brilliantly go together. The idea behind this strategy is to find a moment when the RSI line goes upward in confluence with the Alligator indicator. If this happens, you can buy a Higher contract or buy an asset.
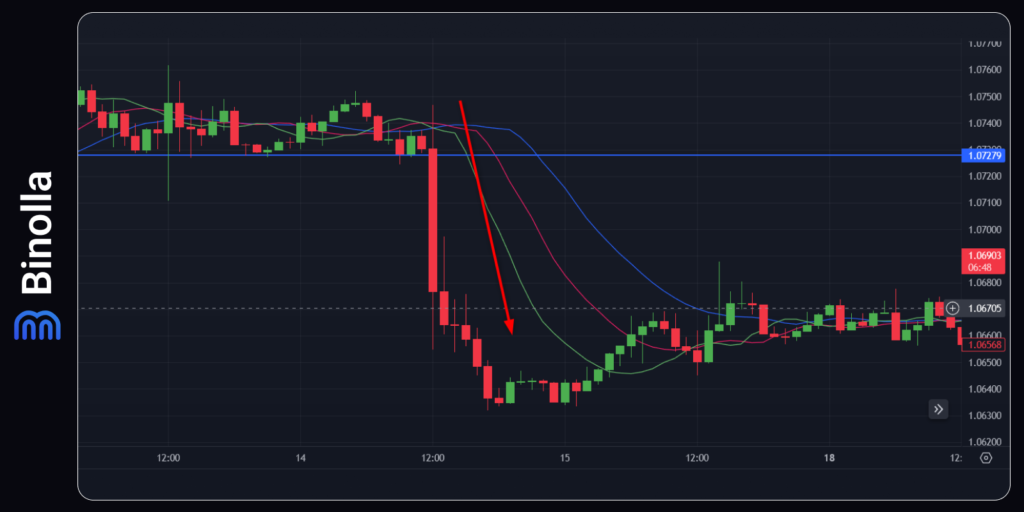
Traders can add drawing tools and have better entry points when using Alligator. For instance, using a support line can be very useful when you apply this indicator. The strategy here is very simple. Once you see that the Alligator indicator is in the sleeping phase, you need to wait until the breakout of the support level. If this happens, you should also take a look at Alligator. If the indicator is awakening, then you can buy a Lower contract or sell an asset.
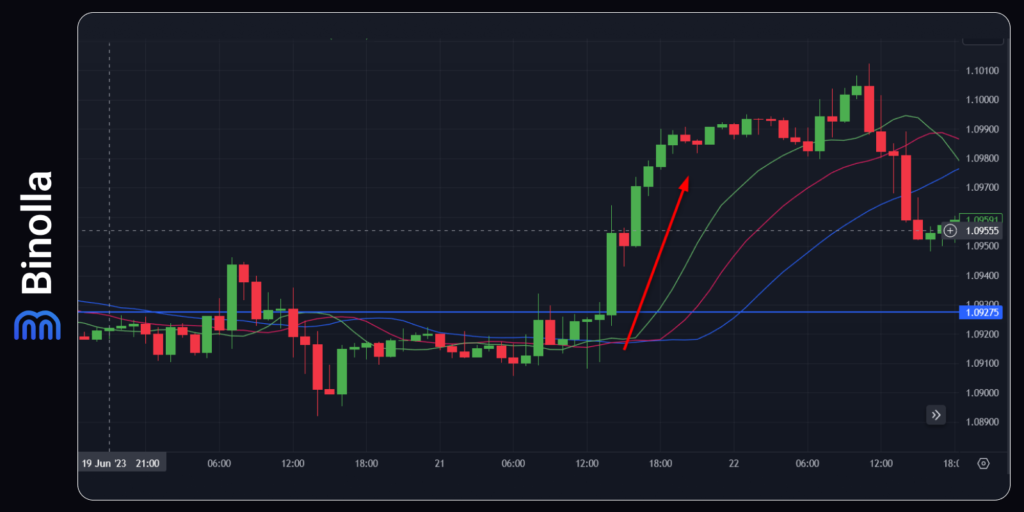
Another strategy that you can apply when using Alligator is based on the resistance level. The idea here is similar to that in the previous strategy, but this time you need to wait until the price makes a breakout of the upper line. The moment this occurs, you need to look at the Alligator indicator. If the lines spread and become targeted in an upward direction, then you can buy a Higher contract or purchase a stock/currency.
Alligator and Risk Management
Digital options traders have some advantages as compared to others, as they don’t need to think about stopping losses when they buy a particular contract. When it comes to FX or stock traders, they have to spend some time and calculate the distance between the current price and the stop loss level.
With Alligator, you don’t need to spend much time on those calculations as you can use the information that is available on the charts to place such protective orders.
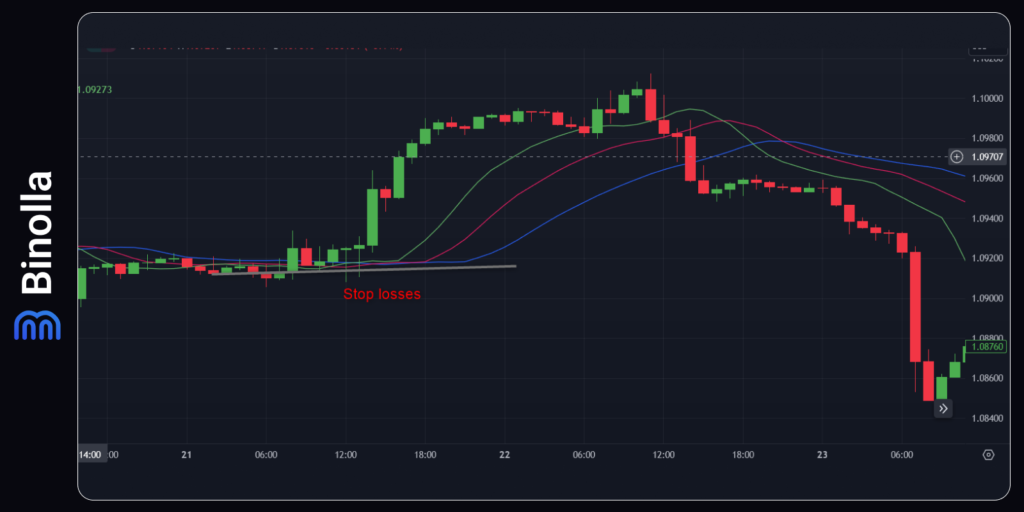
To put a stop to loss when you are buying an asset, you can simply look at the indicator and find the area where the lines are intertwined. As soon as you find this, you can place a stop loss right below this area. For the cases when the Alligator indicator goes downwards, you can place a stop loss right above the lines when they are intertwined.
Pros and Cons of Using Alligator in Trading
The Alligator technical indicator is one of the ways for a trader to define the current market trend. Moreover, it allows traders to see where the trend is in its beginning and exhaustion phases. While Alligator may seem a complete trading system, it is not as it is better to use it with other technical analysis tools to find better entry points. Listed below are the main advantages and disadvantages of this technical analysis indicator.
The Pros of Using Alligator
When trading with the technical indicator, you can expect the following benefits:
- The technical analysis tool is designed to define trends in all types of markets;
- The Alligator indicator sows the dynamic support and resistance levels;
- The indicator allows you to see the current market state;
- With the Alligator indicator, you can find the beginning of a new trend;
- You can also find exit points when you are trading FX CFDs or stocks;
- The indicator has a very user-friendly interface and can be used by both professionals and beginners.
When it comes to drawbacks, they are the following:
- Alligator is almost useless when taken solely. You need to add some other tools to reveal its true power;
- When using Alligator, you may have to adjust its parameters on different timeframes.
Conclusion
The Alligator indicator is a great technical analysis tool that was designed by Bill Williams to define trends and find the moments when the price movement direction changes or the current market state changes.
Moreover, this technical indicator is very illustrative as you can easily read its values on whatever charts even if you are new to trading. The technical analysis tool can be applied to different types of assets and financial instruments, which is an evident advantage of using it.
FAQ

What Is the Alligator Indicator?
This is a technical analysis tool that was designed by Bill Williams to make the difference between trends and flats. By using it, you can easily define the current market state and see those moments when a new trend begins.
Is the Alligator Indicator Accurate?
Yes, it is. The technical indicator shows flats, and trends and is among the best tools to watch those transfers from one market state to another. However, you should keep in mind that it is based on moving averages, which means that Alligator is a lagging indicator and its signals come with some interval.
How Does Alligator Indicator Work?
It has three main states. First, when the price is flat, the alligator is sleeping and this is the time when it is better to avoid trading. Second, when it is awakening, you can add some other technical analysis tools to find entry points. Third, when the “animal” is eating, you can hold your position until it falls asleep again.
What is the Best Timeframe for Alligator?
There is no best timeframe for this indicator as you can use it on every existing interval. However, you should keep in mind that you may be required to adjust the indicator’s settings in order to increase your chances of profiting.

